Askeland D.R., Fulay P.P. Essentials of Materials Science & Engineering
Подождите немного. Документ загружается.

450
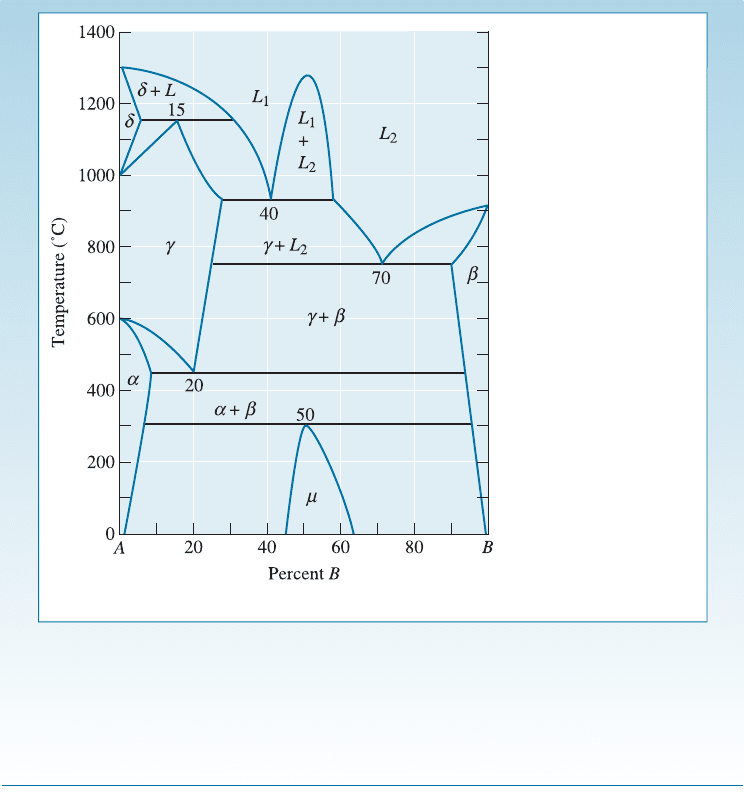
C: This reaction occurs at 20% B:
g ! a þ b; a eutectoid
300
C: This reaction occurs at 50% B:
a þ b ! m or a peritectoid
Figure 11-5 A hypothetical phase diagram (for Example 11-1).
The eutectic, peritectic, and monotectic reactions are part of the solidification
process. Alloys used for casting or soldering often take advantage of the low melting
point and no freezing range of the eutectic reaction. The phase diagram of monotectic
alloys contains a dome, or a miscibility gap, in which two liquid phases coexist. In the
copper-lead system, the monotectic reaction prod uces tiny globules of dispersed lead,
which improve the machinability of the copper alloy. Peritectic reactions lead to non-
equilibrium solidification and segregation.
In many systems, there is metastable miscibility gap. In this case, the immiscibility
dome extends into the sub-liquidus region. In some cases, the entire miscibility gap is
metastable (i.e., the immiscibility dome is completely under the liquidus). These systems
form such materials as Vycor
TM
and Pyrex
8
glasses, also known as phase-separated
glasses. R. Roy was the first scientist to describe the underlying science for the for-
mation of these glasses using the concept of a metastable miscibility gap existing below
the liquidus.
The eutectoid and peritectoid reactions are completely solid-state reactions. The
eutectoid reaction forms the basis for the heat treatment of several alloy systems,
including steel (Chapter 12). The peritectoid reaction is extremely slow, often producing
C H A P TE R 1 1 Dispersion Strengthening and Eutectic Phase Diagrams330
undesirable, nonequilibrium structures in alloys. As noted in Chapter 5, the rate of dif-
fusion of atoms in solids is much smaller than that in liquids.
Each of these three-phase reactions occurs at a fixed temperature and composition.
The Gibbs phase rule for a three-phase reaction is (at a constant pressure),
1 þ C ¼ F þ P
F ¼ 1 þ C P ¼ 1 þ 2 3 ¼ 0;
ð11-1Þ
since there are two components C in a binary phase diagram and three phases P are
involved in the reaction. When the three phases are in equilibrium during the reaction,
there are no degrees of freedom. As a result, these three phase reactions are known as
invariant. The temperature and the composition of each phase involved in the three-
phase reaction are fixed. Note that of these five reactions discussed here only eutectic
and eutectoid reactions can lead to dispersion strengthening.
11-4 The Eutectic Phase Diagram
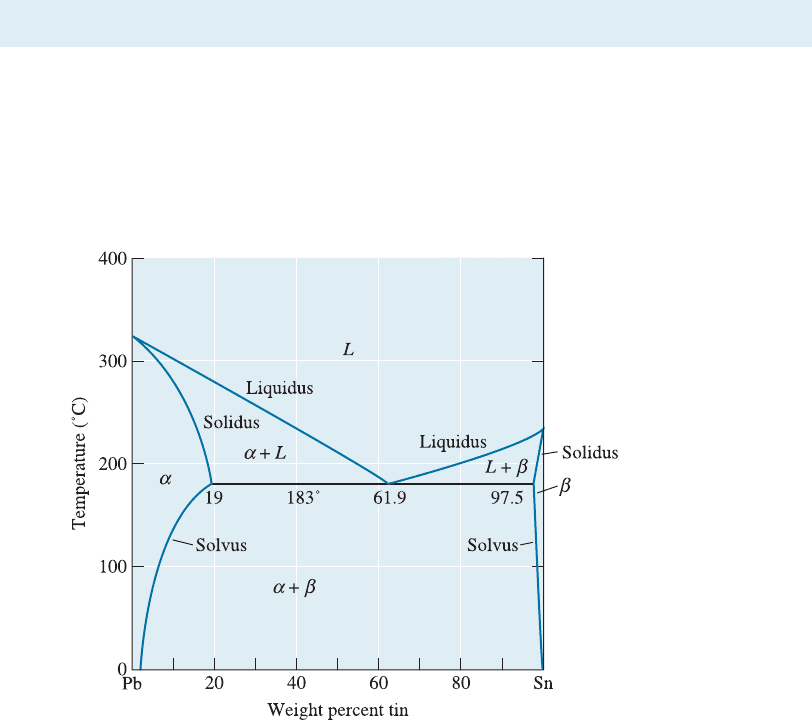
The lead-tin (Pb-Sn) system contains only a simple eutectic reaction (Figure 11-6). This
alloy system is t he basis for the most common alloys used for soldering. As mentioned
before, because of the toxicity of Pb, there is an intense e¤ort underway to replace lead
in Pb-Sn solders with other alloys. We will continue to use a Pb-Sn system, though, as
a convenient way to discuss the eutectic phase diagram. Let’s examine four classes of
alloys in this system.
Solid Solution Alloys Alloys that contain 0 to 2% Sn behave exactly like the copper-
nickel alloys; a single-phase solid solution a forms during solidification (Figure 11-7).
These alloys are strengthened by solid-solution strengthening, by strain hardening, and
by controlling the solidification process to refine the grain structure.
Figure 11-6 The lead-tin equilibrium phase diagram.
11-4 The Eutectic Phase Diagram 331
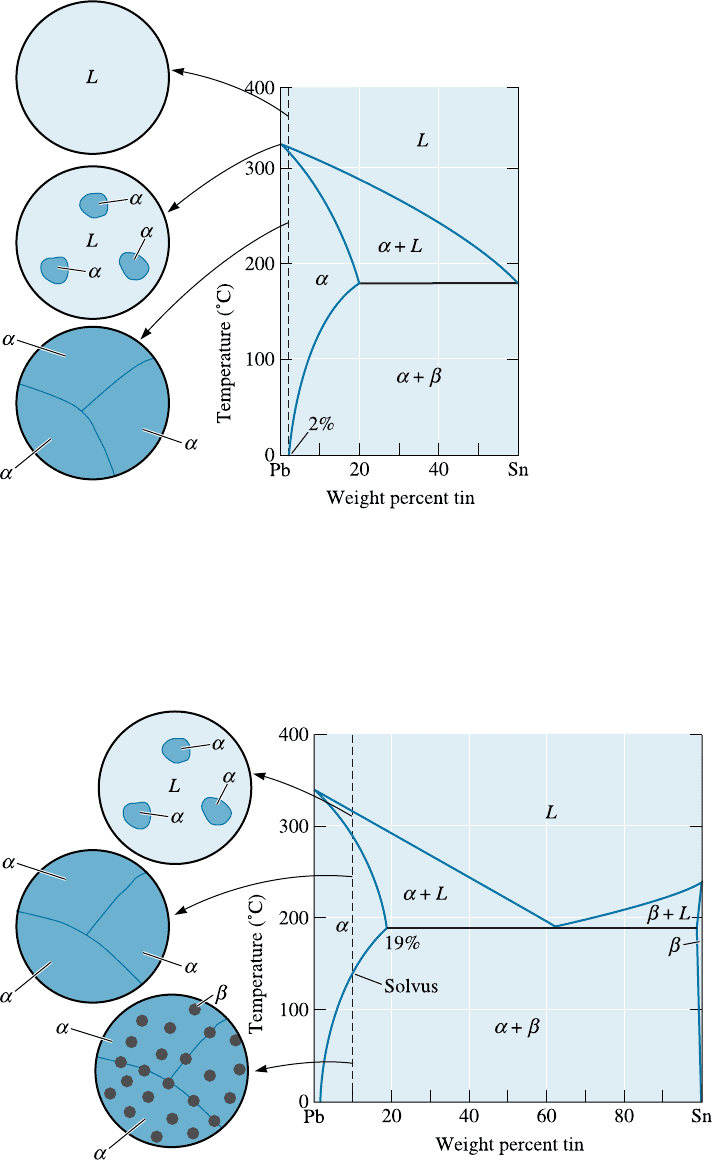
Alloys That Exceed the Solubility Limit Alloys containing between 2% and 19% Sn
also solidify to produce a single solid solution a. However, as the alloy continues to
cool, a solid-state reaction occurs, permitting a second solid phase (b) to precipitate
from the original a phase (Figure 11-8).
Figure 11-7
Solidification and
micro-structure of a
Pb-2% Sn alloy. The
alloy is a single-phase
solid solution.
Figure 11-8 Solidification, precipitation, and microstructure of a Pb-10% Sn alloy. Some
dispersion strengthening occurs as the b solid precipitates.
C H A P TE R 1 1 Dispersion Strengthening and Eutectic Phase Diagrams332

On this phase diagram, the a is a solid solution of tin in lead. However, the sol-
ubility of tin in the a solid solution is limited. At 0
C, only 2% Sn can dissolve in a.As
the temperature increases, more tin dissolves into the lead until, at 183
C, the solubility
of tin in lead has increased to 19% Sn. This is the maximum solubility of tin in lead.
The solubility of tin in solid lead at any temperature is given by the solvus curve. Any
alloy containing between 2% and 19% Sn cools past the solvus, the solubility limit is
exceeded, and a small amount of b forms.
We control the properties of this type of alloy by several techniques, including
solid-solution strengthening of the a portion of the structure, controlling the micro-
structure produced during solidification, and controlling the amount and characteristics
of the b phase. These types of compositions, which form a single solid phase at high
temperatures and two solid phases at lower temperatures, are suitable for age or pre-
cipitate hardening. In Chapter 12, we will learn how nonequilibrium processes are
needed to make precipitation hardened alloys. A phase diagram (e.g., Figure 11-8) that
shows a specific composition is known as an isopleth. Determination of reactions that
occur upon the cooling of a particular composition is known as an isoplethal study. The
following example illustrates how certain calculations related to the composition of
phases and their relative concentrations can be performed.
EXAMPLE 11-2 Phases in the Lead–Tin (Pb-Sn) Phase Diagram
Determine (a) the solubility of tin in solid lead at 100
C, (b) the maximum
solubility of lead in solid tin, (c) the amount of b that forms if a Pb-10% Sn
alloy is cooled to 0
C, (d) the masses of tin contained in the a and b phases,
and (e) the mass of lead contained in the a and b phases. Assume that the total
mass of the Pb-10% Sn alloy is 100 grams. The phase diagram we need is
shown in Figure 11-8. All percentages shown are weight %.
SOLUTION
(a) The 100
C temperature intersects the solvus curve at 5% Sn. The solubility
of tin (Sn) in lead (Pb) at 100
C therefore is 5%.
(b) The maximum solubility of lead (Pb) in tin (Sn), which is found from
the tin-rich side of the phase diagram, occurs at the eutectic temperature of
183
C and is 97.5% Sn.
(c) At 0
C, the 10% Sn alloy is in a a þ b region of the phase diagram. By
drawing a tie line at 0
C and applying the lever rule, we find that:
% b ¼
10 2
100 2
100 ¼ 8:2%
Note that the tie line inters ects the solvus curve for solubility of Pb in Sn (on
the right-hand side of the b-phase field) at a non-zero concentration of Sn.
However, we can not read this accurately from the diagram; hence, we assume
that the right-hand point for the tie line is 100% Sn. The % of a would be
ð100 % bÞ¼91:8%. This means if we have 100 g of the 10% Sn alloy, it will
consist of 8.2 g of the b phase and will consist of 91.8 g of the a phase.
(d) Note that 100 g of the alloy will consist of 10 g of Sn and 90 g of Pb.
The Pb and Sn are distributed in two phases (i.e., a and b). The mass of Sn in
the a phase ¼ 2% Sn 91:8gofa phase ¼ 0:02 91:8g¼ 1:836 g. Since tin
11-4 The Eutectic Phase Diagram 333
(Sn) appears in both the a and b phases, the mass of Sn in the b phase will be
¼ð11 1:836Þ g ¼ 8.164 g. Note that in this case the b phase at 0
C is nearly
pure Sn.
(e) Let’s now calculate the mass of lead in the two phases. The mass of Pb
in the a phase will be equal to the mass of the a phase minus the mass of Sn in
the a phase ¼ 91:8g 1:836 g ¼ 89:964 g. We could have also calculated this
as:
Mass of Pb in the a phase ¼ 98% Sn 91:8gofa phase ¼ 0:98 91:8g
¼ 89:964 g
We know the total mass of the lead (90 g) and we also know the mass of lead in
the a phase, there fore, the mass of Pb in the b phase ¼ 90 89:964 ¼ 0:036 g.
This is consistent with what we said earlier (i.e., the b phase, in this case, is
almost pure tin).
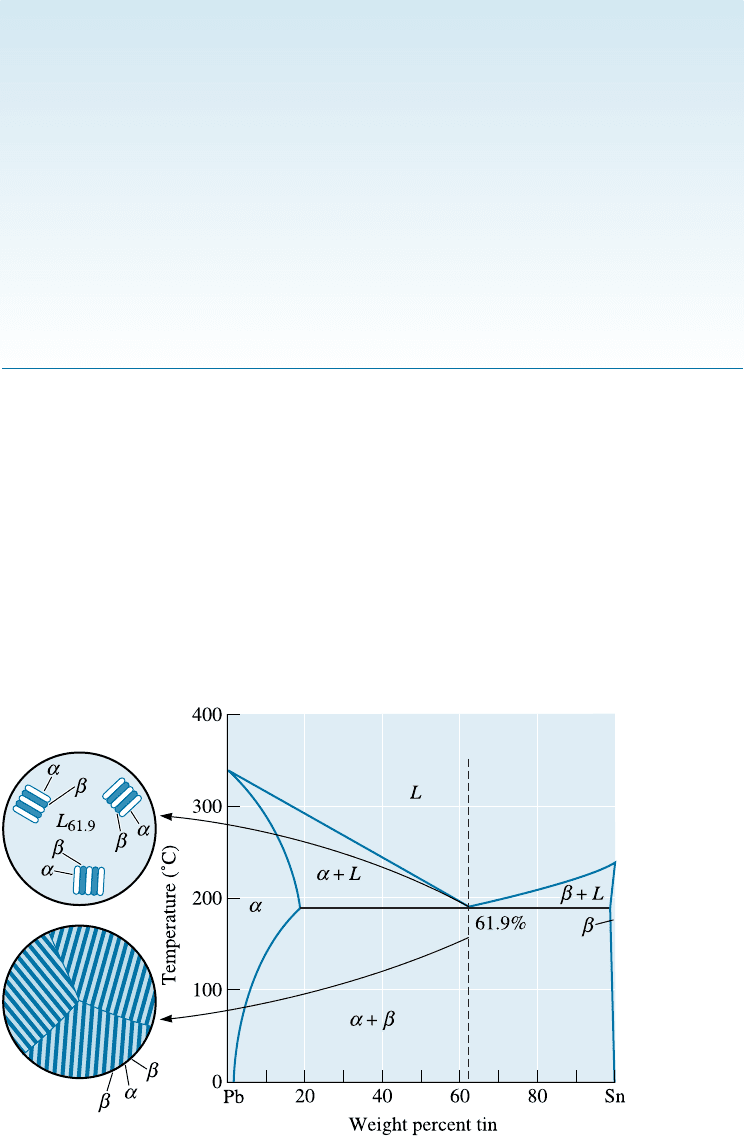
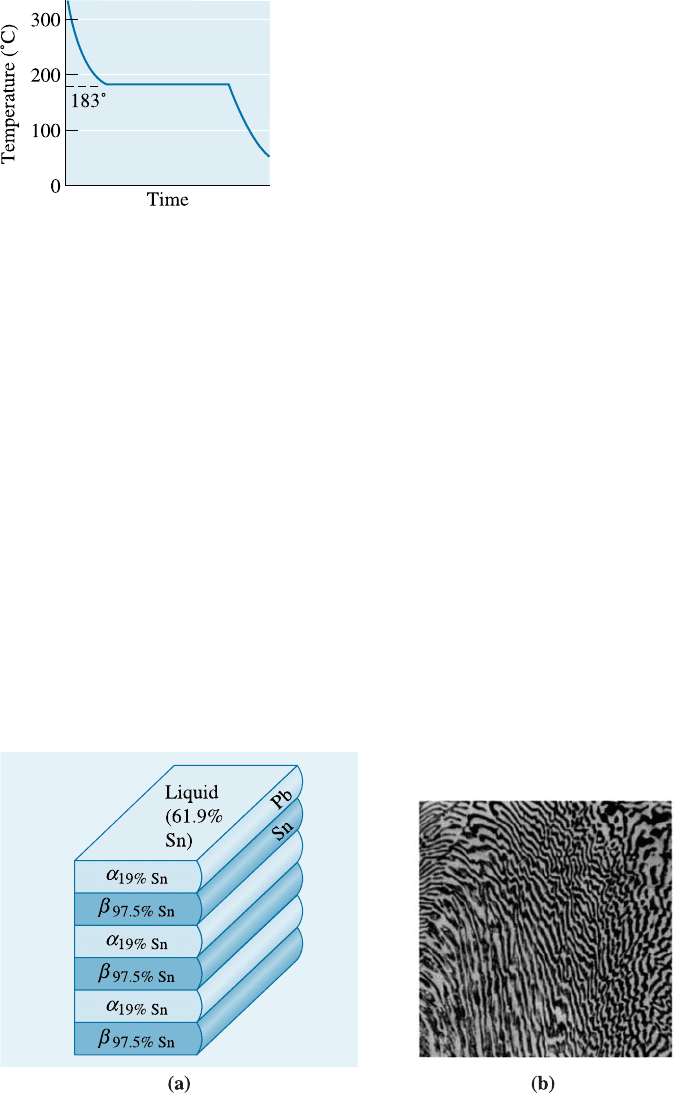
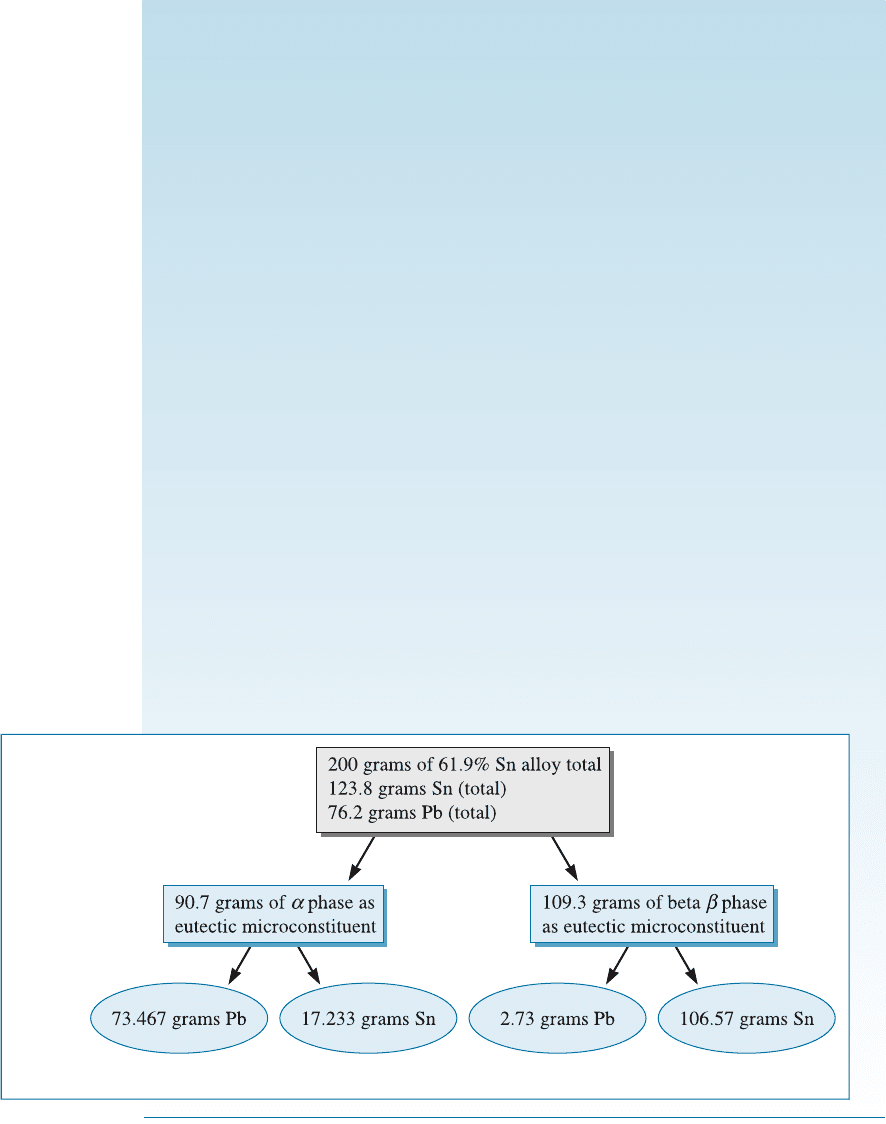
Figure 11-9 Solidification and microstructure of the eutectic alloy Pb-61.9% Sn.
Eutectic Alloys The alloy containing 61.9% Sn has the eutectic composition (Figure
11-9). The word eutectic comes from the Greek word eutectos that means easily fused.
Indeed, in a binary system showing one eutectic reaction, an alloy with a eutectic com-
position has the lowest melting temperature. This is the composition for which there is
no freezing range (i.e., solidification of this alloy occurs at one temperature, 183
Cin
the Pb-Sn system). Above 183
C the alloy is all liquid and, therefore, must contain
61.9% Sn. After the liquid cools to 183
C, the eutectic reaction begins:
L
61:9% Sn
! a
19% Sn
þ b
97:5% Sn
C H A P TE R 1 1 Dispersion Strengthening and Eutectic Phase Diagrams334
Two solid solutions—a and b—are formed during the eutectic reaction. The composi-
tions of the two solid solutions are given by the ends of the eutectic line.
During solidification, growth of the eutectic requires both removal of the latent
heat of fusion and redistribution of the two di¤erent atom species by di¤usion. Since
solidification occurs completely at 183
C, the cooling curve (Figure 11-10) is similar
to that of a pure metal; that is, a thermal arrest or plateau occurs at the eutectic tem-
perature. In Chapter 9, we had stated that alloys solidify over a range of temperatures
(between the liquidus and solidus) known as the freezing range. Eutectic compositions
are an exception to this rule since they transform from a liquid to a solid at a constant
temperature (i.e., the eutectic temperature).
As atoms are redistributed during eutectic solidification, a characteristic micro-
structure develops. In the lead-tin system, the solid a and b phases grow from the liquid
in a lamellar, or plate-like, arrangement (Figure 11-11). The lamellar structure permits
the lead and tin atoms to move through the liquid, in which di¤usion is rapid, without
having to move an appreciable distance. This lamellar structure is characteristic of
numerous other eutectic systems.
Figure 11-10
The cooling curve for an eutectic alloy is a simple
thermal arrest, since eutectics freeze or melt at a single
temperature.
Figure 11-11 (a) Atom redistribution during lamellar growth of a lead-tin eutectic. Tin atoms
from the liquid preferentially diffuse to the b plates, and lead atoms diffuse to the a plates.
(b) Photomicrograph of the lead-tin eutectic microconstituent (400).
11-4 The Eutectic Phase Diagram 335

The product of the eutectic reaction has a characteristic arrangement of the two
solid phases called the eutectic microconstituent. In the Pb-61.9% Sn alloy, 100% of the
eutectic microconstituent is formed, since all of the liquid goes through the reaction.
The following example shows how the amount of eutectic alloy can be calculated.
EXAMPLE 11-3 Amount of Phases in the Eutectic Alloy
(a) Determine the amount and composition of each phase in a lead-tin alloy of
eutectic composition. (b) Calculate the mass of phases present. (c) Calculate
the amount of lead and tin in each phase, assuming you have 200 g of the
alloy.
SOLUTION
(a) The eutectic alloy contains 61.9% Sn. We work the lever law at a temper-
ature just below the eutectic—say, at 182
C, since that is the temperature at which
the eutectic reaction is just completed. The fulcrum of our lever is at 61.9% Sn.
The ends of the tie line coincide approximately with the ends of the eutectic line.
a: ðPb 19% SnÞ % a ¼
97:5 61:9
97:5 19:0
100 ¼ 45:35%
b: ðPb 97 :5% SnÞ % b ¼
61:9 19:0
97:5 19:0
100 ¼ 54:65%
Or we could state that the weight fraction of the a phase ¼ 0.4535, that of the
b phase is 0.5565.
A 200 g sample of the alloy would contain a total of 200 0:6190 ¼
123:8 g Sn and a balance of 76.2 g lead. The total mass of lead and tin cannot
change as a result of conservation of mass. What changes is the mass of lead
and tin in the di¤erent phases.
(b) At a temperature of 182
C, just below the eutectic:
The mass of the a phase in 200 g of the alloy
¼ mass of the alloy fraction of the a phase
¼ 200 g 0.4535 ¼ 90.7 g
The amount of the b phase in 200 g of the alloy
¼ (mass of the alloy mass of the a phase)
¼ 200.0 g 90.7 g ¼ 109.3 g
We could have also written this as:
Amount of b phase in 200 g of the alloy
¼ mass of the alloy fraction of the b phase
¼ 200 g 0.5465 ¼ 109.3 g
Thus, at a temperature just below the eutectic (i.e., at 182
C), the alloy con-
tains 109.3 g of the b phase and 90.7 g of the a phase.
C H A P TE R 1 1 Dispersion Strengthening and Eutectic Phase Diagrams336
(c) Now let’s calculate the masses of lead and tin in the a and b phases:
Mass of Pb in the a phase ¼ mass of the a phase in 200 g
ðconcentration of Pb in aÞ
Mass of Pb in the a phase ¼ð90:7gÞð1 0:190Þ¼73:467 g
Mass of Sn in the a phase ¼ mass of the a phase mass of Pb in the a phase
Mass of Sn in the a phase ¼ð90:7 73:467 gÞ¼17:233 g
Mass of Pb in b phase ¼ mass of the b phase in 200 g ðwt: fraction Pb in bÞ
Mass of Pb in the b phase ¼ð109:3gÞð1 0:975Þ¼2:73 g
Mass of Sn in the b phase ¼ total mass of Sn mass of Sn in the a phase
¼ 123:
8g 17:233 g ¼ 106:57 g
Notice, that we could have obtained the same result by considering the total
lead mass balance as follows:
Total mass of lead in the alloy ¼ mass of lead in the a phase
þ mass of lead in the b phase
76:2g¼ 73:467 g þ mass of lead in the b phase
Mass of lead in the b phase ¼ 76:2 73:467 g ¼ 2:73 g
This is same as what we calculated before. Figure 11-12 summarizes the vari-
ous concentrations and masses.
This analysis confirms that most of the lead in the eutectic alloy gets con-
centrated in the a phase. Most of the tin gets concentrated in the b phase.
Figure 11-12 Summary of calculations (for Example 11-3).
11-4 The Eutectic Phase Diagram 337
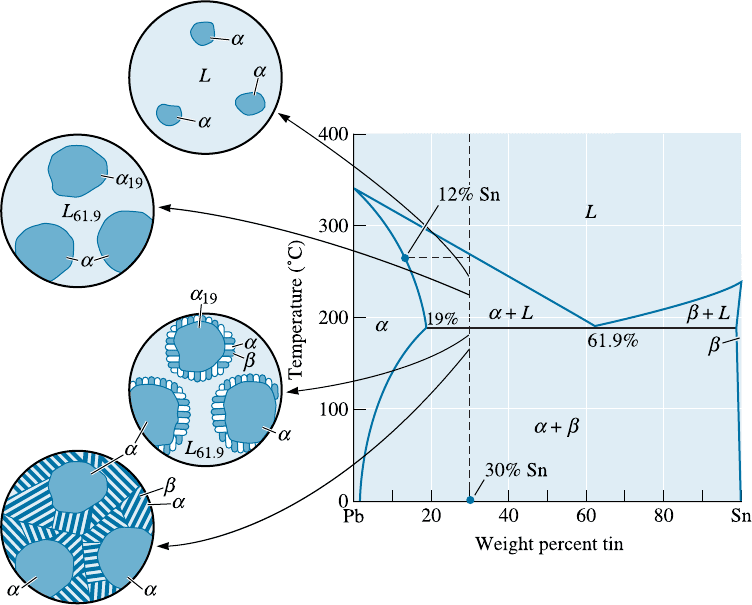
Hypoeutectic and Hypereutectic Alloys A hypoeutectic alloy is an alloy whose com-
position will be between that of the left-hand-side end of the tie line defining the eutectic
reaction and the eutectic composition. As a hypoeutectic alloy containing between 19%
and 61.9% Sn cools, the liquid begins to solidify at the liquidus temperature, producing
solid a. However, solidification is completed only after going through the eutectic re-
action (Figure 11-13). This solidification sequence occurs for compositions in which the
vertical line corresponding to the original composition of the alloy crosses both the liq-
uidus and the eutectic.
An alloy composition between that of the right-hand-side end of the tie line defining
the eutect ic reaction and the eutectic composition is known as a hypereutectic alloy.In
the Pb-Sn system, any composition between 61.9% and 97.5% Sn is hypereutectic.
Let’s consider a hypoeutectic alloy containing Pb-30% Sn and follow the changes
in structure during solidification (Figure 11-13). On reaching the liquid us temperature
of 260
C, solid a containing about 12% Sn nucleates. The solid a grows until the alloy
cools to just above the eutectic temperature. At 184
C, we draw a tie line and find that
the solid a contains 19% Sn and the remaining liquid contains 61.9% Sn. We note that
at 184
C, the liquid contains the eutectic composition! When the alloy is cooled below
183
C, all of the remaining liquid goes through the eutectic reaction and transforms to
a lamellar mixture of a and b. The microstructure shown in Figure 11-14(a) results.
Notice that the eutectic microconstituent surrounds the solid a that formed between the
liquidus and eutectic temperatures. The eutectic microconstituent is continuous and the
primary phase is dispersed between the colonies of the eutectic microconstituent.
Figure 11-13 The solidification and microstructure of a hypoeutectic alloy (Pb-30% Sn).
C H A P TE R 1 1 Dispersion Strengthening and Eutectic Phase Diagrams338
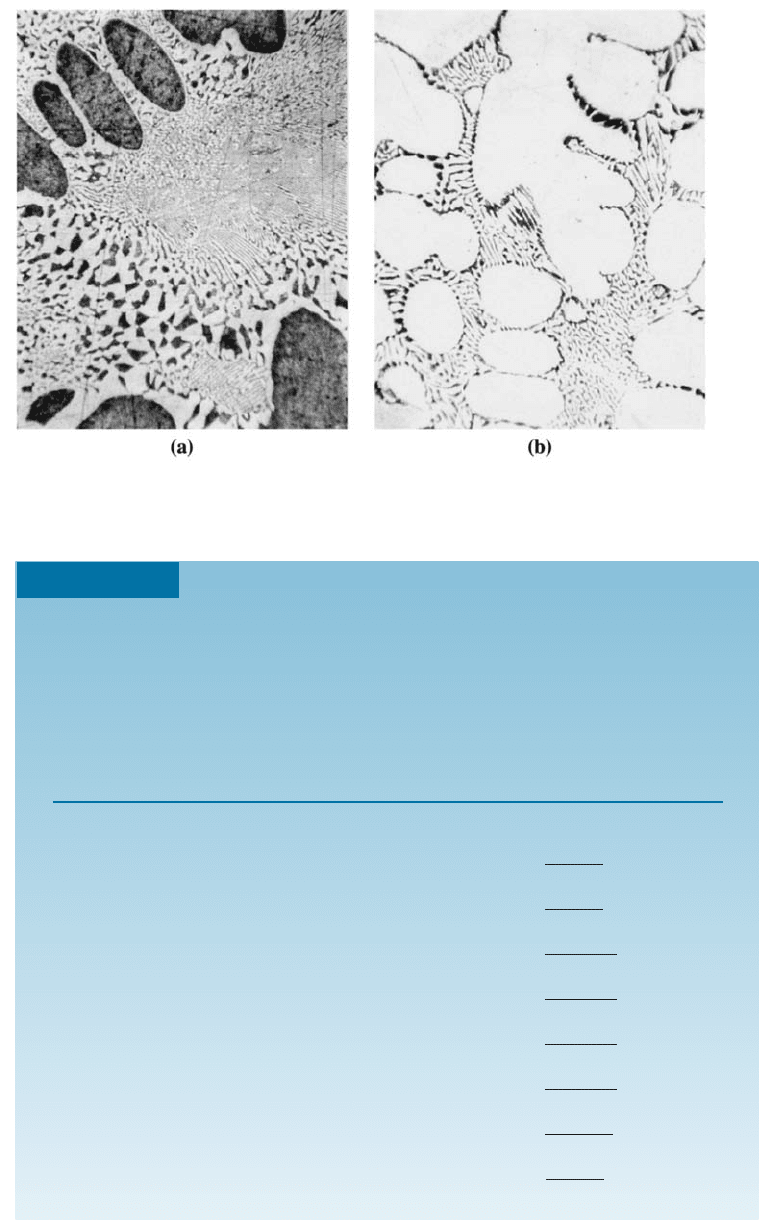
Figure 11-14 (a) A hypoeutectic lead-tin alloy. (b) A hypereutectic lead-tin alloy. The dark
constituent is the lead-rich solid a, the light constituent is the tin-rich solid b, and the fine
plate structure is the eutectic (400).
EXAMPLE 11-4 Determination of Phases and Amounts in a Pb-30% Sn
Hypoeutectic Alloy
For a Pb-30% Sn alloy, determine the phases present, their amounts, and their
compositions at 300
C, 200
C, 184
C, 182
C, and 0
C.
SOLUTION
Temperature
(
˚
C) Phases Compositions Amounts
300 LL: 30% Sn L ¼ 100%
200 a þ LL: 55% Sn L ¼
30 18
55 18
100 ¼ 32%
a: 18% Sn a ¼
55 30
55 18
100 ¼ 68%
184 a þ LL: 61.9% Sn L ¼
30 19
61:9 19
100 ¼ 26%
a: 19% Sn a ¼
61:9 30
61:9 19
100 ¼ 74%
182 a þ ba: 19% Sn a ¼
97:5 30
97:5 19
100 ¼ 86%
b: 97.5% Sn b ¼
30 19
97:5 19
100 ¼ 14%
0 a þ ba:2%Sn a ¼
100 30
100 2
100 ¼ 71%
b: 100% Sn b ¼
30 2
100 2
100 ¼ 29%
11-4 The Eutectic Phase Diagram 339