Barnes D.J., Chu D. Introduction to Modeling for Biosciences
Подождите немного. Документ загружается.

3.3 The Game of Life in Repast S 103
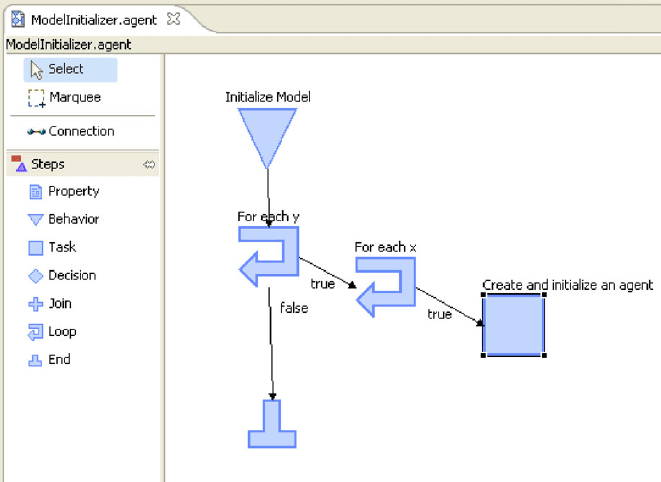
3.3.3 The Model Initializer
In Sect. 3.3.1 we added ModelInitializer as a pseudo-agent in the score file.
When that is done, a ModelInitializer.agent file is automatically added
to the list of source files in the package. This particular agent will be run just
once at the start of the simulation. It allows us to put the model into its initial
state before the scheduled methods take over for the remainder of the model’s run-
ning time. Typically, the initializer is used to create the initial pool of agents and
to ensure that they start in an appropriate initial state. The initializer’s template
flowchart consists of just a behavior symbol and an end symbol with no intermedi-
ate tasks.
For the Game of Life, we want to create one agent per cell of the grid and call
each agent’s initializeState behavior to give it a random alive or dead state.
We start by breaking the connection between the behavior and end symbols in the
initializer’s flowchart, and moving the end symbol to make room for the insertion
of more symbols. We need to loop over the rows and columns of the 20 ×20 grid,
so this requires two loop symbols. For the first select the option i in 1..10 for
step 3 to indicate that we want a loop variable to take on consecutive values. The
code to enter for step 4 is
yin0..19
because in Java the index values of data structures always start at zero and stop at
one less than the number of elements. A second loop symbol is now joined to the
true connection of the first, and the code to enter for its step 4 is
xin0..19
A task symbol is joined to the true connection of the second loop.
There are several things that are typically done when initializing a model.
• A new agent must be created.
• The agent must be added to a context.
• The agent must be positioned in a projection.
• The agent is initialized.
We will do all of these within a single task symbol in the body of second loop.
Select a task symbol and select Create an Agent from the drop-down under step 3.
This gives the following template text in step 5
Object agent = CreateAgent("root", "anl.example.MyAgent")
The first string to CreateAgent is the name of the context to which the agent is
to be added, and the second string is the type name of the agent. Our root context
name is "Life" and the agent type is "life.Agent",giving
Object agent = CreateAgent("Life", "life.Agent")
The call to CreateAgent performs several things at one: it creates a new agent;
it adds it to the root context; and it places it randomly within the grid projection.

104 3 ABMs Using Repast and Java
Notice that we have not had to write code to create either a context or a projection
object. This has been done automatically from the information we provided in the
model.score file.
We could leave the agents at random locations within the grid, but we prefer
to arrange them in the order they were created, for the sake of showing how this
can be done. This is one of the nice effort-saving features of the flowchart inter-
face to Repast. Remaining within this task symbol, we add a second task part in
step 6 to position the agent in the grid projection. Select Edit Using Wizard Di-
alog... from the drop-down list in step 6. The wizard is an alternative to using
drop-down lists or the text box dialog to create task components. We select Move
an Agent in Space because this refers to using projections. The resulting dialog re-
quires three fields to be filled out to specify which agent we wish to move, which
projection it is to be moved within, and where in the projection to place it. We use
the values agent, World, x and y respectively.
7
Selecting Finish in the wizard
results in
MoveAgent("World", agent, x, y)
being entered in the value field of step 6. The final stage is to invoke the initial-
izeState behavior of the new agent. The text box wizard could be used for this
but it is easy enough just to enter
agent.initializeState()
directly in the value field of step 7.
It remains only to connect the false exit of the first loop symbol to the end
symbol of the behavior to complete the initializer (Fig. 3.10). The model is now
complete and ready to run.
3.3.4 Summary of Model Creation
Before moving on, we summarize here the actions we have taken to create the Game
of Life model. We do this now because the preceding steps are all independent of
whether we intend to run the model inside the Repast environment or as an external
application. Obviously, for this particular model a visualization is pretty-well essen-
tial and we have not described yet how to provide one. However, this will not be the
case with every model—it may be sufficient to generate results simply by embed-
ding output statements within the behaviors of the agents, for instance. So the steps
we have taken represent a baseline set of actions for creating a model.
• The initial step was to create a new Repast project area within the Eclipse envi-
ronment.
7
Note that when specifying projection positions, the order of parameters should be x then y then z.
3.3 The Game of Life in Repast S 105
Fig. 3.10 Model initializer for the Game of Life
• We then outlined the structure of the model in the model.score file. This included
the name of the root context, provision for a 20 ×20 grid projection to organize
the agents, and that there would be one type of agent for the cells. We also added
ModelInitializer as a pseudo-agent.
• We next used the visual editor to create flowcharts describing both the Properties
and Behaviors of the Game of Life agents.
• Finally, the model initializer was defined to be responsible for creating all of the
agents at the start of a simulation.
3.3.5 Running the Model
In order to run a model for the first time, it is necessary to get Eclipse to add the
package to its list of runnable configurations. This is done by selecting the Run →
Run Configurations.. . menu item and selecting Run Life Model from the list on the
left. Unless special configuration of the model is required (e.g., additional runtime
memory) the default values presented are likely to be sufficient, and the Run button
at the bottom of the new window can be selected. This setup step is only required
once. Thereafter, the Run button in the main window will execute the current model,
or the Run → Run As menu item can be used to select the required model if it is
different from the default.
106 3 ABMs Using Repast and Java
3.3.6 Creating a Display
Although we have completed the implementation of the Game of Life model, there
will be nothing to see unless we create a display for it. The Repast environment
makes it remarkably easy to create agent displays, and this is one of its major ad-
vantages over building a model completely from scratch. We will start by describing
the basic steps in setting up a display, and then look at some of the customizations
that are necessary to obtain a display that matches the particular requirements of the
Game of Life model.
Running a model opens a new GUI window that contains a panel, the Scenario
Tree. This is an area where runtime-related functionality is defined, such as the
form of any visualization, charting, and model output. A model display is created
by right-clicking over the Displays icon and selecting Add Display. The display can
be named, and either a 2D or 3D display selected. We require a 2D display for the
Game of Life. It is necessary to indicate which of potentially many projections is
to be displayed. As we only have a single projection named World, we select that
name and click on the right-pointing arrow to transfer the name from the left to
the right column. Clicking Next takes us to a dialog where we can indicate which
agents are to appear in the display. The score file is used to supply the list here. We
named two agents but ModelInitializer is really a pseudo-agent and not to
be displayed so we click on its name and select the red minus symbol to delete it
from the list. That leaves just Agent. At this stage, we will do nothing further here,
but note that there is a Style Class listed named DefaultStyle2D. This class is
the one from the Repast API that will be used to provide the visualization of the
Agent objects in the display. As we shall see, this default class is not actually able
to provide the visualization that we want, but it will do for the time being. Selecting
Next takes us to a further dialog window requesting details of how the grid should
appear in the display. The default values are sufficient. Selecting Next takes us to
a dialog for scheduling. Again, the default values are sufficient. Selecting Finish
completes the creation of a display. At this stage it is important to save the Scenario
Tree, otherwise the choices we have just made will be lost. Select either the File →
Save or the disk icon in the GUI window.
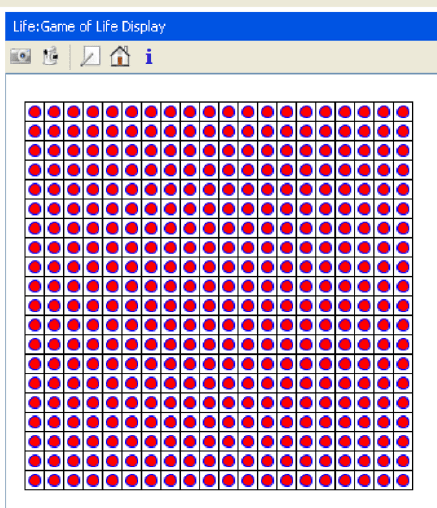
The model is initialized by selecting Run →Init or the on/off icon. A grid should
appear in the rightmost panel. This is the basic display we have just defined but with-
out any agents yet. The display can be moved by selecting it with the right mouse
button and dragging. At the top right corner of the display area is the Tick Count,
currently set to 0.0. Select either the Run → Step menu item or the double-arrow
Step Run icon. Do this twice so that the tick count displays 1.0. The grid should
be filled with pink circles (Fig. 3.11). Each circle is a display of an agent using
the DefaultStyle2D class. If the model is stepped once more the tick count
moves on to 1.5 but the display does not change at all. Further stepping produces
no changes, apart from the incrementation of the tick count by 0.5 each time. These
particular increments are the result of the scheduling settings we chose when defin-
ing the agent’s behavior.
3.3 The Game of Life in Repast S 107
Fig. 3.11 Default display
style for the Game of Life
The reason the display does not change is that the DefaultStyle2D class has
no way of knowing that we wish to display live agents differently from those that
are dead—it displays all agents in the same way. It has no in-built understanding of
what aspects of an agent should inform the display, and how different states should
be represented. If we want a display that reflects the alive/dead state of each agent
then we have to either adapt DefaultStyle2D in some way, or provide our own
style class. We will do the latter, writing a Java class to return style information to
the display. This has the added benefit of allowing us to see how it is possible to
develop a model as a mixture of flowcharts and Java classes.
Close the GUI, either by clicking on the window-close icon, or switching back to
the main Eclipse window, selecting the Console tab near the bottom of the window
and clicking on the small red square that appears among the row of icons along the
tab’s top edge.
3.3.7 Creating an Agent Style Class
In the package explorer, right click over the life folder name beneath Life → src.
Select New → Class and give it the name AgentStyle2D. Replace the default
superclass of java.lang.Object with DefaultStyle2D and then press Ctrl
and Space to invoke the Content Assist tool. This should prefix the full package
name of DefaultStyle2D, which is
108 3 ABMs Using Repast and Java
repast.simphony.visualization.visualization2D.style
Ensure that the Package field is set to life and then click Finish.
Whenever the display needs to represent an agent, it calls the getPaint and
getStroke methods of the agent’s style class. By returning different Paint objects
from getPaint for whether a Game of Life agent is alive or dead, we will be able
to visualize the difference between states.
Right-click over the empty body of the new class and select Source → Over-
ride/Implement Methods. . . from the menu. Tick the boxes against getPaint and
getStroke and select Ok. The stub bodies of the added methods simply call the
implementations from the superclass, which we want to override. Replace the body
of the getStroke method with the statement
return null;
to indicate that we don’t need the agent’s shape to have an outline painted. With a
large number of agents, this can speed up the visualization.
The getPaint method needs a bit more work. Notice that its parameter is of
type Object because this method might be called to display different types of
agent, if the same style class is used for different sorts of agents in a single model.
The first step is to determine whether the parameter is of our Agent class, and then
to determine what its state is. We can then return different colors for the alive and
dead states. This is accomplished as follows
if(object instanceof Agent) {
Agent cell = (Agent) object;
if(cell.getCurrentState() == 1) {
return Color.BLUE; // The agent is alive.
}
else {
return Color.YELLOW; // The agent is dead.
}
}
else {
return null;
}
We are now ready to use this new style class to display our agents. Run the model
to display the GUI window. In the Scenario Tree double click the name of the dis-
play under the Displays area. Within the Options Editor, select Agent Style.TheStyle
Class option should now offer a drop-down list containing the AgentStyle2D
class. Select that, click Ok and then Save the scenario tree. Run the model as be-
fore by selecting the on/off icon or Run → Init. Move the grid with the right mouse
button and then step twice. When the tick count reaches 1.0 a patchwork of blue
and yellow circles should appear in the grid, indicating agents that are either alive
or dead. Stepping through the model one more time will not lead to any change in
the display, except for the tick count incrementing to 1.5. One more step and as the
count moves on to 2.0 the states of the agents will update. What is happening is

3.3 The Game of Life in Repast S 109
that at every 0.5 tick the determineNextState behavior of the agents is be-
ing called, but this does not change the values of their currentState properties,
which are being used to determine the agents’ color. At every second step, the value
of nextState is copied to currentState and the change is reflected in the
display. If the Play icon or Run → Play menu item is selected then the model runs
continuously, reflecting the rules of the Game of Life over and over again. Eventu-
ally, the model should reach some form of equilibrium. The model can be paused at
any time via the Pause icon or Run → Pause menu item.
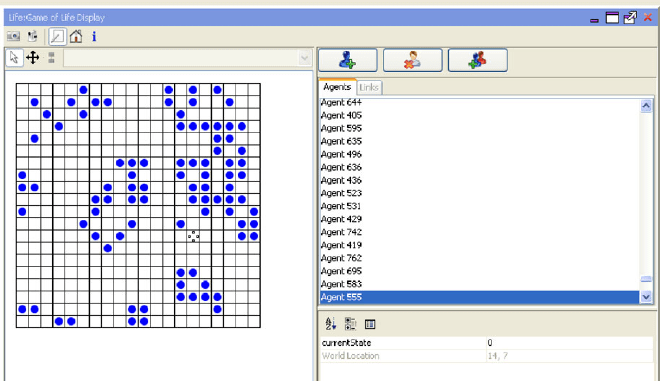
3.3.8 Inspecting Agents at Runtime
Double-clicking on an agent in the visualization brings up an inspection panel that
shows the agent’s location in the grid and the values of any properties with the Ev-
eryone visibility attribute.
8
The row of icons immediately below the display panel’s
title bar offers an Edit Agents option. This brings up a separate panel with a list of
agent identities—corresponding to values in the inspector panel. Double-clicking
on an agent in the grid selects it in the editor and displays the agent’s accessible
properties. To edit a value, close the agent’s display in the inspection panel, change
the value via the editor, and then double-click on the agent in the grid to update it to
its new state. Because of the two-stage process of an agent’s state changing in the
Game of Life, it is only possible to affect the state of the model by editing an agent
at a 0.5 time step, otherwise any edited value of currentState will immediately
be overwritten by nextState on the following time step. Figure 3.12 shows the
Game of Life GUI with agent inspector window open. Notice, too, that we have
changed the getPaint method to display dead agents using Color.WHITE so
that they are indistinguishable from the background, as we are really only interested
in visualizing live agents.
3.3.9 Review
Our implementation of the Game of Life within Repast S is complete. It has pro-
vided a basic introduction to how a relatively simple agent-based model can be
created using the flowcharting tools. It has also demonstrated that a display can be
created fairly easily via the Scenario Tree. In the next section, we will examine how
a more complex model can be created using Java directly, rather than the flowchart-
ing tools.
8
As we noted in the discussion of Properties in Sect. 3.3.2.1, one of the disadvantages of using
Only Me as a visibility is that it prevents this kind of useful inspection, as well as editing of agent
states.
110 3 ABMs Using Repast and Java
Fig. 3.12 The Game of Life GUI and agent inspector
3.4 Malaria Model in Repast Using Java
In this section we are going to develop an implementation in Repast of the Malaria
model described in Sect. 2.4. This time, rather than using flowcharts we will imple-
ment the key actors of the model—mosquitoes and humans—using ordinary Java
classes. The core elements of Repast we will take advantage of are its contexts,
projections, display, charting and output facilities. We will develop this model with
less introductory detail than we used when developing the Game of Life model in
Sect. 3.3.
3.4.1 The Malaria Model
Firstly, we recap the main elements of the malaria model from Sect. 2.4 that are
relevant for this implementation.
• There are two types of agents: humans and mosquitoes.
• Agents live in a continuous rectangular environment of size L ×L.
• Agents can be in either of two states: infected or susceptible.
• If a mosquito is infected then all humans within a radius b of the mosquito will
become infected.
• If a mosquito is susceptible, and there is an infected human within a radius b of
the mosquito, then the mosquito will become infected.
• Once infected, humans remain infected for i
h
time-steps, mosquitoes remain in-
fected for i
m
time steps. The actual numbers chosen will be arbitrary, but should
reflect the fact that the life span of a mosquito is very short compared to the likely
3.4 Malaria Model in Repast Using Java 111
time a human remains infected. Possible values for i
h
and i
m
might be 40 and 2,
respectively, for instance.
• All agents move in their world by making a step no larger than s
h
(humans) or s
m
(mosquitoes) in a random direction.
In addition, we assume that agents do not have a limited lifetime. We will create all
the model’s agents at the start and the numbers remain constant throughout.
3.4.2 The model.score File
We begin by creating a new Repast Simphony project within Eclipse, called
MalariaModel. To the model.score file we add agent members called Human and
Mosquito. The space occupied by these agents will not be a grid but a continuous
two-dimensional space with coordinates that are floating-point values; so we add a
Projection—Continuous Space called World to the model.
An important difference in complexity between the Game of Life and Malaria
examples is the need for parameterization. The only aspect of the Game of Life
we might have wanted to vary was the size of the grid, which we fixed arbitrarily
at 20 when creating the agents and iterating over the grid. In the malaria model
there is a large number of parameters, such as incubation periods and movement
distances. The score file is the place where such parameters should be named and
given values. If we then write the source code to access these parameter values,
rather than embedding constant values directly in the code, it will be a lot easier to
run the model multiple times for different parameter combinations. Therefore, we
define the following Attribute values in the score file, along with associated default
values:
• humanInfectionPeriod, 40, infection period of humans (i
m
);
• humanMaximumMovement, 9, maximum movement radius of humans (s
h
);
• mosquitoInfectionPeriod, 2, infection period of mosquitoes (i
m
);
• mosquitoInfectionRadius, 1, infection radius of mosquitoes (b);
• mosquitoMaximumMovement, 1, maximum movement radius of mosquitoes
(s
m
);
• numHumans, 5000, number of humans;
• numMosquitoes, 10000, number of mosquitoes;
• size, 200, square-side size of the environment (L);
• stopTime, 5000, stop time of the simulation.
We have defined size, numHumans and numMosquitoes as integer values and
the remainder as floating-point, for maximum flexibility. We will discuss how to
access these values from the program in Sect. 3.4.5.
This is sufficient for the time being to allow us to start implementing our model,
although we will come back to the score file at a later time and revise it slightly.

112 3 ABMs Using Repast and Java
3.4.3 Commonalities in the Agent Types
It will often be the case that different types of agents share some characteristics,
either in properties, behavior or both. This is certainly the case with mosquitoes and
humans:
• Both are either infected or healthy (susceptible) at each time step.
• Both have the ability to move, albeit within different ranges.
• Both remain infected for a fixed period, whose length varies according to their
type.
Object-oriented languages make it very easy to take advantage of such similarities
and we can usually avoid duplicating significant amounts of code by placing similar
agents in an inheritance hierarchy.
9
For this reason, we will create an artificial class
called InfectableAgent that captures the common properties and behaviors of
both mosquitoes and humans. The Mosquito and Human classes will then inherit
those common elements and add just their distinctive elements, such as the ability
to infect actively in the case of mosquitoes. Infectable agents are not a third type of
agent in the model but an implementation artifact. In order to make it clear that we
will never want to create an InfectableAgent object in its own right, we designate
this class as being abstract—i.e., incomplete. This is also the reason why we do not
include it in the list of agents in the score file. We will come back to looking at this
class in detail after looking at the model’s context.
3.4.4 Building the Root Context
In the Game of Life example, the score file was used by the model initializer to
create the context and projection required by the agents. However, when we are
not using the visual editor, setting up of the contexts, projections and agents is
usually performed by defining an implementation of the ContextBuilder in-
terface (Code 3.2). ContextBuilder is a generic type, in the same way that
the standard Java ArrayList class is, for instance. Generic types are parameter-
ized on the type of agents they are used with. In our model the type parameter to
ContextBuilder will be InfectableAgent (Code 3.3). The build method
is passed an instance of the Context interface that can be populated and returned,
if desired. However, it is also permissible to create a different context object and
return that instead.
An alternative approach to implementing a context builder as the initialization
point is to define the root context class as a subclass of DefaultContext.One
reason for preferring that approach might be that it is possible for the root context
class to define its own scheduled methods, for instance. However, that sort of facility
9
Inheritance is an important and distinctive feature of OO languages. The reader unfamiliar with
these concepts should consult an introductory text, such as that by Barnes and Kölling [2].