Becker W. Advanced Time-Correlated Single Photon Counting Techniques
Подождите немного. Документ загружается.

254 6 Detectors for Photon Counting
The data sheet of the R5900-L16 specifies a channel crosstalk of only 3%.
There is certainly no reason to doubt this value. However, in a real optical setup it
is almost impossible to reach a crosstalk this small. If crosstalk is an issue, the
solution is to use only each second channel of the R5900-L16. If the PML
16 is
used with only 8 channels, the data of the unused channels should simply remain
unused. If the R5900-L16 is used with an external router, the unused anodes
should be grounded via 50
: resistors.
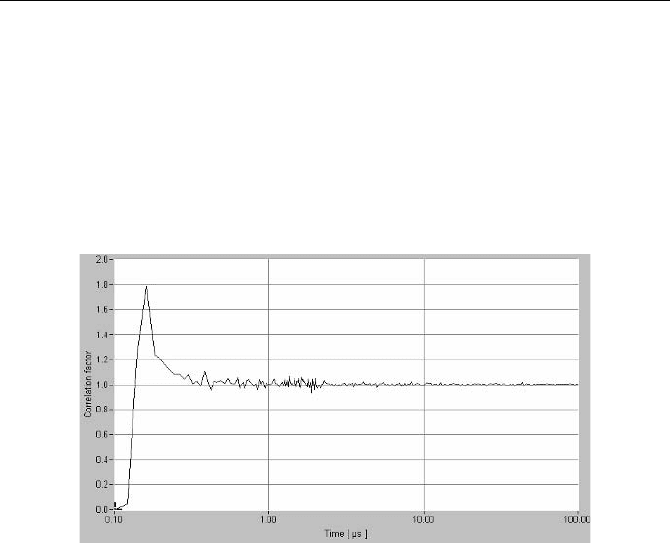
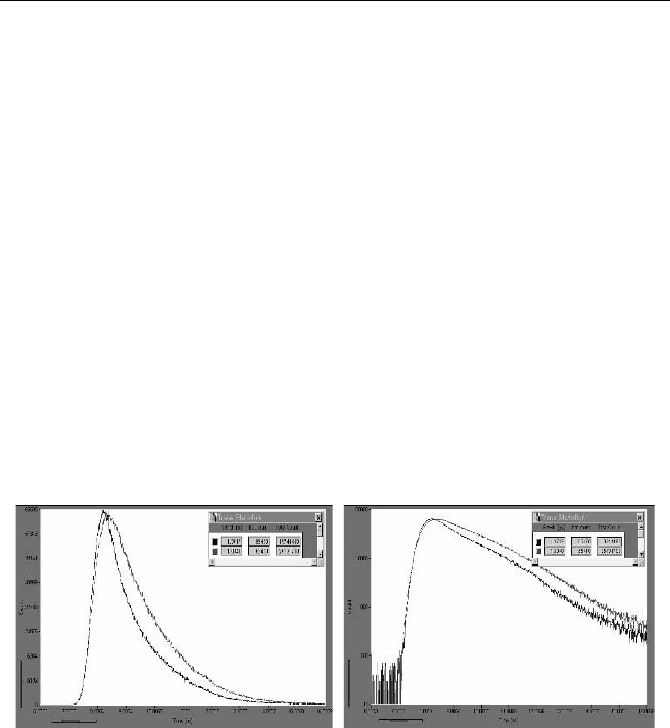
The afterpulsing of the R5900-L16
01 is shown in Fig. 6.47. The afterpulsing
is surprisingly weak and ceases after only 350 ns.
Fig. 6.47 Afterpulsing of an R5900-L1601 (multialkali). Autocorrelation of photon pulses
measured with continuous light at 10 kHz count rate
6.4.7 Linear Focused PMTs
For many years, linear focused PMTs were the fastest single-photon counting
detectors available. Now they have generally been replaced with the faster MCP-
PMTs and with miniature metal-channel-dynode PMTs. Nevertheless, linear fo-
cused PMTs are still manufactured in large quantities and used in combination
with scintillators for high energy particle experiments. The most important fea-
tures of these PMTs are very high gain of 10
7
to 10
8
, high output pulse current,
large size, cathode diameter up to 50 mm, and operating voltages up to 3 kV. The
SER width is 3 to 5 ns, and the transit time spread a few hundred ps. A typical
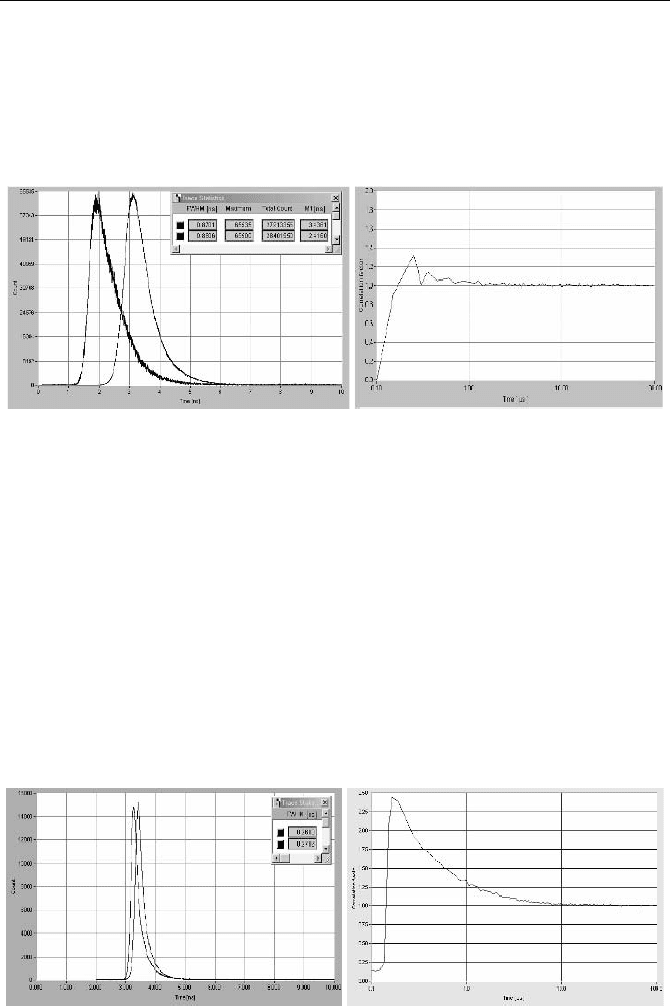
representative of the linear-focused PMTs is the XP2020UR. IRFs measured for
different size of the illuminated cathode area of an XP2020UR and for different
voltage at the focusing electrodes are shown in Fig. 6.48 and Fig. 6.49.
6.4 Photon Counting Performance of Selected Detectors 255
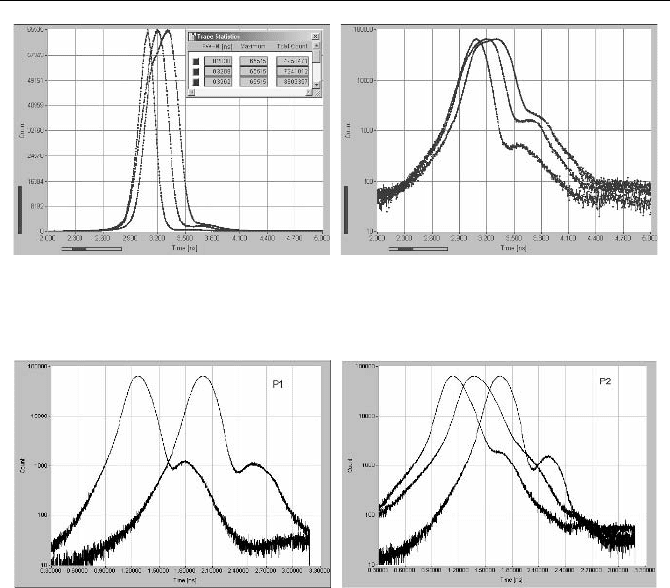
Fig. 6.48 IRF of XP2020UR for different size of illuminated area, left curve to right curve:
1 u 1 mm
2
, 6 u 12 mm
2
, 8 u 16 mm
2
. Linear scale (left) and logarithmic scale (right). Oper-
ating voltage –2.8 kV. Measured with diode laser at 650 nm, pulse width 50 ps
Fig. 6.49 IRF of the XP2020UR for different voltage at the focusing electrodes P1 and P2
The IRF width is 204 ps, 320 ps, and 396 ps for areas of 1 u 1 mm
2
,
6
u 12 mm
2
, 8 u 16 mm
2
, respectively. Changes in the focusing voltages change
the transit time, the shape of the IRF, and the efficiency distribution over the cath-
ode area. The results may vary considerably for different sizes of the illuminated
area and different locations on the cathode.
Different dynode voltage distributions are recommended for high gain and high
pulse output current for the XP2020. The width and shape of the transit time dis-
tribution change with the type of the voltage divider. TCSPC needs neither an
extraordinarily high gain nor a high pulse output current. Instead, the voltage be-
tween the cathode and the first dynode should be as high as possible. Unfortu-
nately it is unknown how much the voltage can be increased without risking
breakdown of the tube. Probably the response can be made shorter than shown in
Fig. 6.48. The best IRF widths reported for the XP2020 and XP2020UR in single
photon counting applications are about 200 ps fwhm [296]. Higher resolution may
be achieved for high-energy particle detection with scintillators. The scintillator
delivers a large number of photons for a single particle. The PMT output pulse is
then the sum of many SER pulses, and has a correspondingly smaller timing jitter.
The total transit time of the XP2020 is about 28 ns. This is long compared to
the 5 to 6 ns of miniature metal-channel PMTs. Although the long transit time is
not directly objectionable, it results in a correspondingly large shift of the
256 6 Detectors for Photon Counting
recorded signal with the operating voltage. Therefore, an extremely stable high-
voltage power supply must be used.
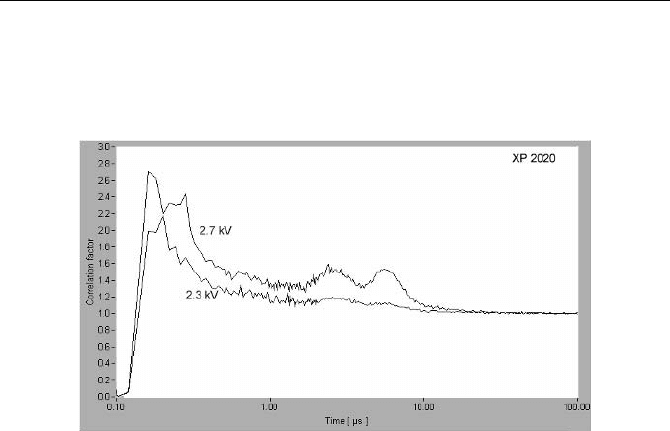
Autocorrelation curves of the afterpulsing are shown in Fig. 6.50. The after-
pulsing is not very strong, but extends over a period of more than 10 µs.
Fig. 6.50 Afterpulsing of an XP 2020 UR (bialkali cathode) for –2.3 kV and –2.7 kV. Auto-
correlation of photon pulses measured with continuous light at 10 kHz count rate
The great dependence of the IRF on the size of the illuminated area, the incon-
veniently high operating voltage, the large size, and the long transit time makes
the XP2020 less attractive for TCSPC than the miniature metal-channel PMTs.
However, the XP2020 and its derivatives may be a good solution if a large cath-
ode area is required.
6.4.8 Side-Window PMTs
Side-window PMTs are rugged and inexpensive, and they often have a somewhat
higher cathode efficiency than front window PMTs. Their broad TTS and long
SER pulses make them less useful for TCSPC applications. However, side-
window PMTs are used in many fluorescence spectrometers, in femtosecond cor-
relators, and in laser scanning microscopes. If instruments like these have to be
upgraded with TCSPC, it can be difficult to replace the detector. Therefore, some
typical instrument response functions for side-window PMTs are given below.
For all side-window PMTs the width and the shape of the TCSPC instrument
response depend on the size and the location of the illuminated spot on the photo-
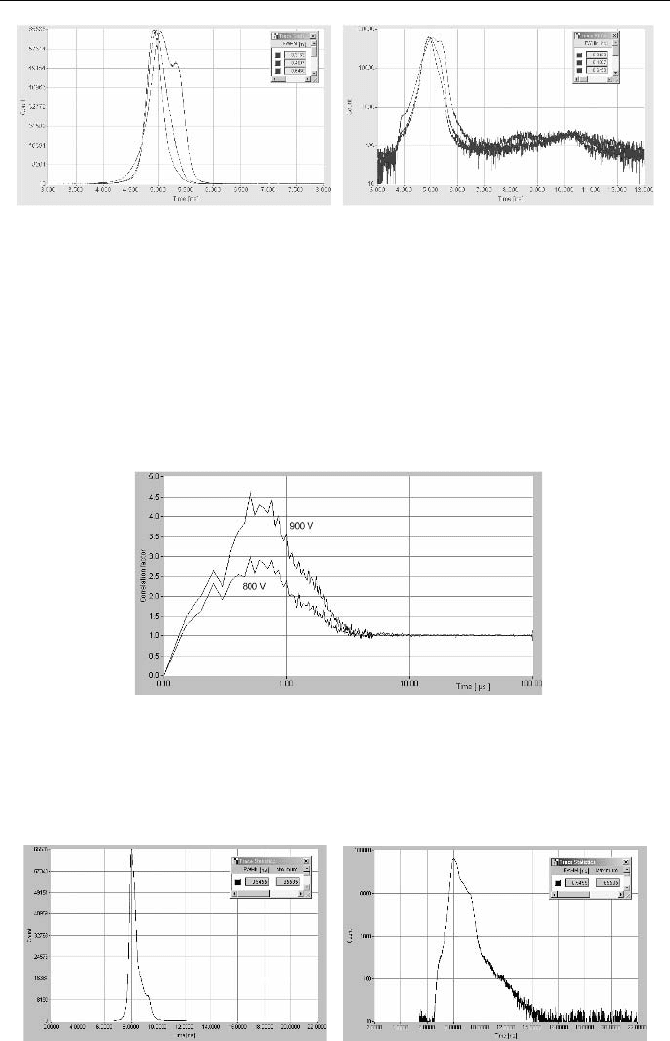
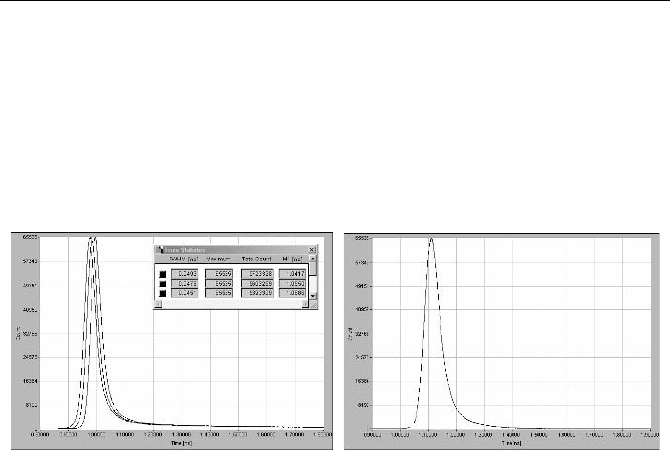
cathode. The response for the R931 - a traditional 28-mm diameter side-window
PMT – for a spot diameter of 3 mm and different locations on the photocathode is
shown in Fig. 6.51. The obtained IRF width is between 315 ps and 650 ps.
6.4 Photon Counting Performance of Selected Detectors 257
Fig. 6.51 R931, TCSPC system response for different spots on the photocathode, spot
diameter 3 mm. Left: linear scale, 500 ps/div, right: logarithmic scale, 1 ns/div
The IRF width can be further reduced by concentrating the light on an ex-
tremely small spot on the photocathode and recording pulses in a narrow ampli-
tude window only [81, 268]. A TCSPC response width down to 112 ps FWHM
has been reported [81], though with considerable loss in counting efficiency.
The afterpulse probability for an R931 is shown in Fig. 6.52. As usual, the af-
terpulse probability depends on the operating voltage. The afterpulses appear
within a time interval of about 3.5 µs.
Fig. 6.52 R931, afterpulsing for –900 V and –800 V operating voltage. Autocorrelation of
photon pulses measured with continuous light at 10 kHz count rate
An IRF of a modern 13-mm side-window tube (Hamamatsu R6350) is shown
in Fig. 6.53. The full photocathode was illuminated. The FWHM is 540 ps.
Fig. 6.53 R6350, TCSPC system response for illumination of full cathode area. Time scale
2 ns/div
258 6 Detectors for Photon Counting
13-mm tubes are commonly used in the scanning heads of laser scanning mi-
croscopes. It is difficult, if not impossible, to replace the side-window PMTs with
faster detectors in these instruments. Therefore sometimes the only option is to use
the tubes for TCSPC lifetime imaging. Although the IRF is sufficient to determine
the lifetimes of typical high quantum yield fluorophores, it is not fast enough to
resolve fast decay components in the multiexponential decay functions of FRET,
fluorescence quenching experiments, and autofluorescence of tissue.
6.4.9 Channel Photomultipliers
Channel photomultipliers use a single macroscopic channel with a conductive
coating, see Fig. 6.3, page 215. A typical representative is the CP 944 of Perkin
Elmer. The CP 944 yields high gain and low dark count rates at a reasonable
cost. Unfortunately the devices have an extremely broad TTS. The TCSPC sys-
tem response to a 650 nm diode laser is shown in Fig. 6.54. The FWHM of the
response is of the order of 1.4 to 1.9 ns. This is insufficient for most TCSPC
applications. However, the high gain and the low dark count rate make the chan-
nel PMTs useful for low-intensity steady state photon counting or multichannel
scaling.
Fig. 6.54 CP 944 channel photomultiplier, TCSPC response. 650 nm, count rate 1.510
5
/s,
high voltage –2.8 kV and –2.9 kV. Full cathode illuminated, time scale 1 ns/div
6.4.10 Single Photon Avalanche Photodiodes
Although single photon operation of standard silicon APDs in simple passive and
active quenching circuits has been reported since 1981 [113, 158, 302] there is
currently no off-the-shelf diode for which single-photon operation is guaranteed.
For a long time the only commercially available single photon avalanche photodi-
odes (SPADs) were the SPCM-AQR modules from Perkin Elmer [408]. The
SPCM-AQR modules have a high efficiency in the near infrared. They are avail-
able in different dark count classes down to 25 counts per second. The output
pulses are positive, with TTL/CMOS levels and a pulse width of several 10 ns.
The pulses can be coupled into the typical CFD inputs of TCSPC devices via an
6.4 Photon Counting Performance of Selected Detectors 259
inverting transformer (see Fig. 7.45, page 307). Due to their high efficiency and
low afterpulsing probability, the SPCM-AQR modules are preferentially used in
FCS and single-molecule experiments. Unfortunately both the timing performance
and the afterpulsing probability seems to vary over a relatively wide range. The
IRF and the autocorrelation function for an unselected SPCM-AQR
14 are shown
in Fig. 6.55.
Fig. 6.55 TCSPC response of an actively quenched single photon APD (SPCM-AQR). Left:
IRF measured at 650 nm, 50 kHz , and 500 kHz count rate, 1 ns/div. Right: Autocorrelation
of the photon pulses measured at a count rate of 10 kHz
The response was measured with a 650 nm ps diode laser. The pulse width of
the laser was about 50 ps, i.e. much shorter than the detector response. The meas-
urements show that not only was the TTS of the tested detector relatively wide,
but also there was a considerable change with the count rate. The afterpulsing of
this SPCM-AQR was weak and restricted to a time interval of less than 300 ns.
Figure 6.56 shows the IRF of a selected SPCM-AQR specified for fast response
and the corresponding autocorrelation function. The IRF of this module was shorter
than 300 ps, and the dependence of the IRF on the count rate was reduced. However,
the afterpulsing was much stronger and extended to almost 10 µs. It is conceivable,
yet not proved, that afterpulsing can be traded off against time resolution by in-
creasing the excess bias, i.e. the voltage above the breakdown level, of the diode.
Fig. 6.56 TCSPC response of and actively quenched single photon APD (SPCM-AQR,
selected for fast timing). Left: IRF measured at 496 nm, 50 kHz , and 500 kHz count rate,
1 ns/div. Right: Autocorrelation of the photon pulses at 50 kHz count rate
260 6 Detectors for Photon Counting
In the last years it became possible to manufacture silicon SPADs in standard
epitaxial processes as they are used for high-speed CMOS devices [117, 245, 246,
354, 424, 459]. The diodes are characterised by a small thickness of the depletion
region. The thin depletion region results in a relatively low breakdown voltage,
high time resolution, and low dark count rate. The drawback of the thin depletion
region is a reduced quantum efficiency in the near infrared. Laser pulses recorded
with an id 100
20 SPAD detector of id Quantique [245] and an SPC144 TCSPC
module of Becker & Hickl are shown in Fig. 6.57.
Fig. 6.57 Diode laser pulses recorded with an id 10020 SPAD at 785 nm and an SPC144
TCSPC module. Left: Wavelength 785 nm, pulse width 24 ps, detector count rates of
61 kHz , 2.7 MHz, and 8.1 MHz. Right: Wavelength 468 nm, laser pulse width 50 ps, de-
tector count rate 1.4 MHz
The curves shown left were measured with a BHL600, 785 nm diode laser of
Becker & Hickl. The FWHM of the diode laser pulses was about 24 ps. The three
curves were recorded at detector count rates of 61 kHz , 2.7 MHz, and 8.1 MHz.
The recorded pulse width (FWHM) is 49 ps, 48 ps and 45 ps, respectively. Cor-
rected for the laser pulse width, the IRF width is 43 ps, 42 ps, and 38 ps. Between
61 kHz and 2.7 MHz, and 61 kHz and 8.1 MHz the IRF shifts by 13 ps and 27 ps,
respectively.
Figure 6.57, right shows the response to a 468 nm diode laser. The pulse width
of the 468 nm laser was about 50 ps; the recorded pulse width 64 ps. The cor-
rected IRF width is about 40 ps.
The shape of the IRF is remarkably clean, without any secondary peaks. There
is, however, a slow tail in the response measured at 785 nm. This „diffusion tail“
is typical for APDs operated at long wavelengths. It is caused by photons which
penetrate the depletion layer and generate photons in the neutral regions nearby.
The tail has negligible amplitude at 468 nm; see Fig. 6.57, right.
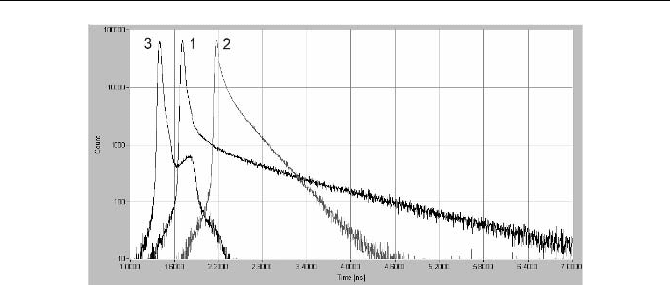
The diffusion tail can be a pitfall in fluorescence decay experiments. Figu-
re 6.58 compares the response of two SPADs (id 100
20 of id Quantique [245]
and PDM 50 CT of Micro Photon Devices [354]) with the response of an R3809U
MCP PMT. The tail in the SPAD response is almost single-exponential and can
easily be mistaken for a fluorescence component, especially if the corresponding
IRF is recorded at a significantly shorter wavelength than the fluorescence.
6.4 Photon Counting Performance of Selected Detectors 261
Fig. 6.58 Response of an id 10020 SPAD (1), an PDM 50CT SPAD (2), and an R3809U
MCP PMT (3). Wavelength 785 nm, optical pulse width 24 ps, time scale 600 ps/div

7 Practice of TCSPC Experiments
7.1 Excitation Sources
The typical excitation sources for TCSPC experiments are listed below.
Table 7.1.
Light Source Wavelength
Range
nm
Pulse Width
ps
Rep. Rate
(typ.)
MHz
Power
(CW )
mW
Cost Maintenance
and Alignment
Effort
Diode Laser 375, 405, 440, 475 50 to 300 0 to 80 0.2 to 2 low none
Diode Laser 635, 650.... 1 300 30 to 300 0 to 80 0.2 to 10 very low none
Ti:Sa Laser 700 to 980 0.2 to 2 78 to 90 200 to 1 300 high low
Ti:Sa, Pulse Picker 700 to 980 0.1 to 1 0 to 9 <100 very high high
Ti:Sa, SHG 350 to 490 0.1 to 1 78 to 90 100 high medium
Ti:Sa, THG 250 to 320 0.1 to 1 78 to 90 20 high medium
Ti:Sa, OPO 1050 to 1 600 0.1 to 1 78 to 90 40 to 240 very high high
+SHG 525 to 660 0.1 to 1 78 to 90 60 to 200 very high high
Dye Laser 400 to 900 10 80 to 125 50 high very high
Nd-YAG Laser 1064, 15 50 to 80 10,000 high low
+ SHG, THG 532, 354, 266 15 50 to 80 100 to 4 000 high medium
Chip Laser 1064, 532, 354, 266 1500 < 0.01 20 to 1 low none
Fibre Laser 800, 1 600 0.2 80 20 medium none
Synchrotron X-Ray to IR >1000 5 < 1 very high very high
Picosecond Diode lasers
Diode lasers are undoubtedly the light sources with the lowest cost. They are ex-
tremely reliable and do not need any maintenance and alignment during normal
operation. Diode lasers are currently available for 375 nm, 405 nm, 440 nm,
473 nm, and a large number of wavelengths above 635 nm. Pulses down to 40 ps
FWHM are available; with selected diodes 25 ps pulse width can be achieved. The
average (CW equivalent) power is a few hundred µW to a few mW at 50 MHz
repetition rate. Higher power is available, yet with some increase in pulse width.
The output power is sufficient to obtain excellent sensitivity in high-efficiency
optical systems. The pulse width is short enough to record fluorescence lifetimes
of less than 10 ps.
Another benefit of TCSPC applications is that the diodes can be operated at al-
most any pulse repetition rate up to more than 100 MHz. Moreover, pulsed diode
264 7 Practice of TCSPC Experiments
lasers can, in principle, be cycled or multiplexed at rates up to 100 kHz . These
features make diode lasers exceptionally suitable for a wide range of spectroscopy
applications.
To obtain best results, some peculiarities of diode lasers should, however, be
taken into regard.
Diode lasers have an extremely small cavity. Most lasers in the power range be-
low 200 mW (CW) are single-mode lasers, i.e. the height and width are so small (a
few µm) that only one transversal mode is excited. This implies that the radiation
can, in principle, be focused into a diffraction-limited spot. However, because the
cavity is only a few µm long, the light is emitted over a wide angle. The general
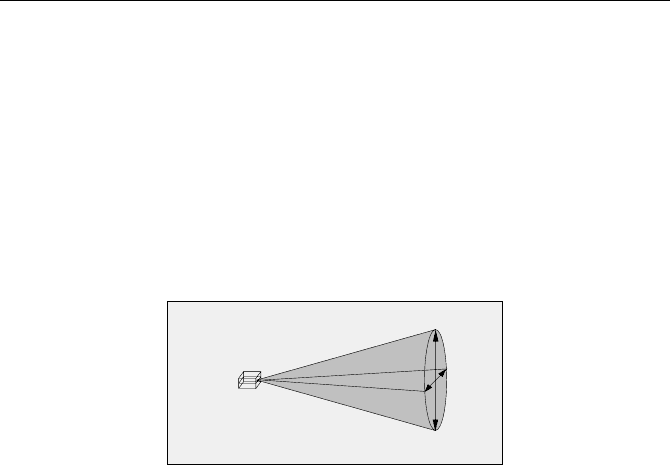
beam profile of a laser diode is shown in Fig. 7.1.
Laser Chip
10°
22°
Fig. 7.1 Beam profile of a laser diode
The diode emits light in a cone of elliptical cross section. The typical beam an-
gle is 8 to 10° horizontally and 20 to 25° vertically. Collimating the light cone
with a simple lens results in an elliptical beam. Moreover, the light cone emitted
by the diode is slightly astigmatic, which results in differing divergences of the
collimated beam in the horizontal and vertical planes. In most TCSPC applications
this does not cause any problems. However, some care is recommended in appli-
cations where a small excitation volume is required. In practice focusing into a
diffraction-limited spot is obtained only by using appropriate beam shaping. The
beam cross section can be made circular by two cylinder lenses or an anamorphic
prism system, and the astigmatism is correctable by a cylinder lens. Beam shaping
is normally required in microscopy applications, or if the light has to be coupled
into a single-mode fibre.
The wavelength of different laser diodes of the same type can vary by several
nanometers. If the diode is used for fluorescence excitation, this is usually not a
problem. However, it should, be taken into account that the wavelength may differ
from the nominal value.
Laser diodes can emit a considerable amount of light at wavelengths different
from the laser wavelength. This feature is most pronounced for blue laser diodes
in the wavelength range of 375 nm to 475 nm. These lasers should always be used
with a bandpass filter. However, some emission at other than the laser wavelength
must be expected also for diodes emitting in the red and in the NIR.
The maximum peak power of the diode laser pulses is of the order of a few
10 mW to about 1 W. Higher peak power results in substantial pulse broadening
or reduced diode lifetime. Therefore, the maximum average (CW equivalent)
power depends almost linearly on the repetition rate. The average power that can