Bergeron B. Bioinformatics Computing
Подождите немного. Документ загружается.


Sequence Visualization
Working with strings that represent nucleotide sequences is like programming in machine code.
Although it's humanly possible to program a computer with strings of 0s and 1s, it's an arduous,
error-prone, time-consuming process that doesn't lend itself to efficiency or easy maintenance and
one that requires extensive program documentation. A step up from machine code is Assembly
language, which allows programmers to use mnemonics such as "CLR" to clear a buffer and "ADD" to
add two values. However, the programmer is still forced to think in terms of low-level CPU
instructions. As a result, the programmer is constantly switching between a high-level problem such
as how to best rotate a molecule in 3D space and a low-level problem, such as whether to use
integer or floating-point math in the rotation algorithm.
Further up the programming hierarchy are languages such as C++, BASIC, and HTML that insulate
programmers from the underlying computational hardware infrastructure and allow them to work at a
level nearer the application purpose. Higher still are the flow diagrams or storyboards—maps of
sorts—that provide a graphic overview of the application that can be understood and critiqued by non-
programmers. Returning to nucleotide sequence work, the parallel to these storyboards are gene
maps—high-level graphic representations of where specific sequences reside on a chromosome.
Sequence Maps
When it comes to visualizing nucleotide sequences, the obvious organizational metaphors are the
amino acids, proteins, chromosome segments, and genes. Just as flow diagrams can be used to
provide content and a high-level description of how the various components of a program are
organized and function, gene maps provide a high-level view of relative and absolute gene and
nucleotide sequence location. The quintessential gene mapping application is NCBI's Web-based Map
Viewer, shown in Figure 5-3.
Figure 5-3. Map Viewer. NCBI's Map Viewer program integrates physical
and genetic map information for specific sequences, proteins, and genes.
This view shows the position of the gene associated with type 2
neurofibromatosis, located on chromosome 22.
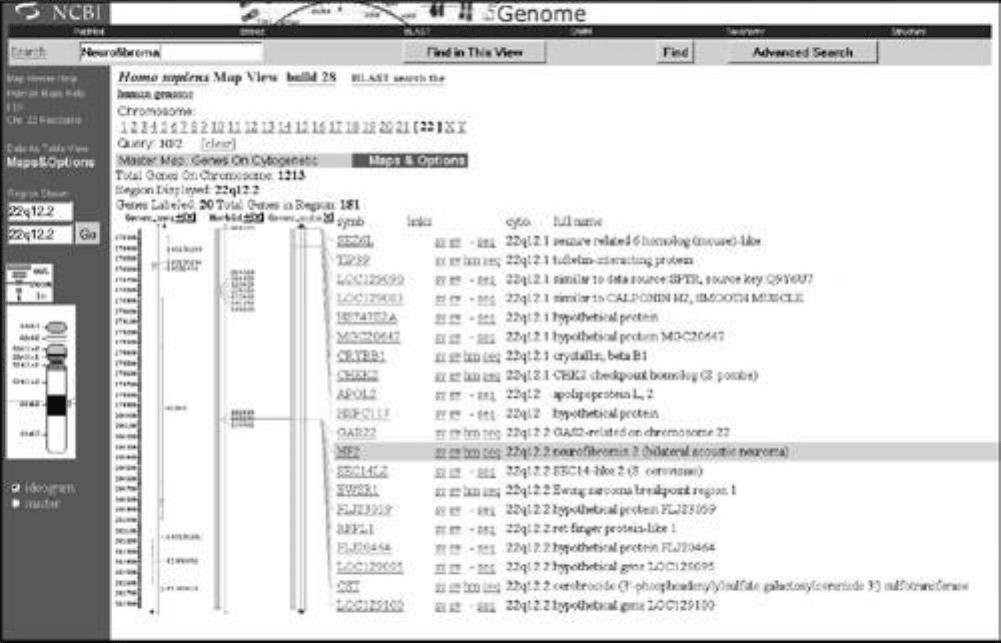
The Web-based Map Viewer program, which is part of NCBI's Entrez integrated system, provides a
composite interface to several of NCBI's online databases. Map Viewer enables users to identify a
particular gene location with an organism's genome, the distance between genes, and the sequence
data for a gene in a particular chromosomal region. Map Viewer illustrates how the main
computational challenge in visualizing linear nucleotide sequences lies in integrating data from
multiple databases. Map Viewer runs inside a Web-browser; all of the graphics processing and
database integration is handled by NCBI.
Unlike working with three-dimensional protein structures, there is relatively little computational
overhead involved in visualizing one-dimensional sequences. Sequences culled from NCBI's
sequential databases are mapped onto the appropriate graphic and relevant links are provided to the
corresponding databases that define the gene sequence and that are related to specific diseases.
Map Viewer provides a graphic depiction of nucleotide sequences through a composite of genetic,
cytogenetic, physical, and radiation hybrid maps, each of which have their particular uses. Genetic
maps show the relative position and order of genes and other sequences on a chromosome, and
serve as high-level approximations of relative distances between sequences. Cytogenic maps provide
a gross indication of the position of exons and entrons along a chromosome, based on optical
microscope techniques. Physical maps show the actual physical location of sequences on a
chromosome. Radiation hybrid maps link genetic and physical maps.
These different representations of a sequence along a chromosome have a variety of applications. For
example, a cytogenic map is probably most appropriate for a researcher interested in quickly
estimating the relative amount of DNA on a chromosome that is involved in coding. A physical map
would be too detailed and difficult to work through, compared to a simple visual inspection of the
relative percentage of exons to entrons across several chromosomes. Conversely, a researcher
interested in the probability that the genes will separate during meiosis would be more interested in a
genetic map, which shows distances between genes and markers (variations at a single genetic locus
due to mutation or other alteration), measured in terms of recombination frequency. The
recombination frequency figure reflects the tendency of genes located close together to be inherited
together, while those that are far apart are more likely to be separated during meiosis. Markers
include single nucleotide polymorphisms (SNPs), which are individual point mutations or substitutions
of a single nucleotide anywhere in the genome.

The resolution provided by a physical map depends on the methodology used to create the map. The
simplest form of physical mapping is cytogenic mapping, which is based on the banding of stained
chromosomes that is visible through light microscopy. Generally more useful in bioinformatics work is
high-resolution sequence-based physical mapping, which defines distances between markers and the
intervening sequence in terms of base pairs. One of the most popular sequence-based physical
mapping techniques uses sequence tagged sites (STSs), which are short, unique DNA sequences. A
common source of STSs are expressed sequence tags (ESTs), which are short sequences derived
from analysis of complementary DNA (cDNA). STSs can also be obtained by sequencing random
pieces of cloned DNA.
Some of the most valuable mapping techniques provide connections between physical and genetic
maps. The most common methods of identifying these connections involve radiation hybrid (RH)
mapping and simple sequence length polymorphisms (SSLPs). Radiation hybrid mapping, which can
be used to reveal the distance between genetic markers, is performed by exposing DNA to measured
doses of radiation, which causes the DNA to break up. By varying the amount of radiation, the
average distance between DNA sequence breaks can be modified. As a result, RH mapping can be
used to localize virtually any genetic marker. Another approach to linking genetic and physical maps
is based on SSLPs, which are arrays of repeat sequences that display length variations. Because
SSLPs can serve as both a genetic marker and as the basis for sequence mapping—a Rosetta Stone
of sorts—the technique is valuable in connecting physical and genetic maps.
The accuracy of the mapping process is highly dependent on computational methods used to
manipulate the data acquired by experimentation or modeling. The typical mapping process,
illustrated in Figure 5-4, involves an integration of several mapping approaches. Using link mapping,
the chromosome is cut into relatively large pieces, and markers are assigned in stages to make a
more detailed map. Cytogenic mapping is used to create a first-pass, a low-resolution chromosome
map that becomes more detailed as more marker data are collected and assigned to positions along
the chromosome.
Figure 5-4. Gene Mapping Processes. A variety of techniques are available
for creating physical and genetic maps.
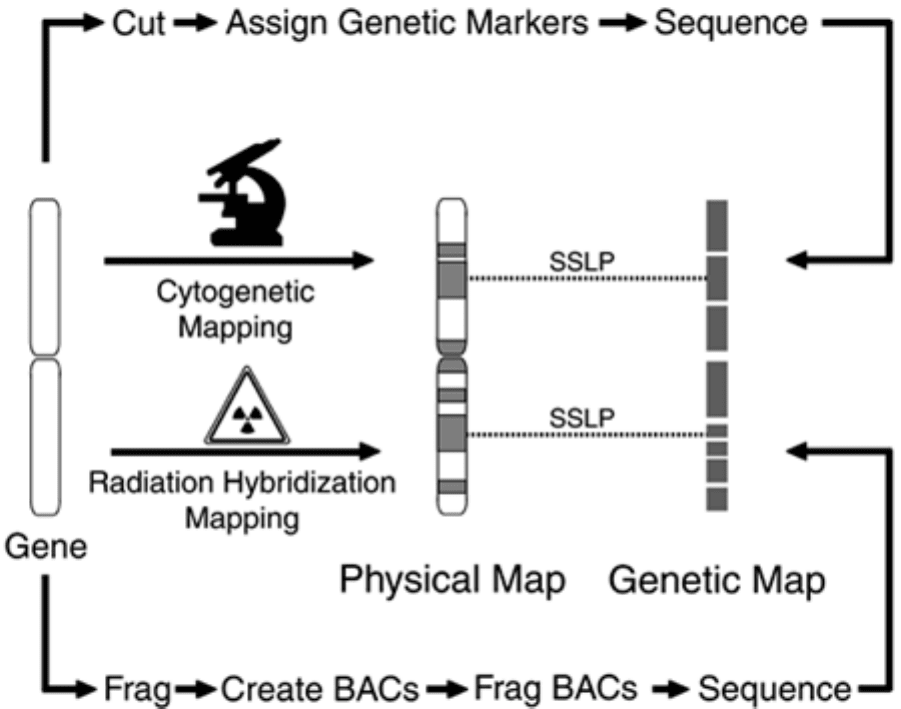
Sequence mapping involves first breaking up the chromosome at random into large fragments, which
are then cloned with bacteria to make a bacterial artificial chromosome (BAC). These BACs are
ordered in such a way as to maximize the contiguous regions while using the minimum number of
BACs. Because BACs are too long to sequence, each one is broken at random into fragments that can
be handled by a sequencing machine—less than around 500 nucleotides—and each fragment is
sequenced. In this way the sequence of each BAC, and eventually of each contiguous region, are
defined. The result is a physical map that may have a few gaps between contiguous regions.

Structure Visualization
One of the primary activities in proteomics R&D is determining and visualizing the 3D structure of
proteins in order to find where drugs might modulate their activity. Other activities include identifying
all of the proteins produced by a given cell or tissue and determining how these proteins interact. The
current methods available for realizing these later activities include time-consuming protein
purification and X-ray crystallography—both activities that take significant time, even with robotic
automation. As such, it's generally understood by the molecular biology research community that the
sequencing of the human genome, which will likely take several more years to complete, is relatively
trivial compared to definitively characterizing the proteome.
Barring the introduction of some new technology, cataloging, interpreting, and dissecting the
proteome will take many years. Unlike a nucleotide sequence, which is a relatively static structure,
proteins are dynamic entities that change their shape and association with other molecules as a
function of temperature, chemical interactions, pH, and other changes in the environment. Grasping
the static structure of the approximately 30,000 proteins of the human proteome is difficult enough
for many researchers, much less their potentially unlimited variation.
In contrast to visualizing the sequence of nucleotides on a strand of DNA, visualizing the primary
structure of a protein adds little to the knowledge of protein function. More interesting and relevant
are the higher-order structures. For example, understanding the docking of two proteins is greatly
facilitated by visualizing the two 3D structures interacting in 3D space. Visualizing a protein's tertiary
structure is valuable in comparing protein structure predictions.
Visualization Tools
The list of technologies in Table 5-1 only hints at the hundreds of available visualization tools that are
either available or under development in bioinformatics. The vast majority of bioinformatics-specific
tools are shareware utilities developed with government funding, supplemented with a few dozen
commercial offerings. Many tools are hardware or process-specific. For example, there are dozens of
graphical interfaces or visualization tools made expressly for microarray devices and the data they
generate. Some of these tools are written in low-level computer languages such as C++, and others
are adaptations of high-level tools, such as the graphical user interface editors that ship with
commercial database engines. In addition to these bioinformatics-centric tools, there are general-
purpose visualization technologies that can be used in bioinformatics applications.
Table 5-1. Visualization Technologies. Visualization tools leverage the
pattern-recognition capabilities of the viewer's visual apparatus as opposed
to the logical, intellectual capabilities that can be more easily saturated.
Visualization Tool Examples
Nucleotide Location Map Viewer
Protein Structure SWISS-PDBViewer, WebMol, RasMol, Protein Explorer, Cn3D, VMD,
MolMol, MidasPlus, Pymol, Chime, Chimera
User Interface Third-Party Browsers, VRML, Java Applets, C++
General-Purpose Software Microsoft Excel, Strata Vision 3D, Max3D, 3D-Studio, Ray Dream
Studio, StatView, SAS/Insight, Minitab, Matlab
General-Purpose Hardware Stereo Goggles, Data gloves, 3D (Stereo) Displays, Haptic Devices
Rendering Tools
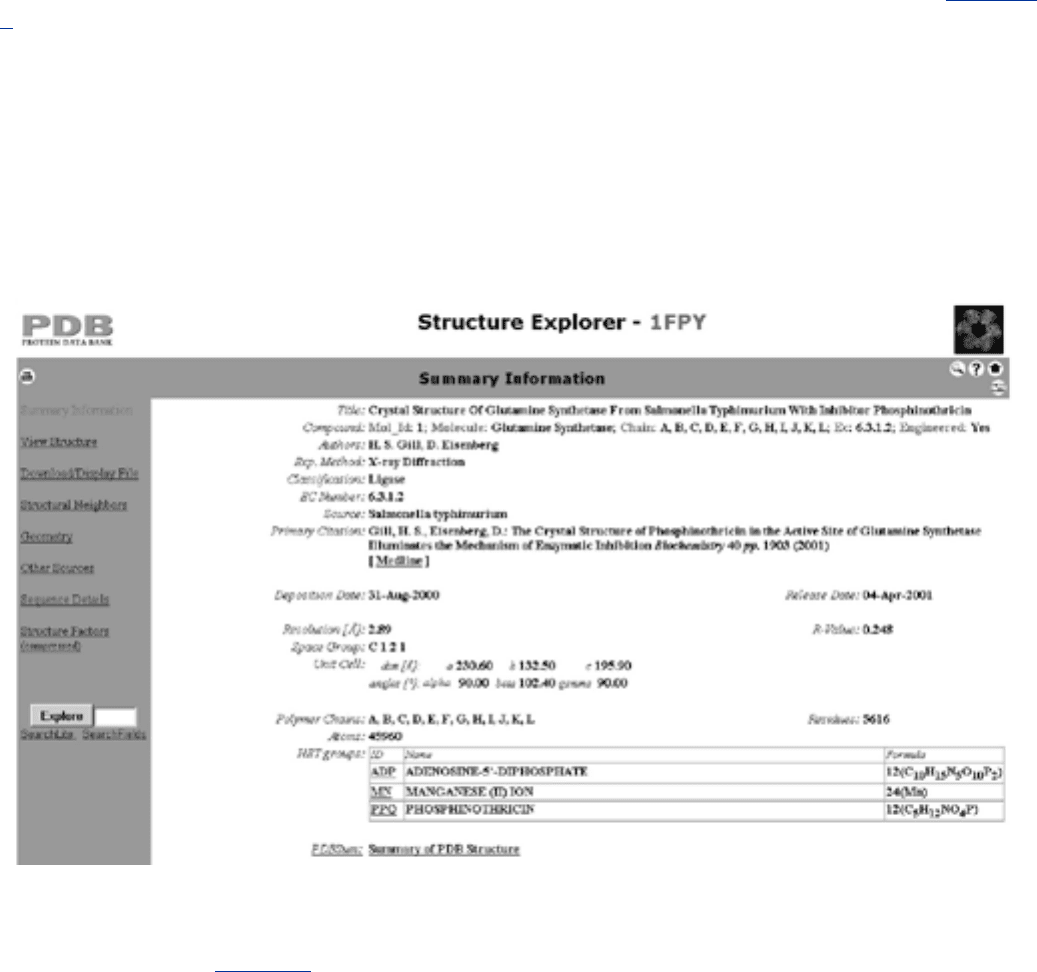
Most of the imaging work in bioinformatics involves data from the Protein Data Bank (PDB) or the
Molecular Modeling Database (MMDB). Searching for a structure is typically through protein name or
ID. For example, data in the PDB is accessible by name or four-letter identifier. As illustrated Figure 5-
5, the identifier for Glutamine Synthetase is 1FPY. Note from the summary information in PDB that
the Glutamine Synthetase molecule is represented by almost 46,000 atoms, which explains in part
why rendering the data is so computationally expensive. The resolution listed for the data—the
RMSD—is 2.89 Angstroms.
Figure 5-5. The Protein Data Bank (PDB). Here, the PDB shows summary
data for Glutamine Synthetase, and the four-letter code for the protein,
1FPY. Note that there are almost 46,000 atoms and over 5,600 residues in
the structure.
Representative protein structure rendering programs available as free downloads from the Internet
include RasMol, Cn3D, PyMol, SWISS-PDBViewer, and Chimera. A summary of the features of these
programs appears in Table 5-2.
Table 5-2. Application Feature Summary. Some of the more popular protein
structure rendering programs are summarized here. All of these programs
are available from the Internet at no cost for non-commercial users.
Feature RasMol Cn3D PyMol
SWISS-
PDBViewer
Chimera
Architecture Stand-alone Plug-in Web-
enabled
Web-enabled Web-enabled

Manipulation
Power
Low High High High High
Hardware
Requirements
Low/Moderate High High Moderate High
Ease of Use High; command-
line language
Moderate Moderate High Moderate;
command-line
language and GUI
Special Features Small size; very
easy to install
and use;
established user
base; highly
portable
Powerful;
GUI
Powerful;
GUI; ray-
tracing
option
Powerful; GUI Powerful; GUI;
built-in
extensions for
collaboration
Output Quality Moderate Very high High High Very high
Documentation Good Good Limited Good Very good
Support Online and users
groups
Online and
users
groups
Online and
users
groups
Online and
users groups
Online and users
groups
Speed High Moderate Moderate Moderate Moderate/Slow
OpenGL Support Yes Yes Yes Yes Yes
Extensibility No No Yes;
supports
Python
No Highly extensible;
supports Python
Operating
Systems
Universal Universal Universal Universal Universal
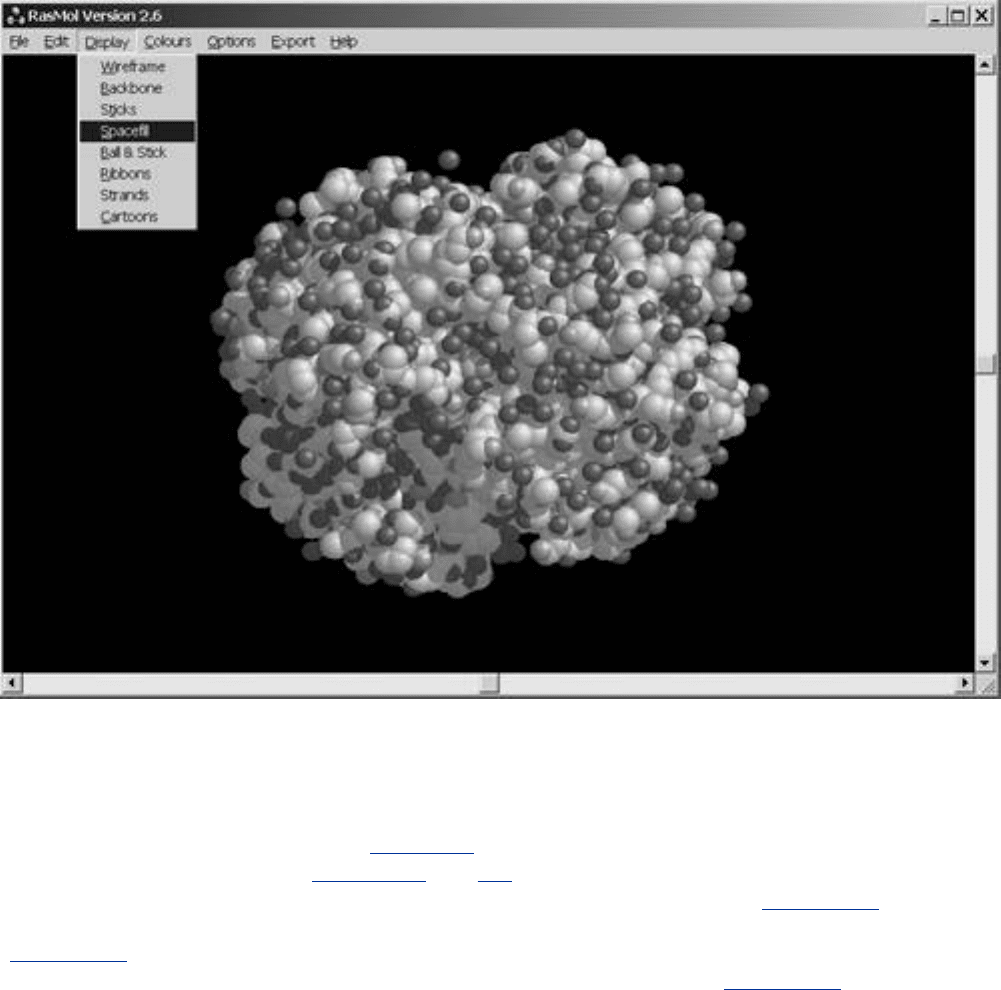
The selection of a protein structure rendering program should be a function of ease of use, power,
speed, special features, cost, hardware requirements, documentation and support, and overall
functionality. For example, rendering 3D protein structures can be extremely computationally
intensive. The more complex the rendering output, the greater the computational load, and the more
time required to render each image. Often, time and performance limitations dictate the use of a
simple, fast rendering package such as RasMol (see Figure 5-6) for day-to-day rendering, and one of
the higher-end packages, such as Chimera, for publication-quality output.
Figure 5-6. Rendering Output from RasMol. RasMol is one of the oldest and
easiest to use molecular rendering programs available for bioinformatics
work. This example shows the basic display options available. The molecule
is Deoxy Hemoglobin.
The minimum functionality of the open-source (source code is available for free or low-cost non-
commercial) rendering programs available on the Web includes the selective viewing and
manipulation of subsets of atoms, wireframe, ball-and-stick, or ribbon renditions of a protein. Each
representation emphasizes different protein properties. For example, the ball-and-stick PyMol
rendering of Glutamine Synthetase in Figure 5-7 emphasizes atoms and bonds. Wireframe views,
such as the PyMol renderings in Figures 5-8 and 5-9, emphasize the molecular bonds. Ribbon
diagrams, such as the Chimera rendering of Glutamine Synthetase shown in Figure 5-10, emphasize
the protein's secondary structure, whereas the Van der Waals surface diagram of Deoxy Hemoglobin
in Figure 5-11 rendered in SWISS-PDBViewer emphasizes the atomic volumes. Another popular
format is the backbone, which shows the overall molecule structure (see Figure 5-12).
Figure 5-7. Ball-and-Stick Display of Glutamine Synthetase Rendered in
PyMol. A close-up of the center of the molecule is shown on the right. The
ball-and-stick format emphasizes atoms and bonds.
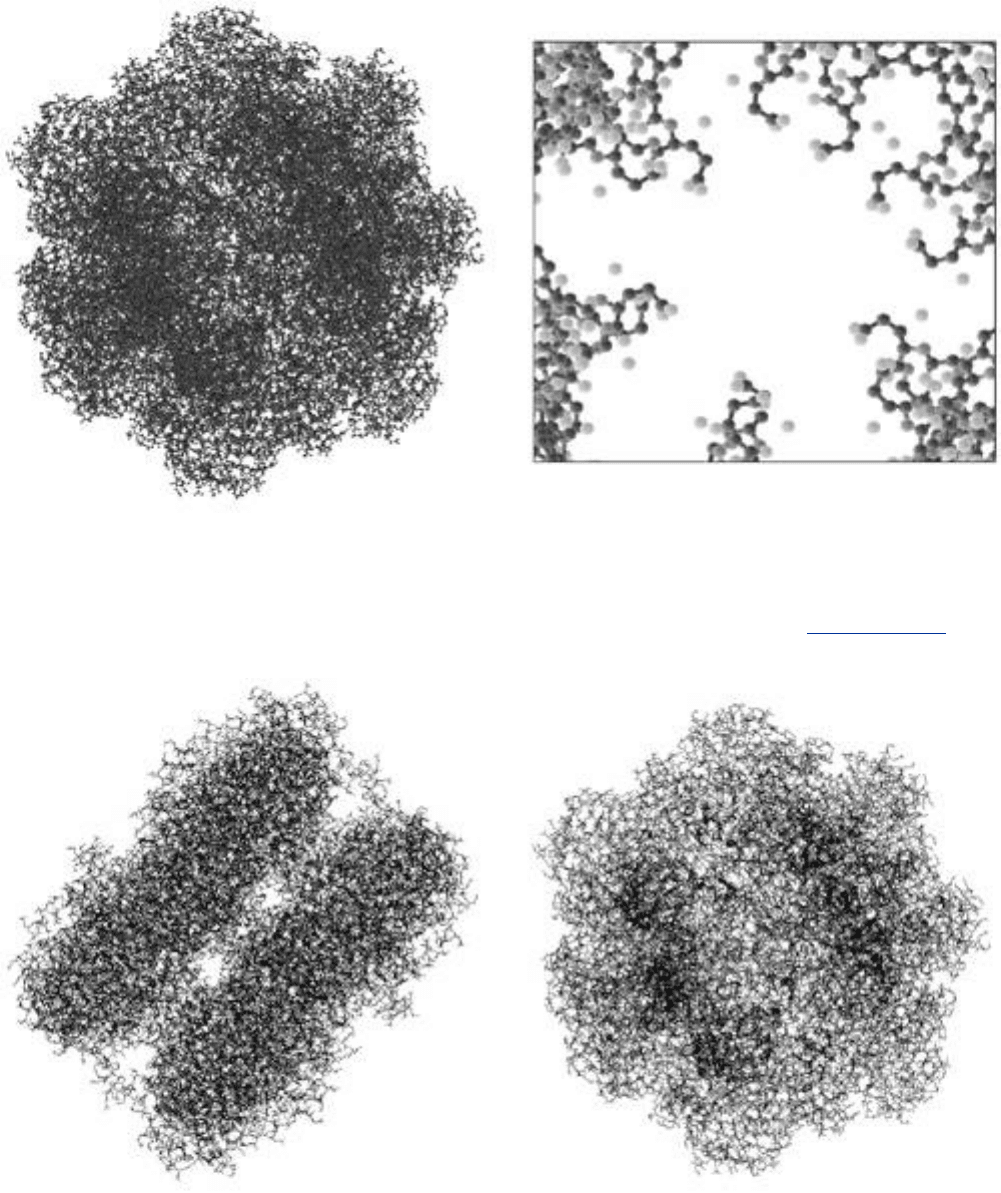
Figure 5-8. Wireframe Diagram of Glutamine Synthetase Rendered in
PyMol. The wireframe view, shown here rendered edge-on (left) and face-
on (right), emphasizes the atomic bonds. Compare with Figure 5-9.
Figure 5-9. Close-Up of a Wireframe Diagram of Glutamine Synthetase
Rendered in PyMol. In this view, bonds are highlighted without being
obstructed by atoms.
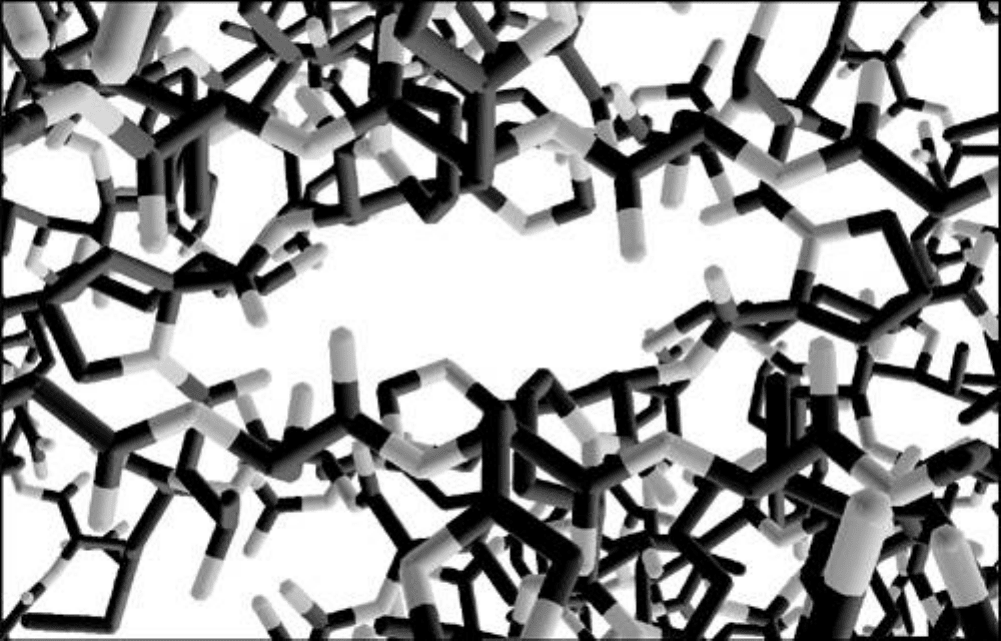
Figure 5-10. Ribbon Diagram of Glutamine Synthetase Rendered in
Chimera. Ribbon diagrams emphasize the protein's secondary structure.