CIMA - C1 Fundamentals of Management Accounting
Подождите немного. Документ загружается.

180
8: Variance analysis ⏐ Part B Standard costing
6 Sales variances
6.1 Sales price variance
The
sales price variance
is a measure of the effect on expected contribution of a different selling price to standard
selling price. It is calculated as the difference between what the sales revenue should have been for the actual quantity
sold, and what it was.
The
sales price variance
is the 'change in revenue caused by the actual selling price differing from that budgeted'.
CIMA
Official Terminology
Suppose that the standard selling price of product X is $15. Actual sales in 20X3 were 2,000 units at $15.30 per unit.
The sales price variance is calculated as follows.
$
Sales revenue from 2,000 units should have been (
×
$15)
30,000
but was
30,600
Sales price variance
600
(F)
The variance is favourable because the price was higher than expected.
6.2 Sales volume contribution variance
The sales volume variance in units is the difference between the actual units sold and the budgeted quantity. This
variance in units can be valued in one of three ways: in terms of standard revenue, standard gross margin or standard
contribution margin.
The sales volume variance in units is calculated as the difference between the actual units sold and the budgeted
quantity. This variance in units can be valued in one of three ways.
(a) At the
standard gross profit margin per unit
. This is the
sales volume profit variance
and it measures the
change in profit (in an absorption costing system) caused by the sales volume differing from budget.
(b) At the
standard contribution per unit
. This is the
sales volume contribution variance
and it measures the
change in profit (in a marginal costing system) caused by the sales volume differing from budget.
(c) At the
standard revenue per unit
. This is the sal
es volume revenue variance
and it measures the change in sales
revenue caused by sales volume differing from that budgeted.
Suppose that a company budgets to sell 8,000 units of product J for $12 per unit. The standard variable cost per unit is $4 and
the standard full cost is $7 per unit. Actual sales were 7,700 units, at $12.50 per unit.
The sales volume variance in units is 300 units adverse (8,000 units budgeted – 7,700 units sold). The variance is
adverse because actual sales volume was less than budgeted. The sales volume variance in units can be evaluated in the
three ways described above.
(a) Sales volume profit variance = 300 units
×
standard gross profit margin per unit
= 300 units
×
$(12 – 7)
= $1,500 (A)
(b) Sales volume contribution variance = 300 units
×
standard contribution per unit
= 300 units
×
$(12 – 4)
= $2,400 (A)
(c) Sales volume revenue variance = 300 units
×
standard revenue per unit
= 300 units
×
$12
= $3,600 (A)
FAST FORWARD
Key term
FA
S
T F
O
RWAR
D
201433 www.ebooks2000.blogspot.com
Part B Standard costing ⏐ 8: Variance analysis
181
Note that the sales volume profit variance (in an absorption costing system) and the sales volume contribution variance
(in a marginal costing system) can be derived from the sales volume revenue variance, if the profit mark-up percentage
and the contribution to sales (C/S) ratio respectively are known.
In our example the profit mark-up percentage is 41.67% ($5/$12) and the C/S ratio is 66.67% ($8/$12).
Therefore the sales volume profit variance and the sales volume contribution variance, derived from the sales volume
revenue variance, are as follows.
Sales volume profit variance = $3,600 (A)
×
41.67% = $1,500 (A), as above
Sales volume contribution variance = $3,600 (A)
×
66.67% = $2,400 (A), as above
Question
Sales variance
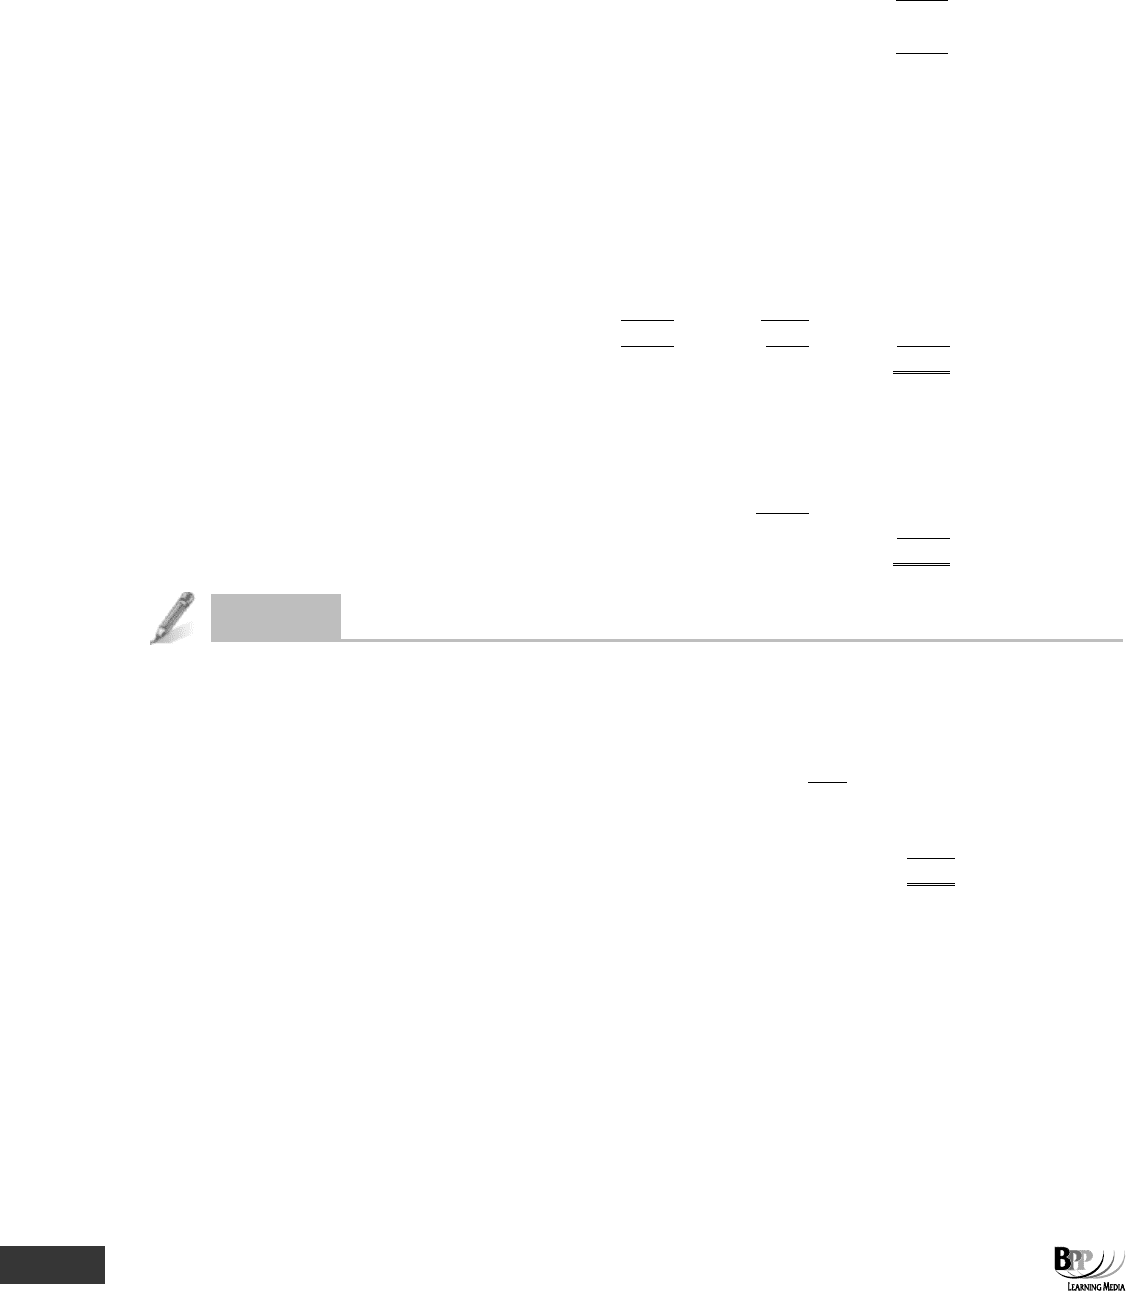
Jasper has the following budget and actual figures for year 4.
Budget Actual
Sales units 600 620
Selling price per unit €30 €29
Standard full cost of production = €28 per unit. Standard variable cost of production = €19 per unit
Calculate the following sales variances
(a) Selling price variance (c) Sales volume contribution variance
(b) Sales volume profit variance (d) Sales volume revenue variance
Answer
(a)
£
Sales revenue for 620 units should have been (
×
£30)
18,600
but was (
×
£29)
17,980
Selling price variance
620
(A)
(b) Budgeted sales volume 600 units
Actual sales volume
620
units
Sales volume variance in units
20
units (F)
Sales volume profit variance = 20 units
×
€(30 – 28) = €40 (F)
(c) Sales volume contribution variance = 20 units
×
€(30 – 19) = €220(F)
(d) Sales volume revenue variance = 20 units
×
€30 = €600(F)
In this question you were asked to calculate both the sales volume profit variance and the sales volume contribution
variance to give you some practice. However, the two variances would never be found together in the same system in a
real situation. Either a marginal costing system is used, in which case the sale volume contribution variance is
calculated, or an absorption costing system is used, in which case a sales volume profit variance is calculated.
You need to read the assessment question carefully to decide whether to value the sales volume variance at gross profit
margin (in an absorption costing system), contribution (in a marginal costing system) or standard revenue. Remember
that the
total
sales variance is the sum of the sales price variance and the sales volume variance.
Assessment
focus point
202433 www.ebooks2000.blogspot.com

182
8: Variance analysis ⏐ Part B Standard costing
7 Operating statements
Operating statements
show how the combination of variances reconcile budgeted contribution and actual contribution.
So far, we have considered how variances are calculated without considering how they combine to reconcile the
difference between budgeted contribution and actual contribution during a period. This reconciliation is usually
presented as a report to senior management at the end of each control period. The report is called an operating
statement or statement of variances.
Let's have a look at an example. This will provide you with the opportunity to revise the variance calculations already
described, and will also show you how to combine them into an operating statement.
7.1 Example: variances and operating statements
Sydney Co manufactures one product, and the entire product is sold as soon as it is produced. There are no opening or
closing inventories and work in progress is negligible. The company operates a standard costing system and analysis of
variances is made every month. The standard cost card for a product is as follows.
STANDARD COST CARD
$
Direct materials 0.5 kilos at $4 per kilo 2.00
Direct wages 2 hours at $8.00 per hour 16.00
Variable overheads 2 hours at $0.30 per hour
0.60
Standard variable cost
18.60
Standard contribution
13.40
Standing selling price
32.00
Budgeted output for the month of June 20X7 was 5,100 units. Actual results for June 20X7 were as follows.
Production of 4,850 units was sold for $150,350.
Materials consumed in production amounted to 2,300 kgs at a total cost of $9,800.
Labour hours paid for amounted to 8,500 hours at a cost of $67,800.
Actual operating hours amounted to 8,000 hours.
Variable overheads amounted to $2,600.
Required
Calculate all variances and prepare an operating statement for the month ended 30 June 20X7.
Solution
(a)
$
2,300 kg of material should cost (
×
$4) 9,200
but did cost
9,800
Material price variance
600
(A)
(b) 4,850 units should use (
×
0.5 kgs)
2,425 kg
but did use
2,300
kg
Material usage variance in kgs 125 kg (F)
×
standard price per kg
× $4
Material usage variance in $
$500
(F)
FA
S
T F
O
RWAR
D
203433 www.ebooks2000.blogspot.com

Part B Standard costing ⏐ 8: Variance analysis
183
(c)
$
8,500 hours of labour should cost (
×
$8)
68,000
but did cost
67,800
Labour rate variance
200
(F)
(d) 4,850 units should take (
×
2 hrs)
9,700 hrs
but did take (active hours)
8,000
hrs
Labour efficiency variance in hours
1,700 hrs (F)
×
standard rate per hour
× $8
Labour efficiency variance in $
$13,600
(F)
(e) Idle time variance 500 hours (A)
×
$8
$4,000
(A)
(f) $
8,000 hours incurring variable o/hd expenditure should cost (
×
$0.30)
2,400
but did cost
2,600
Variable overhead expenditure variance
200
(A)
(g) Variable overhead efficiency variance in hours is the same as the
labour efficiency variance:
1,700 hours (F)
×
$0.30 per hour
$ 510
(F)
(h) $
Revenue from 4,850 units should be (
×
$32)
155,200
but was
150,350
Sales price variance
4,850
(A)
(i)
Budgeted sales volume
5,100 units
Actual sales volume
4,850
units
Sales volume contribution variance in units
250 units (A)
×
standard contribution per unit
×
$13.40
Sales volume contribution variance
$3,350
(A)
Now let’s turn our attention to the operating statement.
There are several ways in which an operating statement can be presented. Perhaps the most common format is one
which
reconciles budgeted contribution to actual contribution.
•
Budgeted contribution
is adjusted by the
sales volume variance
to give the
budgeted contribution from
actual sales
.
•
The
sales price variance
is then included to give a figure representing the
actual sales revenue minus
the standard variable cost of sales
.
•
Cost variances
are then taken into account to produce a figure for
actual contribution.
204433 www.ebooks2000.blogspot.com
184
8: Variance analysis ⏐ Part B Standard costing
SYDNEY CO – OPERATING STATEMENT JUNE 20X7
$
Budgeted contribution
($13.40
×
5,100)
68,340
Sales volume variance
3,350
(A)
Budgeted contribution from actual sales
64,990
Sales price variance
4,850
(A)
Actual sales minus the standard variable cost of sales
60,140
Cost variances
(F)
(A)
$
$
Material price
600
Material usage
500
Labour rate
200
Labour efficiency
13,600
Labour idle time
4,000
Variable overhead expenditure
200
Variable overhead efficiency
510
14,810
4,800
10,010
(F)
Actual contribution
70,150
Check
$
$
Sales
150,350
Materials
9,800
Labour
67,800
Variable overhead
2,600
80,200
Actual contribution
70,150
Question
Operating statement
NN Co manufactures a single product, the SK. The standard variable cost for this item is as follows.
$ $
Direct materials:
P (8 kg at $0.40 per kg)
3.20
Q (4 kg at $0.70 per kg)
2.80
6.00
Direct labour (3 hours at $7.50)
22.50
Variable production overhead (3 hours at $0.50)
1.50
30.00
The standard sales price per unit is $40. The budgeted production and sales for period 7 were 3,000 units.
Actual results for period 7 were as follows.
Sales and production 2,800 units
Sales revenue $113,200
Direct materials purchased and used:
P 19,000 kg Cost $7,500
Q 14,000 kg Cost $10,250
Direct labour 8,600 hours Cost $67,100
It is known that 300 hours of this labour was recorded as idle time.
Variable production overhead $4,100
205433 www.ebooks2000.blogspot.com
Part B Standard costing ⏐ 8: Variance analysis
185
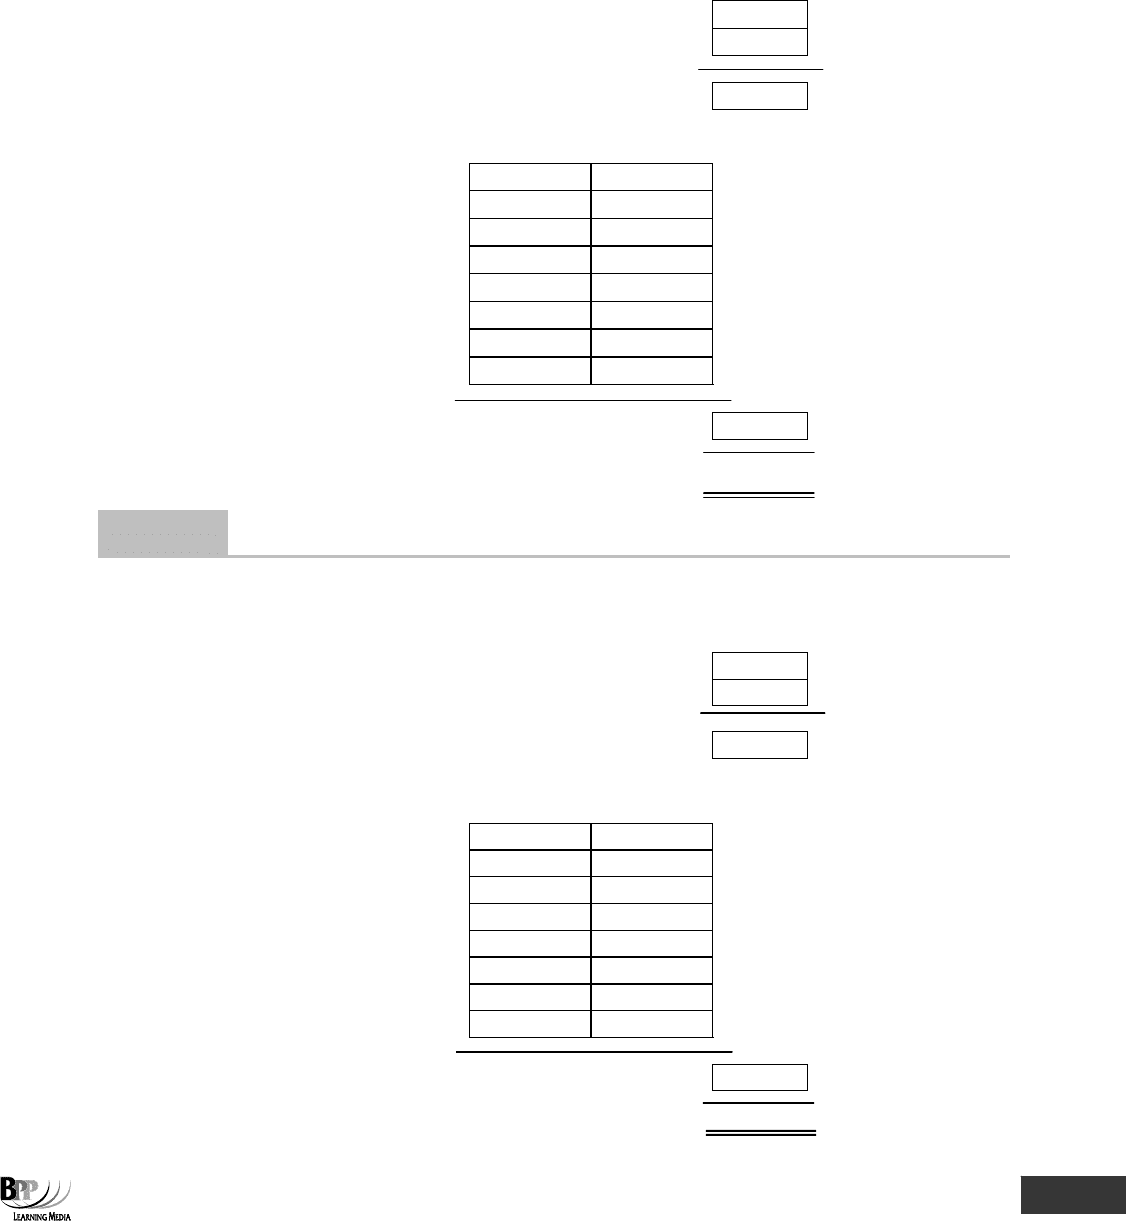
Complete the operating statement for period 7 shown below. You should insert each cost variance into the correct box
according to whether it is adverse or favourable. For the sales variances, indicate in the box whether they are adverse (A)
or favourable (F).
OPERATING STATEMENT FOR PERIOD 7
$
Budgeted contribution 30,000
(a) Sales volume contribution variance
(b) Sales price variance
Actual sales less standard variable cost of sales
$ $
Cost variances
Favourable Adverse
(c) Direct material price
(d) Direct material usage
(e) Direct labour rate
(f) Direct labour efficiency
(g) Idle time
(h) Variable production overhead
expenditure
(i) Variable production overhead efficiency
Total cost variances
Actual contribution 24,250
Answer
OPERATING STATEMENT FOR PERIOD 7
$
Budgeted contribution 30,000
(a) Sales volume contribution variance 2,000 (A)
(b) Sales price variance 1,200 (F)
Actual sales less standard variable cost of sales 29,200
$ $
Cost variances
Favourable Adverse
(c) Direct material price 350
(d) Direct material usage 600
(e) Direct labour rate 2,600
(f) Direct labour efficiency 750
(g) Idle time 2,250
(h) Variable production overhead
expenditure 50
(i) Variable production overhead efficiency 50
Total cost variances 4,950 (A)
Actual contribution 24,250
206433 www.ebooks2000.blogspot.com

186
8: Variance analysis ⏐ Part B Standard costing
Workings
(a)
Sales volume
$
Budgeted sales volume
3,000 units
Actual sales volume
2,800
units
Sales volume variance in units
200 units (A)
×
standard contribution per unit ($(40 – 30))
×
$10
Sales volume variance in $
$2,000
(A)
(b)
Sales price
$
Revenue from 2,800 units should have been (
×
$40)
112,000
but was
113,200
Sales price variance
1,200
(F)
(c)
Material price
$
$
19,000 kg of P should cost (
×
40c)
7,600
did cost
7,500
Material P price variance
100 (F)
14,000 kg of Q should cost (
×
70c)
9,800
did cost
10,250
Material Q price variance
450
(A)
Total material price variance
350
(A)
(d)
Material usage
Material P
2,800 units of SK should use (
×
8 kgs)
22,400 kgs
did use
19,000
kgs
Material P usage variance in kgs
3,400 kgs (F)
×
standard price per kg
×
$0.40
Material P usage variance in $
$1,360
(F)
Material Q
2,800 units of SK should use (
×
4 kgs)
11,200 kgs
did use
14,000
kgs
Material Q usage variance in kgs
2,800 kgs (A)
×
standard price per kg
×
$0.70
Material Q usage variance in $
$1,960
(A)
Total material usage variance ($1,960 – $1,360)
$600
(A)
(e)
Direct labour rate
$
8,600 hours of labour should cost (
×
$7.50)
64,500
did cost
67,100
Direct labour rate variance
2,600
(f)
Direct labour efficiency
To make 2,800 units of SK should take (
×
3 hrs)
8,400 hrs
did take (active hours)
8,300
hrs
Direct labour variance in hrs
100 hrs (F)
×
standard rate per hour
×
$7.50
Direct labour efficiency variance in $
$750
(F)
207433 www.ebooks2000.blogspot.com

Part B Standard costing ⏐ 8: Variance analysis
187
(g)
Idle time variance
300 hours (A)
×
$7.50 =
$2,250
(A)
(h)
Variable production overhead expenditure
$
8,300 worked hours should cost (
×
$0.50)
4,150
did cost
4,100
Variable overhead expenditure variance
50
(F)
(i)
Variable production overhead efficiency
(same as direct labour)
100 hrs (F)
×
standard rate ($0.50)
$50
(F)
Question
Further variance analysis
P Co, a manufacturing firm, operates a standard marginal costing system. It makes a single product, PG, using a single
raw material.
Standard costs relating to PG have been calculated as follows.
Standard cost schedule – PG
Per unit
$
Direct material, 100 kg at $5 per kg 500
Direct labour, 10 hours at $8 per hour 80
Variable production overhead, 10 hours at $2 per hour
20
600
The standard selling price of a PG is $900 and P Co plan to produce and sell 1,020 units a month.
During December 20X0, 1,000 units of PG were produced and sold. Relevant details of this production are as follows.
Direct material
90,000 kgs costing $720,000 were bought and used.
Direct labour
8,200 hours were worked during the month and total wages were $63,000.
Variable production overhead
The actual cost for the month was $25,000.
Inventories of the direct material are valued at the standard price of $5 per kg.
Each PG was sold for $975.
(a) The variable production cost variance for December 20X0 is $
(b) (i) The direct labour rate variance is $
(ii) The direct labour efficiency variance is $
(c) (i) The direct material price variance is $
(ii) The direct material usage variance is $
(d) (i) The variable production overhead expenditure variance is $
(ii) The variable production overhead efficiency variance is $
208433 www.ebooks2000.blogspot.com
188
8: Variance analysis ⏐ Part B Standard costing
(e) (i) The sales volume contribution variance is $
(ii) The sales price variance is $
Answer
(a)
The variable production cost variance is $
208,000 (A)
Workings
This is simply a 'total' variance.
$
1,000 units should have cost (
×
$600)
600,000
but did cost (see working)
808,000
Variable production cost variance
208,000
(A)
(b)
(i)
The direct labour rate variance is $
2,600 (F)
Workings
$
8,200 hours should cost (
×
$8)
65,600
but did cost
63,000
Direct labour rate variance
2,600
(F)
(ii)
The direct labour efficiency variance is $
14,400 (F)
Workings
1,000 units should take (
×
10 hours)
10,000 hrs
but did take
8,200
hrs
Direct labour efficiency variance in hrs
1,800 hrs (F)
×
standard rate per hour
× $8
Direct labour efficiency variance in $
$14,400
(F)
(c) (i)
The direct material price variance is $
270,000 (A)
Workings
$
90,000 kg should cost (
×
$5)
450,000
but did cost
720,000
Direct material price variance
270,000
(A)
(ii)
The direct material usage variance is $
50,000 (F)
Workings
1,000 units should use (
×
100 kg)
100,000 kg
but did use
90,000
kg
Direct material usage variance in kgs
10,000 kg (F)
×
standard cost per kg
× $5
Direct material usage variance in $
$50,000
(F)
209433 www.ebooks2000.blogspot.com
Part B Standard costing ⏐ 8: Variance analysis
189
(d) (i)
The variable production overhead expenditure variance is $
8,600 (A)
Workings
$
8,200 hours incurring o/hd should cost (
×
$2)
16,400
but did cost
25,000
Variable production overhead expenditure variance
8,600
(A)
(ii)
The variable production overhead efficiency variance is $
3,600 (F)
Workings
Efficiency variance in hrs (from (b)(ii)) 1,800 hrs (F)
×
standard rate per hour
× $2
Variable production overhead efficiency variance
$3,600
(F)
(e) (i)
The sales volume contribution variance is $
6,000 (A)
Workings
Budgeted sales volume
1,020 units
Actual sales volume
1,000
units
Sales volume contribution variance in units
20 units (A)
×
standard contribution per unit ($(900 – 600))
×
$300
$6,000
(A)
(ii)
The sales price variance is $
75,000 (F)
Workings
$
Revenue should have been (1,000
×
$900)
900,000
but was (1,000
×
$975)
975,000
75,000
(F)
8 Deriving actual data from standard cost details and variances
Variances
can be
manipulated
so as to derive actual data from standard cost details.
8.1 Example: deriving actual data
The standard marginal cost card for the TR, one of the products made by P Co, is as follows.
$
Direct material 16 kgs
×
$6 per kg
96
Direct labour 6 hours
×
$12 per hour
72
168
P Co reported the following variances in control period 13 in relation to the TR.
Direct material price: $18,840 favourable
Direct material usage: $480 adverse
Direct labour rate: $10,598 adverse
Direct labour efficiency: $8,478 favourable
FA
S
T F
O
RWAR
D
210433 www.ebooks2000.blogspot.com