Daunton M. The Cambridge Urban History of Britain, Volume 3: 1840-1950
Подождите немного. Документ загружается.


workforce. Underemployment remained an important strategy into the interwar
period, particularly in the Midlands coalfields.
66
However, in most of the export
coalfields full redundancy had become the dominant labour market response to
the slump. The coal industry was hit early and long-term unemployment, con-
ventionally defined as continuous unemployment for more than a year, remained
a serious problem in the industry throughout the s. The Pilgrim Trust’s Men
Without Work report suggested that long-term unemployment in was
‘mainly a localized abnormality of coal-mining districts dependent on mines
abandoned or permanently closed’.
67
While other industrial groups also suffered
severe long-term unemployment in the s, miners remained the largest single
occupational group among the long-term unemployed; by , per cent of
coal miners had been unemployed for more than a year.
68
The changing nature of economic distress in the coal industry had important
ramifications for other labour markets. The sheer size of the mining workforce
meant that the flows of labour into and out of the industry were among the most
significant influences on patterns of internal migration.
69
Mining employment
declined significantly from the mid-s with almost half a million men leaving
the industry between and . Employment declined less dramatically in
the late s and s. Miners have had a reputation for geographic and occu-
pational immobility, but the exodus from the declining export coalfields was
substantial. Although there was government encouragement through the indus-
trial transference scheme, most of this migration was voluntary. Migrants tended
to be younger and more economically active than the general coalfield popula-
tions, and their loss significantly altered the age structures of coalfield settle-
ments. Between them the South Wales and Northumberland–Durham coalfields
are estimated to have lost , people between and .
70
Some miners
moved to pits in Nottinghamshire, South Yorkshire and Kent, but there was also
considerable migration into the new industries of Greater London and the
South-East of England. Migrating miners played a major part in industrial and
urban restructuring.
(v)
The largest urban labour market for women was in domestic service. Through
the nineteenth century service became increasingly dominated by women
David Gilbert and Humphrey Southall
66
C. P. Griffin, ‘“Three days down the pit and three days play”: underemployment in the East
Midlands coalfields between the wars’, International Review of Social History, (), –.
67
Pilgrim Trust, Men without Work (Cambridge, ), p. .
68
Ibid., p. .
69
D. Friedlander and R. J. Roshier, ‘A study of internal migration in England and Wales: Part ’,
Population Studies, (), .
70
B. Supple, The History of the British Coal Industry, vol. : –:The Political Economy of Decline
(Oxford, ), p. .
Cambridge Histories Online © Cambridge University Press, 2008

workers. At the beginning of the century there were around eight women ser-
vants for every male servant; by the end of the century the ratio was over twenty
to one. However, the absolute numbers of men in domestic service did not
decline significantly, and men’s privileged position in service was reinforced.
Within residential service butlers were usually paid more than cooks or house-
keepers, and coachmen, grooms and footmen more than even the most experi-
enced of housemaids.
71
Live-in maids and non-residential workers in domestic
service were invariably women, and usually very poorly paid. The gendered
nature of this labour market makes it hard to estimate its size. The closeness
between paid service and those tasks traditionally defined as women’s unpaid
domestic labour meant that this work was often regarded as marginal to conven-
tional waged labour markets. The categories used in the decennial census
changed frequently, and both householders and enumerators often failed to dis-
tinguish between unwaged housework and waged domestic service. A substan-
tial proportion of those recorded by the census as domestic servants in the census
were related to the head of household.
72
There were similar problems distin-
guishing domestic servants from nurses and those employed in laundry work. It
is also likely that part-time work undertaken by married women was substan-
tially underenumerated.
73
None the less it is possible to use census returns to give
some very general indications of the changing size of the market for domestic
servants. There were around . million domestic servants recorded in the
census. This increased to over million in the last three decades of the nine-
teenth century.
74
The numbers employed in domestic service declined slightly
during the Edwardian period, and more rapidly after the First World War.
However, even as late as . million workers were recorded as domestic ser-
vants, of whom . million were women.
The broad categories of the census obscured wide variations in the nature of
jobs and career patterns. The most common popular image of domestic service
has been of the retinues of servants retained in country houses or large town
houses. Employment ‘below stairs’ in a ‘big house’ was marked by fine distinc-
tions between the various jobs but was generally relatively secure, and for some
could mean a lifetime’s work in service. However, most domestic servants worked
outside of these more formal employment structures. The commonest form of
domestic servant was probably the young unmarried ‘maid of all work’ from a
rural or industrial area living and working single-handedly in a middle-class
The urban labour market
71
See P. Horn, ed., The Rise and Fall of the Victorian Servant (Dublin, ), pp. –.
72
E. Higgs, Domestic Servants and Households in Rochdale (New York, ).
73
E. Roberts, Women’s Work, – (Basingstoke, ), p. .
74
Census returns indicate an absolute decline in the number of servants from , but this is likely
to have been an effect of more careful distinctions being made between paid service and unpaid
domestic labour. See E. Higgs, ‘Domestics servants and households in Victorian England’, Soc.
Hist., (), –.
Cambridge Histories Online © Cambridge University Press, 2008

home.
75
This form of domestic service normally ended on marriage and the for-
mation of an independent household. By contrast other forms of domestic
service such as charring and laundry work were usually restricted to older
married or widowed women.
There were various ways of ‘getting a place’ in service. By the middle of the
nineteenth century annual hiring or so-called ‘Mop’ fairs were falling into dis-
repute, and young women and men seeking positions increasingly used informal
networks of neighbours and family or relied upon the help of local clergy and
gentry. Urban tradesmen often acted as unofficial registry offices for servants and
by the end of the nineteenth century advertising for positions in newspapers
became more common.
76
Many young women worked their way through a
series of positions, taking them away from their immediate areas into service in
cities and towns. There were limited opportunities for domestic service in most
parts of the country, even in working-class districts of British cities where poorly
paid part-time cleaning and washing jobs were to be found. At the very bottom
end of the market, Victorian artisans and shopkeepers could employ domestic
servants taken from workhouses or charitable institutions for as little as £ a year,
about a third of the wages paid to the most junior maids in the large households,
or even in some areas without wages in return for board.
77
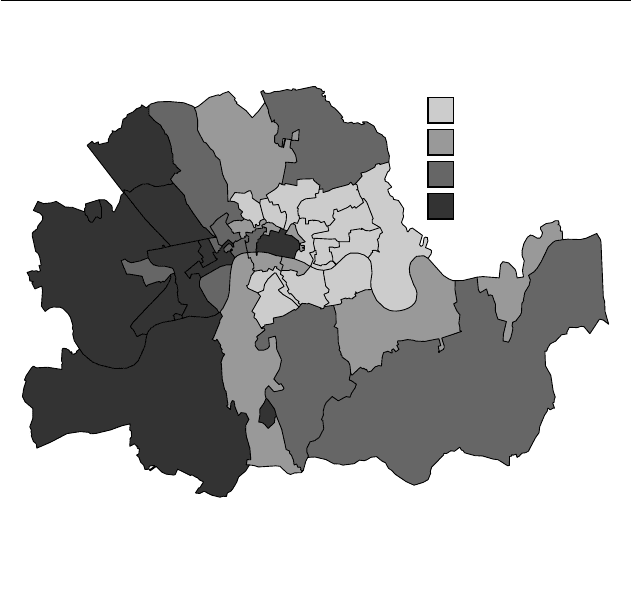
The interactions between domestic service and other labour markets were
important in shaping the urban geography of Britain. Although all major towns
and cities had significant demand for servants, London was by far the most
important single labour market. Within London there was a strikingly polarised
geography of female domestic service, as shown in Map .. The enormous
numbers of female domestic servants in some districts affected the overall gender
balance: in , Kensington Registration District had twice as many women as
men in the age group twenty to twenty-four, and Hampstead three times as
many.
78
Plotting similar information for shows little change, and brings out
the scale of social disparities within London: Hampstead had domestic ser-
vants per thousand households, the highest rate in the country, while Bethnal
Green had thirty-five, the lowest in the country apart from six small Urban
Districts in Lancashire.
79
Domestic service played a significant and underrecognised role in rural– urban
migration, and in-migration between British urban areas. A high proportion of
David Gilbert and Humphrey Southall
75
E. Higgs, ‘Domestic service and household production’, in A.V. John, ed., Unequal Opportunities
(Oxford, ), pp. –.
76
Horn, ed., Rise and Fall, pp. –.
77
F. K. Prochaska, ‘Female philanthropy and domestic service in Victorian England’ Bull. IHR,
(), –.
78
Data from table ‘Ages of males and females’ in the divisional tables in Census of England and Wales
, vol. : Ages, Civil Condition, Occupations, and Birth-Places of the People, PP , parts
and .
79
Data from table (B) ‘Grouped occupations of females aged ten years and upwards’, in Census of
England and Wales , vol. : Occupations and Industries, part , PP , pp. –.
Cambridge Histories Online © Cambridge University Press, 2008
young women entering service came either from agricultural districts or from
areas of heavy industry where women had few employment opportunities.
Women’s entry into domestic service was often a consequence of a lack of alter-
native employment possibilities. In the cotton- and textile-producing districts of
northern England women were likely to choose factory work as an alternative
to domestic service. In these areas domestic service acted as a labour market
which could absorb young women in times of economic distress. Women
factory workers were poorly organised and thus largely excluded from trade
union unemployment relief before the First World War, and payments to women
were restricted under the state insurance schemes. The most familiar story of
migration during the interwar depression concerns the northern unemployed
moving south into the new factories in London and the South-East, but the
established paths into service provided young women entering the labour market
with an alternative southerly escape route from hard times.
Employment prospects for women outside of domestic service were primar-
ily limited by the sex-typing of occupations. A number of factors caused the
long slow decline in employment in domestic service through most of the twen-
tieth century including changes in the nature of middle-class households and
the mechanisation of housework, but the most significant was the growth of
The urban labour market
Under 13.4
13.4 to 19.8
19.8 to 26.6
Over 26.6
Percentage of females
of working age working
as domestic servants:
Map . Domestic servants in London
Source: census (data transcribed and provided by David Allan Gatley).
Cambridge Histories Online © Cambridge University Press, 2008

alternative employment opportunities for young women. At the end of the nine-
teenth century rural depopulation had more or less drained one of the largest
pools of female labour without relatively attractive alternative employment pros-
pects. The First World War pushed many women into jobs traditionally defined
as male, and the number of women employed in domestic service dropped from
. million in to . million in .
80
The backlash against women
workers in many industries which followed the war forced many women back
into domestic service, but the rise of new kinds of ‘women’s work’ on factory
production lines, in consumer industries and in clerical work continued to erode
the supply of servants. These new occupations were concentrated in the parts of
the country where domestic service was most important.
(vi) -
The expansion of white-collar work, particularly during the twentieth century,
made a very direct and obvious mark on the physical landscape of British towns
and cities. Whole central districts were turned over to office buildings and to
servicing the needs of the new legions of office workers. But the expansion of
white-collar work had other influences on the development of the British urban
system. White-collar work, with the security that came from regular salaried
income, produced new possibilities and expectations for millions of households:
it was a major influence on the growth of suburbia, it introduced new working
roles for women and new forms of gender-segregation in urban labour markets
and it led to new forms of career patterns and spatial movement through the
urban system.
To some extent both the growth and the changing gender relations of office
work can be gauged by census records of the number of clerical workers (see
Table .) In fewer than one worker in a hundred was a clerk, and to all
intents and purposes all clerks were men. A hundred years later, one in ten
workers was employed in clerical work, and a clear majority of clerical workers
were women. However, as with many other forms of work, general census cat-
egories obscure social, organisational and technical changes in the nature of
white-collar work . By the mid-twentieth century what the census enumerated
as clerical work was but part of a larger labour market for white-collar workers.
For example, those classified as managers increased from around per cent of
the workforce in the late Victorian economy to . per cent by , yet man-
agerial work had shifted away from supervision of industrial production towards
the administration of people or products.
81
Similarly, the nature and status of
professional work had broadened. Although the elites of medicine, the law
and the higher echelons of the civil service remained relatively closed and
David Gilbert and Humphrey Southall
80
J. Bourke, Working-Class Cultures in Britain – (London, ), p. .
81
M. Savage et al., Property, Bureaucracy and Culture (London, ), pp. –.
Cambridge Histories Online © Cambridge University Press, 2008

self-recruiting, by the interwar period significant numbers were employed in
lower status professions, notably in school teaching and welfare services.
Mid-Victorian clerks were employed in a variety of organisations. The major-
ity of clerks worked in the ‘counting houses’ of commercial and industrial com-
panies.
82
Offices tended to be small: in Benjamin Orchard estimated that
the average size of commercial offices in Liverpool was just four clerks, and many
smaller firms employed a solitary book-keeper.
83
The largest employers were
local and central government, banks, insurance companies and railway compa-
nies, and it was within these corporate organisations that new white-collar roles
and career structures started to develop. By the late nineteenth century commer-
cial firms were also centralising and expanding, and the labour market for white-
collar work was dividing into two distinct sections. For some clerical workers,
the increasing size and scale of businesses and organisations brought the chance
of a career with considerable prospects for upward mobility. However, many
men in lower grades of clerical work faced increasing competition for their jobs
from foreign and women workers.
Organisational career structures developed earliest in the banking industry.
Unlike many commercial firms apprenticeship as a clerk in a bank usually guar-
anteed a secure post and a foot on the career ladder. Most large or medium-sized
banks had a structure of branches, and a good ratio of managers to ordinary cler-
ical workers. This meant both that there were good prospects for upward mobil-
ity through the organisation, and that geographical mobility and career mobility
were closely linked. The career of William Smalley, first a clerk then manager in
the North and South Wales Bank, was not untypical. After joining the bank as
a clerk in he moved between posts in Mold, Liverpool, Holywell and
Oswestry before being appointed manager in Llanidloes in . He then moved
back to the bank’s head office in Liverpool, and on to another manager’s post at
The urban labour market
82
See D. Lockwood, The Blackcoated Worker, nd edn (Oxford, ); G. Anderson, Victorian Clerks
(Manchester, ).
83
B. G. Orchard, The Clerks of Liverpool (Liverpool, ), p. .
Table . Growth and feminisation of clerical work
–
Clerks as percentage Female clerks as
Year of total labour force percentage of all clerks
. .
..
..
..
Source: D. Lockwood, The Blackcoated Worker, nd edn
(Oxford, ), p. .
Cambridge Histories Online © Cambridge University Press, 2008

Rhayader, before finally settling at the Rhyl branch in .
84
During the late
nineteenth and early twentieth centuries amalgamations and takeovers created a
banking industry which was national rather than regional in scale, and which
was increasingly centralised in London, with concomitant consequences for
career paths.
85
Organisational career structures were rather different for managers in manu-
facturing industry. The single firm career was equally important: the Acton
Society Trust’s survey of forty-four of the largest manufacturing compa-
nies in Britain found that per cent of managers had either worked exclusively
in one company, or had joined their present company before the age of twenty-
five.
86
However, this did not imply that managers in manufacturing were as geo-
graphically mobile as their counterparts in financial services. Britain retained
many relatively small family-controlled firms, and larger manufacturing compa-
nies were slow to develop the kind of integrated organisational structures which
were common in the United States. Where large British companies had been
formed through merger, the management structures and practices of the origi-
nal companies were often retained under a small central holding company.
Managers in manufacturing were therefore among the least geographically
mobile of the emerging twentieth-century middle class.
The state’s increasing involvement in health, law and education meant that
organisational career paths became more important for the professions during
the first half of the twentieth century. However, for many professionals career
progression remained one of changing jobs within an occupation rather than
promotion in a single organisation. Professionals were the first major occupa-
tional group to establish career patterns in which occupational advancement
worked through criteria which were not spatially fixed, and where the relation-
ship of the individual to town or region became more or less contingent.
87
The
career paths of many nineteenth-century clerics, lawyers and doctors prefigured
the kind of simultaneous spatial and social mobility associated with the ‘spiral-
ism’ of many mid- and late twentieth-century careers.
88
This is not to say that
the distribution of professionals across the country was either even or random.
Professional networks and formal organisations were usually urban and increas-
ingly based in London. The professions established a pattern of living which pro-
vided a model for the new aspirational middle classes. London and the
South-East was reinforced as the most prestigious region, particular suburbs and
districts of major towns and cities were marked as socially desirable, and the kind
David Gilbert and Humphrey Southall
84
G. L. Anderson, Victorian Clerks (Manchester, ), p. .
85
M. Savage, ‘Career mobility and class formation: British banking workers and the lower middle
classes’, in A. G. Miles and D. Vincent, eds., Building European Society (Manchester, ), p. .
86
Acton Society Trust, Management Succession (London, ), cited in Savage et al., Property,
Bureaucracy and Culture, pp. –.
87
Savage et al., Property, Bureaucracy and Culture, pp. –.
88
W. Watson, ‘Social mobility and social class in industrial societies’, in M. Glucksman and E.
Devons, eds., Closed Systems and Open Minds (Edinburgh, ), pp. –.
Cambridge Histories Online © Cambridge University Press, 2008

of privatised domestic life associated with an un-rooted career became an estab-
lished middle-class norm.
Alongside these developments were other changes in the white-collar labour
market which had quite different implications for social and geographical mobil-
ity. Indeed, it can be argued that the development of the middle-class career
structure, whether organisational or occupational, depended upon the simulta-
neous growth in the number of low-paid and low-status clerical workers, who
were locally based and had very limited career prospects. As early as the s,
English clerks were concerned that they were being undercut by German and
Scottish clerks who ‘swarm to England and France in thousands, accepting duties
at any salary they are offered’.
89
However, the growth of female employment was
a far more lasting and significant change in the white-collar labour market. The
Post Office Savings Bank and the new telegraph services were early employers
of female clerks in the s, followed by larger commercial firms, insurance
firms and the banks. Certain new clerical skills, notably shorthand and typing,
came to be defined as women’s work.
90
The First World War saw a major expan-
sion in the number of women clerks, and unlike in engineering and factory
work, this was a permanent change in the labour market.
In the early expansion of women’s clerical work, women were seen as a direct
challenge to the position of male clerks.
91
However, this effect was concentrated
at the bottom of the clerical labour market, and by the s job opportunities
and career structures for men and women were becoming increasingly
differentiated. In the banks, for example, women were given a special, separate
grade within the organisation, while male clerical work became increasingly
managerial with clear opportunities for promotion and mobility.
92
The lack of
career prospects for women white-collar workers was reinforced by social and in
some occupations legal constraints on work after marriage. In the Civil Service
the marriage bar was removed only as late as , and the ban was actively sup-
ported by many single women workers who saw married women as competition
for their position. This marked gendering of white-collar work had very direct
consequences for the nature of cities. The growth of a relatively privileged male
white-collar salariat was a key influence on the growth of suburbia, particularly
between the wars. A form of domestic life in which male commuting and female
housework became established norms was related to social and cultural expecta-
tions, but also to the very different labour market opportunities for middle-class
married men and women. London was the paramount centre for female clerical
work, and the city saw the development of a new geography of independent
young female households, concentrated in the inner west London suburbs.
The urban labour market
89
C. E. Parsons, Clerks:Their Position and Advancement (London, ), p. .
90
Roberts, Women’s Work, p. .
91
M. Zimmeck, ‘Jobs for the girls: the expansion of clerical work for women –’, in John,
ed., Unequal Opportunities, pp. –.
92
Savage, ‘Career, mobility’, p. .
Cambridge Histories Online © Cambridge University Press, 2008

(vii) :
The central concern of this chapter has been how labour markets shaped the lives
of individual people and, indirectly, the form of individual towns: the casual
workers, confined to particular quarters by their dependence on information
networks for finding work; the artisans with their movements from town to
town and their ‘houses of call’ serving as informal labour markets; domestic ser-
vants, so numerous in some parts of cities as to create otherwise inexplicable
demographic structures; the role of employers in building new communities to
house their workers. This conclusion shifts focus to the urban system as a whole
and explores the complex divisions of labour which characterised both nine-
teenth- and twentieth-century Britain.
Traditionally, regional geographers have argued that the Industrial Revolution
meant an end to the distinctive local cultures of pre-industrial times: people no
longer wore characteristic local clothing but cloth from Lancashire and shoes
from Northamptonshire. Similarly, traditional housing styles using local materi-
als were replaced by standard styles using bricks from Bedfordshire and slates
from North Wales. In , John Langton argued that the Industrial Revolution
had actually increased regional diversity, pointing out that precisely this homo-
genisation of consumption required specialisation in production, in how people
and communities earned their living: Lancashire became the ‘cotton districts’,
Llanberis and Blaenau Ffestiniog almost synonymous with slate.
93
This argument can easily be taken too far: while mining and weaving were
highly localised, artisans tended to be found in every town, and as we have seen
were highly mobile between them; while a town might be unable to change its
specialisation, people could and did make large career changes; and London was
always a vast exception. Map . draws on two census reports, eighty years
apart, which provide comparable occupational statistics for individual towns.
94
The upper pair of maps classify the urban workforce of each county into three
broad categories: those where service sector employment was greater than all in
David Gilbert and Humphrey Southall
93
J. Langton, ‘The Industrial Revolution and the regional geography of England’, Transactions of the
Institute of British Geographers, (), –.
94
Such an analysis, completely excluding rural populations, is possible for relatively few censuses.
The census tabulated occupations by county and selected towns, sometimes using boroughs
and sometimes ad hoc assemblies of parishes, whereas later nineteenth-century censuses used
Registration Districts which combined towns with their hinterlands. was the first census
systematically to gather occupational data and, because it reported them in almost raw form, it is
possible here to assign them to the occupational classification. The census was the first
to report occupations for all individual local government districts, so here the county figures sum-
marise those for all individual County and Municipal Boroughs, Urban Districts, and for Scotland
Cities and Large Burghs. The data for England and Wales consequently include figures for
smaller towns relative to Scotland, and to . Here, and in Maps . and ., the small number
of Scottish towns in the data necessitates merging counties into five broader regions.
Cambridge Histories Online © Cambridge University Press, 2008

manufacturing; those others where the old staple industries employed more than
light manufacturing; and those where light industrial employment exceeded the
staple industries.
95
The lower pair of maps use the same data to measure the degree
of occupational specialisation in each locality: towns with low index values had
a broadly based employment structure, while high values indicate a reliance on
one or two sectors.
96
Urban specialisations in were much as we would expect, showing a clear
polarisation between the manufacturing districts of the North and of South
Wales, and the remainder of the country dominated by the service sector; only
a relatively small area in the South-East Midlands was dominated by light indus-
try.
97
The map differs significantly, revealing a pre-railway and partially pre-
factory occupational geography: most of the heavy industry of the North-East
of England had still to develop, while much of the textile industry was still based
in small towns away from the coalfields, in Wiltshire and North Wales. However,
the domination of the South-East by services was already established.
We tend to assume that towns specialised by product, and hence in terms of
manufacturing, but the lower pair of maps and especially that for partly
reflect specialisation within services. Berkshire was the second most specialised
county based entirely on figures for Reading, half the workforce being
classed as ‘Commercial, financial and insurance’. While Wiltshire’s specialisation
was primarily into textiles, occupying per cent of workers in Trowbridge,
towns in Berkshire and Somerset were again specialised into services: retailing
in Reading, and the various luxury trades of Bath, where per cent of workers
were in domestic service. Cheltenham and Brighton had the same percentage,
while per cent of all workers in Leamington Spa were in domestic service.
Manufacturing specialisations also emerge, such as the Staffordshire Potteries
with per cent of Burslem’s workers, per cent of Stoke’s and per cent of
Hanley’s in the sector: no other town had over per cent. The two towns most
dominated by mining were Aberystruth ( per cent) and Bedwellty ( per
cent), both in Monmouthshire. Lancashire was not among the most specialised
counties because of the diverse economies of Liverpool and Manchester, but
The urban labour market
95
This classification was developed by Eilidh Garrett and Alice Reid of the ESRC Cambridge Group.
Of the thirty-two available categories, categories I and II are grouped as agricultural (defined as
dominant in in three counties where the only data concern a single small town: Dolgellau,
New Radnor and Buckingham); III (mining), V (brick making), VII (most metal workers) and XII
(textiles) as ‘Staple’; VI, VIII, IX, X, XI, XIII through XX, XXIX and XXX as ‘Light’; XXI
through XXVIII as ‘Services’; and XXXI and XXXII as discarded residual categories.
96
The method is taken from R. C. Tress, ‘Unemployment and the diversification of industry’,
Manchester School, (), –; Tress himself was able to compute his index for only a small
number of towns. Our county index values are averages of index values computed for individual
towns, weighted by total numbers employed, so a county consisting of towns with diverse but
extreme specialisms will have a high index value.
97
The growth of services pre- is emphasised by C. H. Lee, ‘Regional growth and structural
change in Victorian Britain’, Ec.HR, nd series, (), –.
Cambridge Histories Online © Cambridge University Press, 2008