Fowler A. Mathematical Geoscience
Подождите немного. Документ загружается.

100 2 Climate Dynamics
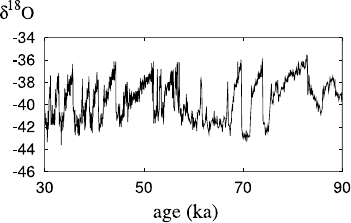
Fig. 2.17 Oxygen isotope ratio (δ
18
O) measurements from the GRIP ice core on Greenland, as a
function of age in ka (1 ka = 1000 years). This is a proxy for surface temperature (with four units
corresponding to about 10 K on the vertical axis). The data represent averages from segments of
55 cm length, and the age scale is determined from a model of ice burial rate. Near the surface,
the separate measurements are two-to-three yearly, but the compression of ice with burial causes
the ice segments to encompass longer and longer time periods. At the age of 90,000 years ago (at
a depth of some 2685 m), each segment is a time average of some 120 years. Thus the data are
increasingly sparsely resolved further into the past
On the other hand, the melting itself releases fresh water, which is buoyant in a
saline ocean, suggesting a shutdown of ocean circulation. As we discuss further be-
low, this can lead, following a delay, to a massive restart of ocean circulation and
thus sudden warming.
2.5.5 Dansgaard–Oeschger Events
There are other rapid changes in the climate which are seen during the last ice age.
Figure 2.17 shows a segment of oxygen isotope measurements (a proxy for surface
temperature) from the GRIP ice core on Greenland. Time marches from right to
left on this diagram. There are numerous sudden rises in temperature that can be
seen, followed by a more gentle sinking of temperature. These sharp rises are called
Dansgaard–Oeschger events. Between 30,000 and 45,000 years B. P., for example
there are seven of these events, thus, like Heinrich events, they occur at reasonably
regular intervals, with a typical repetition period being in the region of about 1,500
years. The association of the D–O events with oceanic salt oscillations is described
by Schmidt et al. (2006), for example.
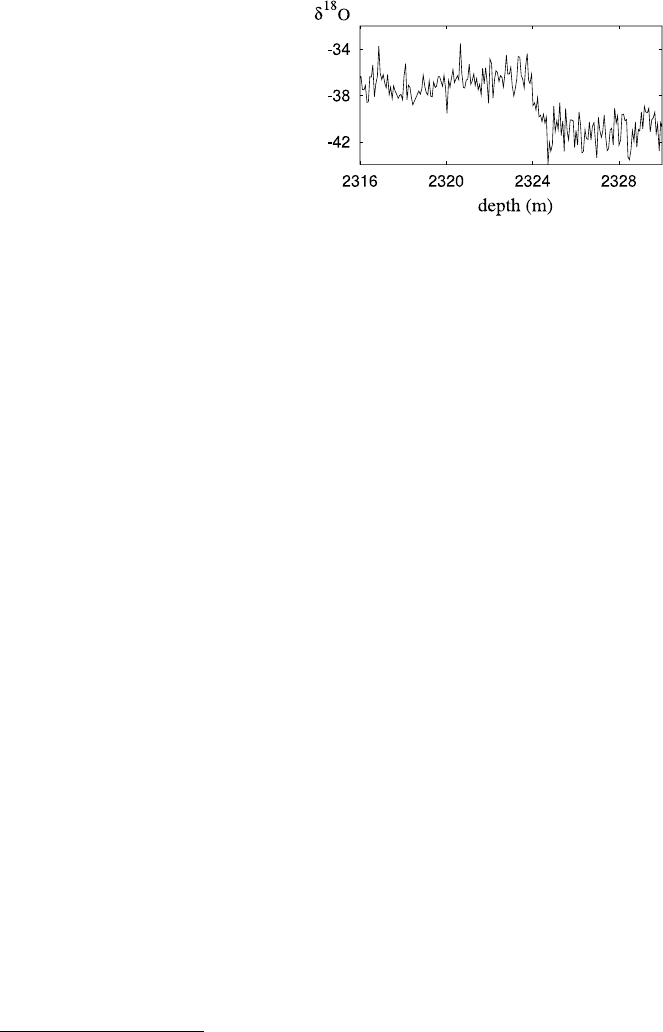
Let us examine one of these events in greater detail: that of the D–O event be-
tween 44,000 and 45,000 years B. P. In the GRIP core, this ice lies between 2,316
and 2,330 metres depth. A higher resolution data set is that of Sigfus Johnsen, and is
shown in Fig. 2.18. This shows that the climatic temperature changes abruptly, over
a time scale of about a century. Other such inspections show that the transitions can
be even shorter.
What is the cause of these warming events? Why are they so rapid, and why do
they have a regular period of some 1,500 years? The idea here is that the climate
2.5 Ice Ages 101
Fig. 2.18 GRIP core data
between 2,316 m and
2,330 m. The sharp jump near
2,324 m occurs over a range
of about 1.3 metres,
corresponding to a time
interval of some 90 years
in the northern hemisphere is essentially controlled by the oceanic conveyor circu-
lation, and so the change in climate occurs because of a sudden disruption to this.
Model studies have shown that an injection of a massive pulse of fresh water into
the North Atlantic can cause just such a disruption.
8
The mechanism is, however, counter-intuitive. A warm climate is associated with
a vigorous circulation, and a cold one with the circulation off, but a freshwater pulse
has the initial effect, being buoyant, of switching the (relatively weak) circulation
off. This causes a climatic cooling. However, the cooling is temporary, because a
situation with no circulation is unstable. When convection begins again, it does so
dramatically, with deep water formation occurring further north (as it does in inter-
glacial times), causing a sudden shift to a warmer climate. The same model studies
have shown that even larger meltwater pulses, such as would occur following the
melting induced by large scale iceberg production, can lead, after the initial cool-
ing of the north Atlantic, to a subsequent extreme warming comparable to that seen
following Heinrich events.
If freshwater pulses are the cause of the sudden climate shifts, what is their
origin? For Heinrich events, the ice rafted debris gives the clue; for Dansgaard–
Oeschger events, there is apparently no such clue. However, it is pertinent to note
that these events are associated with the presence of large ice sheets. If we seek an
explanation by means of freshwater pulses, then the most obvious (and really, the
only) candidate for the source of the pulses is that they come from meltwater from
the ice, and one way in which meltwater drainage is known to occur episodically is
in the large sub-glacial floods known as jökulhlaups. As with surges, these are well
documented from beneath glaciers. It has been less common to imagine that they
could occur from beneath modern day ice sheets, but in fact such floods are being
increasingly observed to happen below the Antarctic Ice Sheet. As a hypothesis it
seems sensible to suggest that Dansgaard–Oeschger events might arise as a conse-
quence of semi-regular Laurentide jökulhlaups which occur with a rough periodicity
of one to two thousand years. The question then arises as to whether such floods are
dynamically possible, and whether they could produce the necessary fresh water at
the required frequency to do the job. We shall re-examine this question in Chap. 11.
8
This is not the only possible mechanism. Another is the North Atlantic salt oscillator, discussed
in Sect. 2.5.7.
102 2 Climate Dynamics
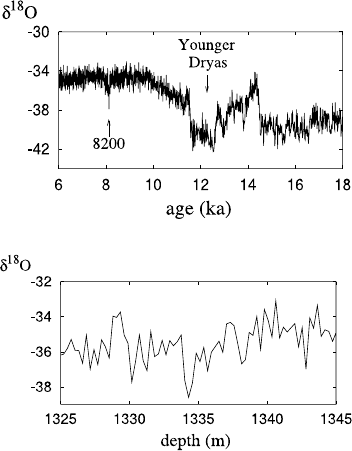
Fig. 2.19 Oxygen isotope
data from the GRIP core at
the transition to the Holocene
interglacial
Fig. 2.20 High resolution
data set from 20 metres of ice
near the 8,200 year event
2.5.6 The 8,200 Year Cooling Event
One climatic event which is thought to have been caused by a sub-glacial flood
is a sudden cooling event dated to 8,200 years B. P. This is shown in context in
Fig. 2.19. which also shows the termination of the ice age after the Younger Dryas
readvance of the ice sheets between 13,000 and 11,600 years B. P. Two Heinrich
events precede the two warmings at about 15,000 and 12,000 years B. P. Following
the Younger Dryas, there is a gradual return to an interglacial climate by 9,500 years
B. P., and the onset of the current (Holocene) period. A cursory glance might suggest
that the 8,200 year dip is just a noisy outlier, but this is not the case. It represents a
genuine climatic cooling of some 4 K.
Figure 2.19 shows a high resolution record of this event. Inspection of the coarse
(55 cm samples) GRIP data shows that the 8,200 year event is actually (on the age
scale used) at 8,126 years B. P., and occurs in a single 55 cm segment at a depth of
1334 metres; blink, and you miss it. At this depth, six metres of ice (1,331–1,337) is
considered to represent 65 years of accumulation. Plotting the data using Johnsen’s
higher resolution data set over a more restricted range, we can see (Fig. 2.20) various
features.
One is that the event occupies three data points from an ice depth between 1,334
and 1,335 metres depth. These three samples are 27.5 cm long, as are the two im-
mediately above and below. This suggests that the ‘duration’ of the event is between
82 and 137 cm, which corresponds to a period of between 9 and 15 years. This is
incredibly fast.
The other thing to notice from Fig. 2.20 is that there are a good number of other
large spikes and oscillations. Since, more or less, each data point represents a three
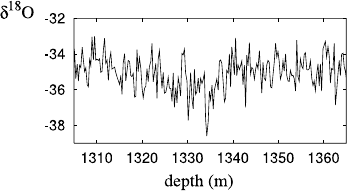
2.5 Ice Ages 103
Fig. 2.21 The cooling trend
of the 8,200 year event
year average, these are not seasonal fluctuations. Do they represent real events, or
simply the natural fluctuation of the climate from year to year? If one looks at a
slightly larger slice of the time series, from 1305 m to 1365 m, it is apparent (see
Fig. 2.21) that these short term fluctuations sit on top of a broader cooling trend from
about 1340 to 1315 m, with rapid decrease in the first 5 m (∼54 years), and slower
recovery over the following 20 m (∼217 years). It is perhaps easier to imagine that
this slower average trend represents the underlying event.
The explanation which is currently thought to apply to this event is that it is
caused by a sub-glacial jökulhlaup which drains the massive proglacial Lake Agas-
siz into the Hudson Strait, whence it pours into the Labrador Sea and the North
Atlantic. As the remnant of the Laurentide ice sheet dwindles, it builds up a massive
proglacial lake on its southern margin. The topography is such that this lake is pre-
vented from outflow to the south, and at some point it drains catastrophically, either
over or more probably under the ice sheet to the north. The resulting fresh water
efflux to the North Atlantic causes the cooling event.
One might wonder, if glacial meltwater pulses cause convective shutdown, cool-
ing, and then subsequent warming, why would an interglacial one produce only the
cooling? The putative answer to this lies in our idea of what a meltwater pulse will
actually do. In an interglacial climate, the ocean circulation is strong, and meltwater
weakens it temporarily: a cooling. In a glacial climate, the circulation is weaker,
and deep water formation occurs further south, say near Iceland, than it does cur-
rently. Then a meltwater pulse may shut down the circulation entirely, which would
indeed cause further cooling, but the resultant overshoot when circulation resumes
causes the warming. Since Dansgaard–Oeschger events occur at the end of cooling
cycles, the initial cooling is swamped by the trend. It is interesting to note that the
D–O warming events in Fig. 2.19 are initiated at 14,500 B. P. and 11,600 B. P., the
interval between these being 2,900 years. The interval between the Younger Dryas
and the 8,200 event is about 3,500 years. If the D–O events are due to sub-glacial
floods, then possibly the 8,200 event is simply the last of these. It is then tempting
to look further on for similar, smaller events. There is one at 5,930 B. P., for exam-
ple, and another at 5,770 B. P.; these are about another 2,400 years further on. It is
a natural consequence of the hypothesis that jökulhlaups occurred from below the
Laurentide ice sheet to suppose that they will occur also from beneath Greenland
and Antarctica, and that this may continue to the present day. It has been suggested,
for instance, that the cool period in Europe between 1550 A. D. and 1900 was due
to a similar upset of the oceanic circulation.
104 2 Climate Dynamics
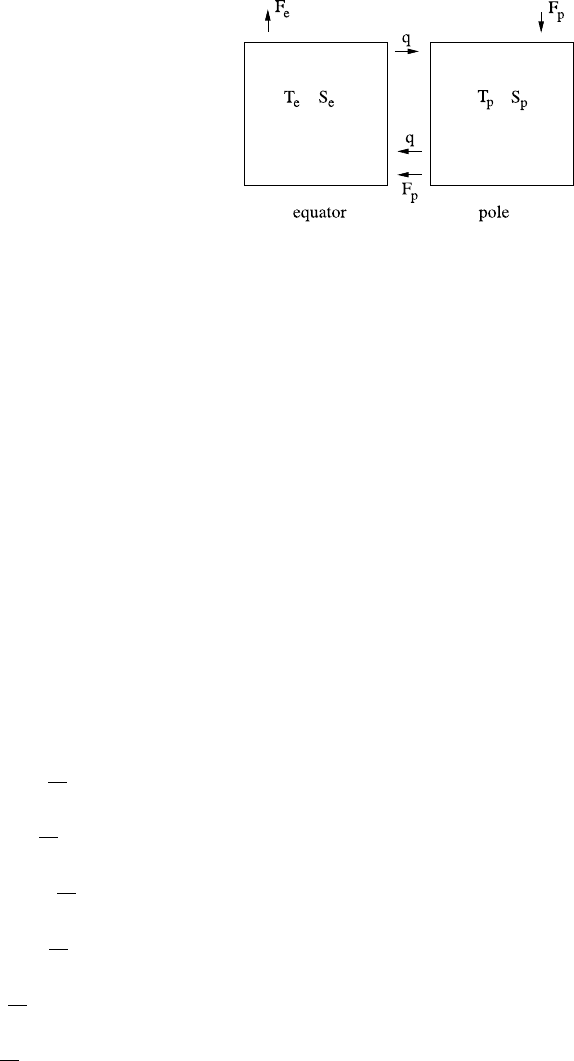
Fig. 2.22 Stommel’s box
model of the North Atlantic
circulation
2.5.7 North Atlantic Salt Oscillator
Deeply embroiled in this whole saga of Quaternary climate and the ice ages is the
rôle of the North Atlantic ocean circulation. For the descriptions we have given of
Heinrich events and Dansgaard–Oeschger events to work, the ocean needs to be
able to circulate in different ways. That this is indeed the case has been found in a
number of model studies, and the resultant flip-flop circulation is sometimes known
as the ‘bipolar seesaw’. In its original form, the idea is due to Henry Stommel, and
can be described with a simple ‘box’ model, as illustrated in Fig. 2.22.
In this model, we parameterise the thermohaline circulation in the North Atlantic
by considering it to be partitioned between two compartments, an equatorial and a
polar one. We label the temperature T , salinity (mass fraction of salt) S, density ρ
and volume V of each box by a suffix ‘e’or‘p’, and we write conservation laws
of mass, energy and solute, and an equation of state, for each box. Transports in
and out of each box are considered to be a freshwater flux F
p
to the polar cell, an
evaporative flux F
e
from the equatorial cell, and a convective flux q due to buoyancy
difference from equatorial to polar cell. (The reverse flux is then q +F
p
in order to
allow conservation of the sizes of both cells.)
Suitable equations to describe the convective flow are then
d
dt
(ρ
e
cV
e
T
e
) = A
e
H
e
+ρ
p
cT
p
F
p
+|q|
−ρ
e
cT
e
|q|,
d
dt
(ρ
p
cV
p
T
p
) = A
p
H
p
−ρ
p
cT
p
F
p
+|q|
+ρ
e
cT
e
|q|,
d
dt
(ρ
e
V
e
S
e
) =−ρ
e
|q|S
e
+ρ
p
S
p
F
p
+|q|
,
d
dt
(ρ
p
V
p
S
p
) = ρ
e
|q|S
e
−ρ
p
S
p
F
p
+|q|
, (2.106)
d
dt
ρ
e
V
e
(1 −S
e
)
= ρ
0
p
F
p
−ρ
e
F
e
,
d
dt
ρ
p
V
p
(1 −S
p
)
= 0,

2.5 Ice Ages 105
ρ
e
= ρ
0
1 −α(T
e
−T
0
) +β(S
e
−S
0
)
,
ρ
p
= ρ
0
1 −α(T
p
−T
0
) +β(S
p
−S
0
)
,
q =k(ρ
e
−ρ
p
).
The terms in these equations are fairly self-explanatory. α and β are coefficients of
thermal and saline expansion, ρ
0
p
is the freshwater density, A
e
and A
p
are the equa-
torial and polar ocean surface areas, and for simplicity we take A
p
=A
e
=A.The
heating terms H represent the heat flux to the deep ocean from the surface waters.
The sea surface temperature is determined by a radiative balance, which determines
equatorial and polar surface temperatures T
0
e
and T
0
p
, say. We then suppose that heat
transfer to the deep ocean can be parameterised by a suitable heat transfer coefficient
h
T
, thus we put
H
e
=h
T
T
0
e
−T
e
,H
p
=h
T
T
0
p
−T
p
. (2.107)
If we add the two energy equations, we have
d
dt
(ρ
e
cV
e
T
e
+ρ
p
cV
p
T
p
) =h
T
A
T
0
e
+T
0
p
−T
e
−T
p
. (2.108)
We use the facts that ρ
e,p
≈ ρ
0
and we will suppose that V
e
and V
p
, both approx-
imately constant, are also approximately equal, V
e,p
≈ V
0
. It then follows from
(2.108) that, after an initial transient,
T
e
+T
p
≈T
0
e
+T
0
p
, (2.109)
and we suppose this generally to be the case. We define V
0
by
ρ
e
V
e
T
e
+ρ
p
V
p
T
p
=2ρ
0
V
0
T
0
, (2.110)
where
T
0
=
1
2
T
0
e
+T
0
p
, (2.111)
and we then define the temperature excess T via
T
e
=T
0
+T, T
p
=T
0
−T. (2.112)
If we now make the assumptions that ρ
e
≈ ρ
0
, V
e
≈ V
0
in (2.106)
1
, then we have
the approximate equation for T :
ρ
0
cV
0
˙
T =
1
2
h
T
A
T
0
e
−T
0
p
+ρ
0
cF
p
T
0
e
+T
0
p
−
h
T
A +ρ
0
cF
p
+2ρ
0
c|q|
T.
(2.113)
In a similar way, we have
ρ
e
V
e
S
e
+ρ
p
V
p
S
p
=2ρ
0
V
0
S
0
, (2.114)

106 2 Climate Dynamics
where S
0
is constant, and we define
S
e
=S
0
+S, S
p
=S
0
−S. (2.115)
With the same Boussinesq type assumption, that ρ
e
≈ρ
0
and V
e
≈V
0
, we obtain
V
0
˙
S =F
p
S
0
−
F
p
+2|q|
S. (2.116)
Equations (2.113) and (2.116) are essentially Stommel’s box model. Their validity
relies on the use of the other equations to show that it is indeed realistic to take ρ
and V as constant, though these assumptions appear fairly reasonable ones. Note
that with the definitions of the variables, we have
q =2kρ
0
(−αT +βS). (2.117)
To parameterise the heat transfer coefficient h
T
, we use the ideas of Reynolds
averaging for turbulent flow (see Appendix B). This suggests choosing
h
T
=
ε
T
ρ
0
cq
0
A
, (2.118)
where the number ε
T
is typically chosen to be in the range 0.001–0.01, and q
0
is a
suitable scale for q, defined below in (2.124).
We non-dimensionalise the box model by writing
T =T θ, S =S s, t ∼t
0
,q∼q
0
, (2.119)
where we choose
T =
1
4
ε
T
T
0
e
−T
0
p
+
F
p
q
0
T
0
e
+T
0
p
,S=
F
p
S
0
2q
0
,t
0
=
V
0
2q
0
.
(2.120)
Using the values in Table 2.1, we find T ≈1K,S ≈1.1 ×10
−4
, t
0
≈150 y. We
use a value of q
0
as observed, rather than k, which we would in any case choose in
order that q was the right size, some 16 Sv (Sverdrups: 1 Sv = 10
6
m
3
s
−1
).
The observed surface temperature variation is of order 30 K, and the observed
surface salinity variation is of order 30 × 10
−4
. However, these values represent
the concentrative effect of surface evaporation and heating; at depth (as is more
relevant) the variations are much smaller, of order 2 K for temperature and 4×10
−4
for salinity at 1000 m depth. The time scale is comparable to the time scales over
which Dansgaard–Oeschger events occur. These features suggest that this simple
model has the ring of truth.
We can write the model in dimensionless form as
˙
θ = 1 −
μ +|q|
θ,
˙s = 1 −
ε +|q|
s, (2.121)
q =κ(−θ +Rs),

2.5 Ice Ages 107
Table 2.1 Typical parameter
values for the Stommel box
model
Parameter Value
ρ
0
10
3
kg m
−3
c 4.2 ×10
3
Jkg
−1
K
−1
V
0
1.6 ×10
17
m
3
A 0.4 ×10
14
m
2
ε
T
0.01
T
0
e
300 K
T
0
p
270 K
T
0
285 K
F
p
10
5
m
3
s
−1
q
0
1.6 ×10
7
m
3
s
−1
α 1.8 ×10
−4
K
−1
β 0.8
S
0
0.035
where the parameters are given by
ε =
F
p
2q
0
,μ=
1
2
ε
T
+
F
p
q
0
,
R =
βS
αT
,κ=
2kρ
0
αT
q
0
.
(2.122)
Typical values of these are, from Table 2.1,
ε ∼0.003,μ∼0.005,R∼0.5, (2.123)
and we can assume without loss of generality that κ =1, which fixes the value of q
0
(given k):
q
0
=2kρ
0
αT. (2.124)
Both ε and μ are small, and we will take advantage of this below.
It is straightforward to analyse (2.121) in the phase plane. Figure 2.23 shows the
steady states of q as a function of R when μ =0.005, ε =0.003. Neglecting ε and
taking μ to be small, we deduce that the steady states are given by
q ≈(R −1)
1/2
,R>1,
q ≈−(1 −R)
1/2
,R<1,
(2.125)
if q =O(1), and
q ≈±
μR
1 −R
,R<1, (2.126)
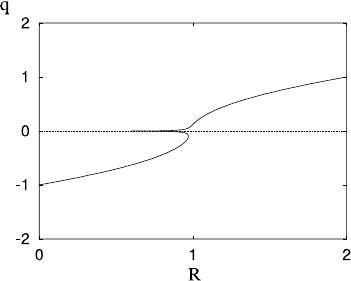
108 2 Climate Dynamics
Fig. 2.23 Steady states of
(2.125) as a function of R
if q = O(μ). As we might expect, the upper and lower branches are stable, and
the middle one is unstable. The upper branch corresponds to present climate, with
a northwards circulation at the surface. The stable lower branch corresponds to a
reversed haline circulation (thermal buoyancy dominates saline buoyancy because
R<1).
Stommel’s box model is not an oscillator as such, but it does point out the possi-
bility of multiple convective states of the North Atlantic, and this feature has been
found to be robust in other models. What appears to distinguish more realistic mod-
els from the Stommel box model is that they allow North Atlantic deep water for-
mation to occur at different latitudes. Thus rather than simply switching from a
northerly flow to a southerly one, adjustments can occur between strong northerly
flows with deep water formation in the Norwegian sea, and weaker flows with deep
water formation further south. It seems that these switches are instrumental in caus-
ing the rapid climatic changes during ice ages.
2.6 Snowball Earth
The story of climate on the Earth becomes perhaps more fascinating if we shift our
gaze from the relatively recent geologic past to that of more ancient times. There
is evidence of glaciation on Earth throughout geologic time, and on all continents.
Since the continents move, through the process of plate tectonics, on time scales of
hundreds of millions of years, and since their positions and configuration are instru-
mental in determining ocean circulations and carbon budget (as described below), it
seems that plate tectonics is implicated in the long term control of climate.
Recently, one of these periods of glaciation has been at the centre of a scientific
controversy concerning what has been picturesquely termed the ‘snowball Earth’.
In the Neoproterozoic era, between about 750 and 550 million years ago, there was
a sequence of glacial episodes. At that time, the Earth’s land masses were assem-
bled into a supercontinent called Rodinia, which broke up in a similar way to that

2.6 Snowball Earth 109
in which Gondwanaland fragmented some 200 million years ago.
9
The glaciation
of Rodinia would not in itself be surprising, except for the fact that it seems that
the supercontinent was located near the equator. It is not impossible for glaciers to
exist in equatorial regions at high altitudes (there is an ice cap today on Mount Kil-
imanjaro in Tanzania), but the suggestion for the Neoproterozoic is that there were
widespread ice sheets, and that in fact the land masses were covered with ice. If we
suppose also that the oceans were largely ice covered, we see how the concept of a
snowball Earth arises.
Although the concept of an ice-covered Earth is entirely consistent with a simple
energy-balance model, it is less easy to explain in detail. At that period, the Sun
was 6% fainter than today. Model simulations appear able to produce equatorial
glaciation providing there is very little CO
2
in the atmosphere, but it is not obvious
how to produce such low levels. Nor is it easy to see how to terminate a snowball
glaciation.
An interesting idea to explain this latter conundrum is the widespread occurrence
of cap carbonate rocks overlying the glacigenic tillites formed from the sub-glacial
basal sediments. The idea is that with widespread glaciation and very low tempera-
tures, there would be no water vapour in the atmosphere. Subglacial volcanic erup-
tions would continue to produce CO
2
however, and with no clouds or water vapour
to dissolve it (and rain it out), it would simply build up in the atmosphere. Eventu-
ally, the consequent greenhouse effect would cause a rise in temperature, followed
by massive deglaciation, moistening of the atmosphere, and thus widespread acid
rain. The resulting weathering processes produce the cap carbonate rocks which are
seen overlying the glacial tillites.
If this end part of the story is enticing, it is not easy to initiate an equatorial
glaciation. One possible way is to allow increased weathering of an equatorial su-
percontinent (because of tropical climate) which causes reduction of atmospheric
CO
2
; this then causes the cooling which initiates the glaciation. Once under way,
the ice-albedo feedback effect leads to the snowball. Evidently, the whole account
relies strongly on the interaction of the carbon cycle with climate. This idea is at-
tractive, because it is widely thought that the onset of the current ice age climate
originated with the collision of India and Asia some fifty million years ago. The
resulting (and continuing) uplift of the Himalayas resulted in massively increased
weathering rates, and therefore reduction of atmospheric CO
2
and consequent plan-
etary cooling. It is thought that the initial growth of the Antarctic Ice Sheet some 34
million years ago is a consequence of this cooling.
2.6.1 The Carbon Cycle
Just as living organisms have a variety of cycles (sleep-wake cycle, menstrual cycle,
cell renewal and so on), so the Earth has a number of cycles. Water, rock, topography
9
The problems of plate tectonics are discussed in Chap. 8.