Glikin A.E. Polymineral-Metasomatic Crystallogenesis
Подождите немного. Документ загружается.

4.6 Some Methods of Estimation of Reaction Volume Effect 171
localized automorph with a hard central core and a loose periphery is most likely
to occur if an isotherm has a convex trajectory (Fig. 4.1k). It is to be noted that the
above phenomena can only occur in a relatively small quantity of solution, assum-
ing, of course, that after accessing the eutonic point in a congruent system the
replacement stops and excessive matter of the protocrystal remains preserved in
relics. If the amount of a solution is relatively great, the process is characterized by
a short sector of the isotherm and the system state is close to a stationary one, with
formation of an almost homogeneous structure of the replacement products.
The process becomes more complicated in presence of additional compounds
(Fig. 4.1c). The quantity A′ of a dissolved substance makes it possible to generate
a quantity M′ of an additional phase, which requires a quantity B′ of the dissolving
substance. This mechanism is represented by auxiliary dash–dot lines in A′OB
coordinates. At the same time, M′M
1
part of the extra phase would crystallize,
while the other part OM
1
would remain in the solution. Further dissolution of B
results in crystallization of the additional substance M, which proceeds until the dot
E
2
is attained; quantities of substances undergoing dissolving and salting-out
(B
1
and M
1
M
2
) can be readily estimated using BOM coordinates (see corresponding
auxiliary dash–dot lines). The total balance of the process is as follows: amount
B′ + B
1
of the protocrystal dissolves, and M′M
2
quantity of a new formation crystal-
lizes out. This formal conclusion is only a partial representation of the real process,
which becomes quite complicated due to salting-out followed by dissolution of
substance A according to the sector A′E
1
, as it was mentioned before.
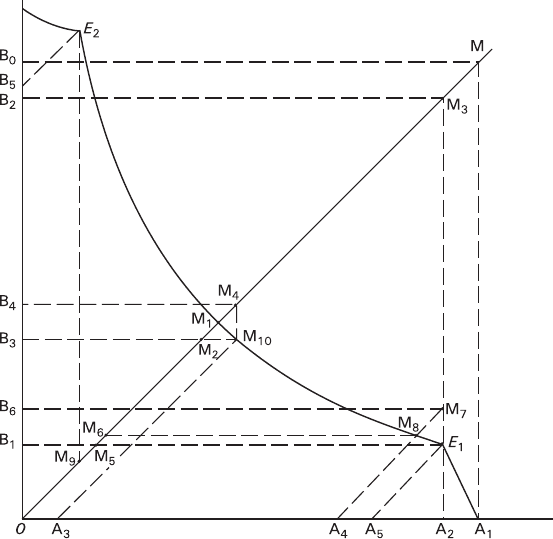
This process, including a number of uncertainties caused by kinetic effects, is
shown in details in Fig. 4.5.
At the first stage (trajectory A
1
E
1
), the quantity of dissolving protocrystal B is
characterized by the sector OB
1
, while the amount of the new formation A is
described by the sector A
1
A
2
.
At the second stage the process proceeds along E
1
M
1
trajectory and its estima-
tion should be performed in A
1
OM coordinates. At this stage the substance A dis-
solves completely accompanied by continuous dissolution of the substance B and
initiating the salting-out of the substance M. The quantity of the substance M
undergoing salting-out ranges from M
5
M
6
to M
1
M
2
and depends upon the ratio
between the rate of replacement of the substance B and that of the substance A.
These sections are plotted on the abscissa as sectors OA
3
and A
4
A
5
, which are equal
to section A
1
A
2
; after that it is possible to draw the lines A
3
M
10
and A
4
M
8
, as well
as the lines M
10
M
2
and M
8
M
6
(E
1
A
5
, A
3
M
10
, and A
4
M
8
are parallel to OM, while
M
10
M
2
and M
8
M
6
are parallel to the abscissa). To reach the position M
1
it is neces-
sary to dissolve the main quantity B
1
B
2
of the substance B (thus precipitating M
1
M
3
amount of M) and an additional quantity, which is described by the interval B
1
B
6
–
B
3
B
4
(thus precipitating M
7
M
8
–M
1
M
4
quantity of M). Dissolution of the additional
part of B compensates the movement of the system toward the dot E
1
that is caused
by the replacement of the substance A.
The additional part of the substance B and a quantity of the substance M corre-
sponding to that part, and the additional ratios of B, M, and A cannot be estimated
precisely, as their reactions are prolonged, and so their volume effect changes in the
172 4 Physicochemical Analysis of Metasomatic Crystallogenesis
course of the process in accordance with the isotherm curvature. Reaching the
extreme values of B
1
B
6
–M
7
M
8
is possible if an extremely fast secondary replace-
ment takes place completely in the point E
1
, and the values of B
3
B
4
–M
1
M
4
are
feasible, and if an extremely slow replacement of A proceeds almost completely at
the third stage.
The third stage of the process corresponds to the trajectory M
1
E
2
and all calcula-
tion should be performed in BOM coordinates. Here, amount of dissolving sub-
stance B can be calculated from the sector OB
5
, while the quantity of precipitating
substance M is described by M
1
M
9
section.
If an insoluble additional compound is present in the system (reactions of type
III; e.g., system KAl(SO
4
)
2
·12H
2
O–BaSO
4
–BaCl
2
·2H
2
O–H
2
O), the points M
1
, M
2
,
E
1
, and E
2
coincide with zero point of the coordinates. The amount of the new for-
mation precisely corresponds to the section OM and may be calculated from ordi-
nary chemical equations describing exchange reactions.
It is desirable that solubilities plotted on the axes should be expressed as volume
units indicating ratio of a substance volume to a fixed amount of a solvent (e.g.,
1 cm
3
of a substance per 100 g of H
2
O or any other solvent having a fixed composition).
Fig. 4.5 Scheme for graphic determination of the volume effect at a multistage replacement of
crystals B in solution of the initial composition A
1
in a system containing additional compound M
(for a more schematic representation see Fig. 4.1c)
References 173
In a double-salts system (Fig. 4.1a) the axes scales are mutually independent and
can be arbitrary chosen in accordance with the formula composition of the sub-
stances involved, which, if present, should also include water of crystallization. If
the system contains any additional compounds (Figs. 4.1b, c), using this direct
method is impossible. Quantitative indices of all the three axes may be consistent
only when the measurement units of the main axes are expressed in equal molar or
weight units of components, a sum of which makes the formula of the additional
compound. For example, in analyzing replacement of KAl(SO
4
)
2
·12H
2
O alum with
BaSO
4
in solution of BaCl
2
·2H
2
O, the main axes should indicate contents of Ba
2+
and SO
4
2−
ions determined in equilibrium solutions, while the intermediate axis
should indicate content of BaSO
4
. To use the diagram it is convenient to convert the
chosen solubility units of each axis into volume contents of substances in their
formula representations. The scales thus obtained would be different, but compat-
ible with each other.
Naturally, graphic representation of multi-type systems must be different, and
exemplary examination of some incongruent systems – systems with several addi-
tional compounds – or quaternary and more complex systems proves this in full
measure. Isomorphic replacement cannot be exactly examined in volume unit coor-
dinates, as the densities of the solid phases vary. Quantitative graphical analysis of
such replacement processes requires plotting special nomograms.
This section was not written to present any analytical algorithms. The examples
cited are to demonstrate a practicality of an important physicochemical approach to
replacement processes. It is to be noted that volume effect of replacement (under the
non-isothermal conditions too) entirely depends upon the equilibrium parameters of
a system. The proposed approach of physicochemical analysis combined with crys-
tallogenetic interpretation of structural-morphological and kinetic phenomena is
supposed to reveal the essence of metasomatic reactions and at present has no valid
alternatives. Of course, known variety of natural physicochemical systems does not
comprise all the possible cases, so only indirect features are available for analysis of
the process mechanisms, its driving forces and characteristic features. However, the
proposed approach provides a solid basis for mineral-genetic examinations. At the
same time, it is necessary to emphasize a difference between volume effect of crystal
replacement, which depends upon equilibrium characteristics of a system, and a
metasomatic change of the entire bulk of a mountain rock, which is substantially
defined by its mechanical characteristics and the process kinetics.
References
Anosov VYa, Ozerova MI, Fialkov YuA (1976) Fundamentals of physicochemical analysis.
Nauka, Moscow (Russ.)
Franke VD, Glikin AE, Kryuchkova LYu et al. (2007) Cocrystallization of isomorphic compo-
nents in solutions and crystal zoning: an example of the (Ba,Pb)(NO
3
)
2
series. Geol Ore
Deposits: 49:7:641–647
174 4 Physicochemical Analysis of Metasomatic Crystallogenesis
Glikin AE (1991) Mechanisms of inheriting and losing the structural attributes of rocks in the
course of metasomatism and recrystallization. In: Gelman ML (ed) Metamorphic complexes
of the North-East of USSR, their ore content and geological mapping. Russian Academy of
Science, Magadan (Russ.)
Glikin AE (1995a) On the theory of formation of isomorphic-mixed crystals. Zapiski Vsesoyuz
Miner Obsh 5:125–134 (Russ.)
Glikin AE (1995b) Crystallogenesis and geological-mineralogical sciences – coordination prob-
lems (by example of metasomatism phenomena). Zapiski Vsesoyuz Miner Obsh 4:116–125
(Russ.)
Glikin AE (1996a) The physicochemical aspect of the unsteady state of metasomatic crystal pro-
duction. Geochem Intern 33:8:117–128 (Russ.)
Glikin AE (1996b) About equilibrium supercooled solutions related to formation of isomorphic-
mixed crystals. Zapiski Vsesoyuz Miner Obsh 5:103–111 (Russ.)
Glikin AE (1996c) Modeling of metasomatic crystallogenesis in aqueous-salt systems. Dr Sci
thesis. St. Petersburg State University, St. Petersburg (Russ.)
Glikin AE (2002) Features of rapakivi origin in terms of polymineral-metasomatic crystallogen-
esis. Miner Soc Poland. Special Papers 20:17–19
Glikin AE, Petrov SV (1998) Recrystallization of bimineral aggregates. Zapiski Vseross Miner
Obsh 4:79–88 (Russ.)
Glikin AE, Sinai MYu (1991) Morphological and genetic classification of crystal replacement
products. Zapiski Vsesoyuz Miner Obsh 1:3–17 (Russ.)
Glikin AE, Sinai MYu (2004) Metasomatic formation of poikilitic crystals: experimental mode-
ling. Doklady Earth Sci 396: 4: 563–566
Glikin AE, Kovalev SI, Rudneva EB, et al. (2003) Phenomena and mechanisms of mixed crystal
formation in solutions I. General concept on the example of the system KHC
8
H
4
O
4
-
RbHC
8
H
4
O
4
-H
2
O. J. Cryst Growth 255:150–162
Glikin AE, Kryuchkova LYu, Plotkina YuV (2007) Crystallogenetic grounds of isomorphism:
experimental data and theoretical approach. Zapiski Russ Miner Soc, Crystallogenesis and
Mineralogy, Special Issue 7–35. Nauka, St. Petersburg
Kasatkin IA, Leont’eva OA (1992) Phase equilibria in aqueous salt systems containing isomorphic
components. Inorganic materials 28:6:1169–1172 (Russ.)
Kasatkin IA, Glikin AE, Bradaczek H, et al. (1995) Kinetics of mixed crystal K
2
(SO
4
,CrO
4
)
growth from aqueous solutions. Cryst Res Techn 30:5:659–666
Kirgintsev AN (1976) Sketches on thermodynamics of aqueous salt systems. Nauka, Novosibirsk
(Russ.)
Korzhinskii DS (1970) Theory of metasomatic zoning. Clarendon Press, Oxford
Kryuchkova LYu, Glikin AE, Voloshin AE, et al. (2002) Kinetic and morphological phenomena
of growth and isomorphic replacement of mixed crystals in solutions (in the series (Co,Ni)
(NH
4
)
2
(SO
4
)
2
·6H
2
O). Zapiski Vsesoyuz Miner Obsh 3:62–77 (Russ.)
Kulkov and Glikin (2007) Replacement of nickelhexahydrite with retgersite: polymorphic–meta-
somatic structures. Geol Ore Deposits 49:8:159–164
Punin YuO (1964) Recrystallization in aqueous solutions accompanied by grain coarsening.
Zapiski Vsesoyuz Miner Obsh 3:364–367 (Russ.)
Punin YuO (1965) On mechanism of recrystallization. Zapiski Vsesoyuz Miner Obsh 4:459–462
(Russ.)
Putnis A (2002) Mineral replacement reactions: from macroscopic observations to microscopic
mechanisms. Miner Mag 66:5:689–708
Shubnikov AV (1918) Influence of temperature fluctuations upon crystals. J Russ Physicochem
Soc. Phys Branch 50:39–44 (Russ.) (see also in: Zs Krist 1941 54:3–4:417–433)
Sinai MYu, Glikin AE (1989) Formation of case-like and negative pseudomorphs. Geol Explor
4:31–35 (Russ.)
Treivus EB (1977) Elaboration of the state diagrams of multi-component systems. In: Mass crys-
tallization. IREA, Moscow (Russ.)
Treivus EB (1982) A method of depicting the compositions of isomorphic crystals and three-
component solutions equilibrial to them. In: Frank-Kamenetskii VA (ed) Crystallography and
Crystallochemistry. Leningrad State University, Leningrad (Russ.)
Treivus EB (2000) About isothermal diagrams of ternary systems containing binary solid solution.
Vestnik St. Petersburg State University 7 Ser 2:15:14–22 (Russ.)
Treivus EB, Rozhnova GA (1962) Experimental reproduction of metasomatism in water-soluble
salts. Zapiski Vsesoyuz Miner Obsh 2:219–222 (Russ.)
Wyckoff R (1965) Crystal structures 1. Wiley, New York/London/Sidney
Wyckoff R (1966) Crystal structures 3. Wiley, New York/London/Sidney
References 175
Chapter 5
Metasomatic Transformation of Aggregates
5.1 On Replacement and Growth of Monocrystals
in the Course of Transformation of Aggregates
The processes of metasomatic transformation of aggregates can be conveniently
represented as a series of isolated replacements of single individuals. It is obvious
that replacement of individuals in aggregates conforms to the rules discussed above
for single protocrystals (see Chapter 1). Experiments conducted by Dr. M. Yu. Sinai
showed that a compact crystal aggregate behaves in a course of replacement as an
entity transforming either into a single pseudomorph, or a single automorph. It can
be accounted for by formation of a common diffusion field around the aggregate
undergoing dissolution, which induces precipitation of a new formation in the
periphery of the aggregate (pseudomorphic replacement) or at some distance from
the initial aggregation (automorphic replacement). Moreover, if the distance
between the individuals undergoing replacement is sufficient, the morphological
patterns are expected to be complicated as a result of overlapping the areas occu-
pied by the new formations produced around various individuals. Variation of
temperature causes direct processes of growth and dissolution to occur, which
would take place mainly on the border of a compact aggregate, subsequently pen-
etrating its inner part as the structure of the aggregate undergoes loosening. At the
same time, loosening the aggregates should induce an abrupt acceleration of
restructuring the solution.
Thus, metasomatic transformation of aggregates covers all four overelementary
classes of metasomatic crystallogenesis (see Introduction). During pseudomorphic
replacement of aggregates or individuals composing the aggregates, the basic fea-
tures of the initial structure (the first and second classes) should generally remain,
while during automorphic replacement of individuals the overlapping areas of the
products would to some extent conceal the protostructure (mainly, the third and
fourth classes). At the same time, structural-morphological diversity of the product
characteristics can be practically unlimited, being determined by the number and
quantitative ratio of solid reactants, their granulometric composition, spatial distri-
bution, as well as their physicochemical properties and kinetic characteristics of
growth and dissolution. Therefore, in contrast to replacement of monocrystals,
A.E. Glikin, Polymineral-Metasomatic Crystallogenesis, 177
© Springer Science + Business Media B.V. 2009

178 5 Metasomatic Transformation of Aggregates
these processes should mostly belong to the reactions of the third and fourth
classes, as their products do not maintain any spatial and spatiotemporal relations
to the initial individuals.
Investigations of aggregate metasomatic replacement have been mainly focused
on the general phenomena and mechanisms of replacement of rock massifs (Irving
1911; Lindgren 1925; Pospelov 1976; Zavaritskii 1950; Korzhinskii 1955, 1970;
Demin et al. 1979; Zaraiskii 1979, 1991; Zaraiskii et al. 1981, 1986; Petrov 1983;
Yardley 1989; Barton et al. 1991; Aleksandrov 1995; and others). These investiga-
tions made the grounds for a diffusion–infiltration theory of metasomatic process
and allowed to formulate valid approaches to such well-known problems as analysis
of changes in total chemical composition of the rocks, construction of metasomatic
columns, and discovering succession of stages in metasomatic processes.
In this connection, a great attention is focused on the volume effect of metaso-
matic process. In contrast to unambiguous volume relations between the educt and
product observed during replacement of monocrystals (see Sects. 1.5.2 and 4.6),
effect of the replacement process upon the total volume of a rock formation cannot
be determined since it is mediated by the forms of mineral replacement, initial rock
porosity, and the rock expansive or compressive properties. Volume-deficit in a
rock massif can be compensated by increase in the rock friability and contraction,
which also can be accompanied by the removal of a new formation from the reac-
tion area. Also, the extreme case of volume compensation, which is formation of
spongy mixed crystals, would affect neither intercrystal space nor the total amount
of rock or any of its blocks. On the contrary, variations of the volume characteristics
of rocks are probably difficult to be evaluated when friability of the rocks increases
in various ways accompanied by contraction and removal of the secondary material.
The volume excess can be expressed as an increased volume of the mixed crystals,
filling up the pores and cracks with secondary crystals, removing the new formation
outside the reaction space, and as expanded dimensions of the massif undergoing
replacement.
1
Moreover, these processes are very likely to occur in combination
and their results appear to be rather uncertain; for example, removal of a new for-
mation outside the reaction volume can lead to the total volume-deficit, despite the
fact that the reaction balance is volume-excessive.
So, it is important to distinguish analysis of the volume transformations of
individual crystals from examination of rocks undergoing metasomatic transforma-
tions. It is to be noted that all the above-mentioned factors determining the volume
effect are well-known, and any concept implying the volume constancy cannot be
accepted as justifiable.
1
The most demonstrative example of the massif extension is a volume-excess replacement of
anhydrite with gypsum accompanied by development of local tectonic phenomena (Betekhtin
1961). It is to be noted that reactions of anhydrite transformation into gypsum and those of dehy-
dration of anhydrite (Prodan 1990) are typical reactions of metasomatic replacement and they
always involve salting-out.
5.1 On Replacement and Growth of Monocrystals in the Course 179
Another trend includes studying the metasomatic formation of individuals and
local peculiarities of structures of rocks and vein-shaped bodies (e.g., Ramdohr,
1955; Betekhtin et al. 1958; Atlas… 1976; MacKensie and Guilford 1980;
Adams et al. 1984; Yardley et al. 1990; Barker 1994; Craig and Vangham 1994).
This concept comprises two popular replacement models, namely a solid-phase
model (Lindgren 1925; Grigor’ev 1961) and a three-zone model (Beus 1961;
Pospelov 1973). Numerous investigations encompass uncountable metacrystals,
pseudomorphs, rims, and other specific aggregates, which in some cases allow to
reveal (including reported descriptions, regardless of the questions considered by
authors) some attributes of inheriting the primary aggregate structure by pseudo-
morphs (Lyakhovich 1954), by formations, which here are referred to as local-
ized automorphs (Tatarskii 1939; Velikoslavinskii 1953; Sudovikov 1967;
Adams et al. 1984), by shadowed pseudomorphs (Chesnokov 1974), and
some other formations.
Compositions and spatial distributions of minerals in numerous experimental
samples belonging to various metasomatic columns have been thoroughly investi-
gated; the results obtained have been generalized in the well-known concept of
column zonality (Zharikov and Zaraiskii 1973; Zaraiskii 1991; and others). The
descriptions contain data on some features of aggregate structure and in some cases
on metacrystal morphology (Schouten 1934; Garrels and Dreyer 1952; Ol’shanskii
and Brusilovskii 1958; Pospelov et al. 1961; Treivus and Rozhnova 1962; Zaraiskii
1979; Zaraiskii et al. 1981; Krasnova et al. 1983; Zaraiskii et al. 1986; Zaraiskii
1991; Krasnova and Petrov 1997; and others). Only a few reported works include
crystallogenetic analysis of behavior of individuals (Krasnova et al. 1983;
Krasnova and Petrov 1997).
The forms of metasomatic crystal growth were studied in precipitation experi-
ments using the method of reactant counter diffusion (Henisch 1970; Wilke 1973;
Petrov et al. 1983; Askhabov 1984; Givargizov et al. 1984; and others), which is
one of the experimental analogs of a contact-reaction process. The minerals pre-
pared belong to all mineral classes, the examples including gold (Kratochvil et al.
1968), cinnabar (Murphy et al. 1968), nantokite, miersite, and fluorite (Armington
and O’Connor 1968; Murphy et al. 1968; Kiryanova et al. 1984; Kiryanova and
Glikin 1999), magnetite and structural analogs of garnet (Y
3
Fe
2
[FeO
4
]
3
– Y-Fe-garnet)
and perovskite (YFeO
3
– Y-Fe-perovskite or orthoferrite) (Mikhailov et al. 1973),
celestine (Ulyanova and Petrov 1971), calcite (Kiryanova et al. 1998; Kiryanova
and Glikin 1999, and some others).
Y-Fe-garnet, Y-Fe-perovskite, fluorite, and calcite were synthesized for
researches of crystal morphogenesis (Mikhailov et al. 1973; Kiryanova et al. 1984).
These substances are interesting examples of metasomatic replacements in aggre-
gates having different primary structures. The experiments differed in having vari-
ous manners of arranging the reactant powders in solutions. The first experimental
series involved divided weights of pure initial reactants (in fluorite preparations the
distance between the reactant portions was about 20 cm, in calcite preparations
it was about 5 cm, and in Y-Fe-garnet and Y-Fe-perovskite preparations it was about
1–2 cm). Another variant comprised contacting portions of pure reactants (Y-Fe-garnet
180 5 Metasomatic Transformation of Aggregates
and Y-Fe-perovskite syntheses). The third series included mixtures of reactants
(Y-Fe-garnet and Y-Fe-perovskite synthesis), and the fourth variant consisted in
reactions of calcite crystals with fluorine-containing solutions. Crystallizations of
fluorite and calcite were conducted via diffusion in water of a number of soluble
salts containing calcium and fluorine (fluorite) or calcium and carbonate ion (cal-
cite) at room temperature and under low-temperature hydrothermal conditions in
solution having various pH values. Joint synthesis of Y-Fe-garnet and Y-Fe-perovskite
was carried out via a reaction of iron and yttrium oxides in hydrothermal solutions
of KOH. In this experimental series, diffusive influx of hydrogen into the solution
caused reduction of initial hematite that resulted in crystallization of magnetite in
association with the above minerals. It is to be reminded that hydrogen metaso-
matism is classified as an independent type of metasomatic process (Rus’ko 1976;
Lazarenko 1979).
It was possible to observe various distributions of new formations of Y-Fe-garnet
and Y-Fe-perovskite in container corresponding to the theory of precipitating the new
formations due to counter diffusion of components (Petrov et al. 1983). When the
reactants were divided, Y-Fe-garnet and Y-Fe-perovskite crystals were formed at the
border between a free volume of the solution and iron oxide, which had a significantly
lower solubility than yttrium oxide. Fluorite was also formed on the surface of the
less-soluble reactant or in relative proximity to it in a free solution volume. When the
reactants were in contact, precipitation of the new formation (Y-Fe-garnet and Y-Fe-
perovskite) was asymmetric in respect to the contact interface, proceeding in the way
analogous to that observed in model bimetasomatic columns (Zaraiskii et al. 1986).
In the case considered, it is possible to conclude that precipitation of the new forma-
tions occurs within the mass of the less-soluble iron oxide at different distances from
the surface of contact. In the mixtures of the initial reactant the new formations pre-
cipitated chaotically within the whole bulk. Degree of hematite replacement with
magnetite (proceeding under the action of hydrogen in accordance with usual scheme
of regenerative process) decreased along the column in downward direction, as the
distance from the top of container where hydrogen penetrated the system via holes in
the cover. Thus, the area of precipitation of the new formation was characterized by
“common” replacement front, which resulted from superposition of diffusive fields
induced by different individuals composing the aggregate. In this case, the aggregate
behaved as a whole entity and spatial coordination between the products and the
individuals undergoing replacement became lost completely, i.e., the system was
found to display all the attributes of the third overelementary class of metasomatic
crystallogenesis (see Introduction).
Synthesized crystals of Y-Fe-garnet, Y-Fe-perovskite, and magnetite looked like
a uniform fragile aggregate or could be distributed in a polycrystalline mass of
unreacted but partially recrystallized initial substances, mainly, in the mass of iron
oxides. Metacrystals could reach 1 mm in size. This result is an illustration for a
model of metasomatic formation of crystals in a solid medium proceeding in
accordance with the three-zone mechanism (Beus 1961; Pospelov 1973).
As a rule, crystals of metasomatic new formations have full-faceted, sometimes
skeletal, form with usual relief elements (growth layers, vicinal hillocks), typical

for the process of free growth from the solution; the same features have been also
detected in natural crystals (Novgorodova 1968). It should be emphasized that
morphological peculiarities of metasomatically formed fluorite and fluorite
obtained in direct growth experiments appear to be the same. It is a direct evidence
of common morphogenesis mechanisms of both types of crystallizations.
Faceting of crystals prepared by means of counter-diffusion method (analog of
bimetasomatic process) can include a small set of crystal forms (e.g., only {111}
for magnetite). Nevertheless, occurrence of some forms, atypical for synthesized
crystals, is also observed rather frequently, for instance: fluorite can develop the
{111}, {100}, {110}, and {112} faces instead of usual {111} and {100} combi-
nation; calcite occurs in the {0001}, {101
¯
1}, {011
¯
2}, and {088
¯
1} faces instead
of the {0001} and {1011
¯
} ones, Y-Fe-garnet forms {112}, {110}, {123}, {130},
and {100} faces instead of {110} and {112}. The number of crystal forms for the
orthorhombic orthoferrite reaches 16. The faceting variety can be explained by
nonstationarity of preparative conditions (Glikin and Glazov 1979; Grunskii
1988; Kasatkin et al. 1995) reflecting a specificity of metasomatic crystallogenesis,
which has been stated to be determined by nonstationary nature of metasomatic reac-
tions (Dolivo-Dobrovol’skii 1967; Glikin 1996a; and others). Of course, this
assumption requires thorough investigation since the variations of the forms can
be induced by usual influence of medium composition, supersaturation, and
temperature.
Metasomatic phenomena can accompany direct growth of polymineral aggre-
gates; it has been discussed in Chapter 2. One of the extreme cases of such a proc-
ess is probably formation of a metastable phase followed by its dissolution caused
by change in the solution composition induced by growth of the other phase (these
processes can be classified as belonging to any one of the two to four overelementary
classes). The metastable phase can be partially dissolved (see Sect. 4.5 and com-
ments to Fig. 4.4) or disappear completely, as it happens, for example, during
evaporation of an aqueous KNO
3
solution, where a hexagonal modification of
KNO
3
, having precipitated originally, dissolves, being automorphically replaced
with an orthorhombic modification (these phenomena can be classified as belong-
ing to the third overelementary class). A phase can be dissolved partially or com-
pletely, and then get crystallized again. For example, according to our data,
2
at the
first stage of the experiments involving Na
2
S
2
O
3
–NaNO
3
–H
2
O system, evaporation
followed by cooling resulted in formation of an aggregate composed of three to four
alternating polycrystalline zones consisting of Na
2
S
2
O
3
and NaNO
3
. During the
second stage of the experiment, zones of one of the substances dissolved com-
pletely accompanied by continuous growth of the second phase. During the third
stage, both substances precipitated again in a whole bulk of the residual solution
(the fourth-class phenomena).
Growing of crystals via dissolution of polycrystalline substance having another
composition accompanied by a convective transport of the matter to the growth
5.1 On Replacement and Growth of Monocrystals in the Course 181
2
Ms M. V. Togatova performed the experimental investigations.