Glikin A.E. Polymineral-Metasomatic Crystallogenesis
Подождите немного. Документ загружается.

70 2 Joint Growth of Crystals of Different Phases
from 0.0 to 3.0 for ΔT = 1.0°C and from 0.3 to 7.0 for ΔT = 2.0°C, while for NaCl the
rates varied from −3.0 to 2.0 for ΔT = 1.0°C and from −1.0 to 5.0 for ΔT = 2.0°C.
Presence of MgCl
2
in solutions of the both phases complicated kinetic regularities
(Fig. 2.7). According to data obtained in individual experiments, slow dissolution
of NaCl crystals (rates varying from about −2 to about −0.2 μm/min) and slow
growth of KCl crystals (rates varying from about 0.5 to about 1.5 μm/min) occurred
in solutions containing low concentrations of MgCl
2
(0–1 wt%). When concentra-
tion of MgCl
2
ranged from about 3 to about 7 wt%, KCl growth rates reached
3.8 μm/min, and those of NaCl were about 4.5 μm/min. Further increase of MgCl
2
concentration (up to 12–20 wt%) led to slowing down the growth of the both
phases, and, ultimately, to dissolution (negative values of growth rates). At ΔT = 2.0
the crystals of KCl stopped growing and started dissolving when MgCl
2
concentra-
tion exceeded about 13 wt%, while for NaCl seeds this transformation took place
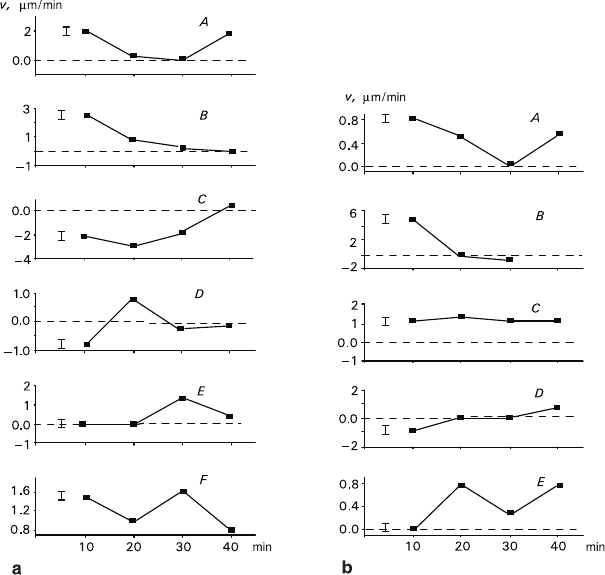
Fig. 2.6 Time dependences of growth rate obtained for NaCl crystals a – ΔT = 1.0°C: A – including
a growth rate minimum; B – monotonous slowing down to zero rate; C – increasing growth rate
(from negative to positive values); D, E – including a rate maximum; F – including both the
rate maximum and minimum. b – ΔT = 2.0°C: A – including a growth rate minimum; B – mono-
tonous slowing down and transfer to dissolution; C – constant rate; D – increasing growth rate
(from negative to positive values); E – including both the rate maximum and minimum
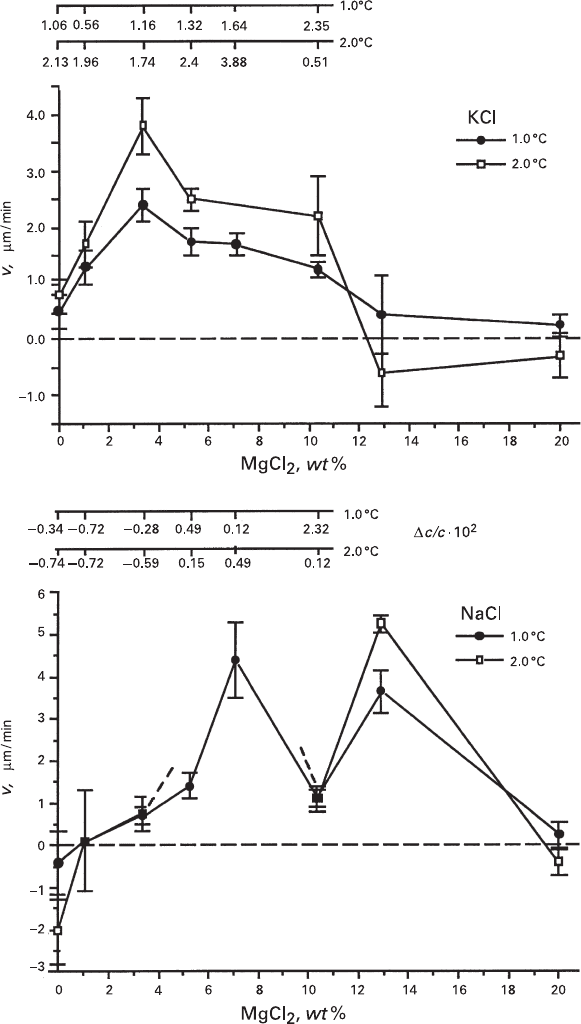
Fig. 2.7 Correlations between the growth rates of KCl (a) and NaCl (b) crystals and concentra-
tion of MgCl
2
at ΔT = 1.0 and 2.0°C and 40°C saturation temperature Scales in the upper part of
the figure denote experimental supercooling degrees obtained from the phase diagram (Fig. 2.8)
72 2 Joint Growth of Crystals of Different Phases
when MgCl
2
content was above 20 wt%. In contrast to supercooled binary and ter-
nary systems, considerable concentrations of MgCl
2
in supercooled quaternary
solutions caused dissolving both KCl and NaCl seeds. Under the above conditions
we observed the minimum of NaCl growth rate, which occurred at 10.35 wt% of
MgCl
2
and ΔT = 1.0 and 2.0°C and was proved by the coincidence of shapes of the
curves obtained for both levels of supercooling.
2.2 Physicochemical Model
2.2.1 Phase Equilibria in KCl–NaCl–MgCl
2
–H
2
O System
Equilibria in KCl–NaCl–MgCl
2
–H
2
O system are usually represented as the
Schreinemakers diagrams, which contain mutual solubility lines for the compo-
nents and linear eutonic curves reflecting decreasing NaCl content with increasing
KCl concentration and rising the temperature. The diagram was thoroughly inves-
tigated taking into consideration both the conventional solubility values (Buksha
and Shestakov 1997) and results obtained in collaboration with a team of Research
Institute of Mineral-Salt Production in 1989 (Glikin et al. 2001) to reveal more
details including specific distortion of the main elements. Discovered peculiarities
of phase equilibria allowed to interpret the above-mentioned phenomena of crystal
growth/dissolution, and at the same time kinetic data obtained provided additional
proofs for the proposed variant of the diagram (Fig. 2.8a).
In accordance with the Schreinemakers method, the absolute values of NaCl and
KCl concentrations (N and K, correspondingly) in solution are plotted on the coor-
dinate axes. Lines N
20
0
–E
20
0
–K
20
0
, N
40
0
–E
40
0
, and N
55
0
–E
55
0
–K
55
0
represent solubility
isotherms for NaCl and KCl (N and K branches, respectively) at 20°C, 40°C, and
55°C in the ternary system in the absence MgCl
2
(the intermediate isotherms are
not shown); lines N
20
i
–E
20
i
–K
20
i
, N
40
i
–E
40
i
, and N
55
i
–E
55
i
–K
55
i
are the solubility iso-
therms of these substances at 20°C, 40°C, and 55°C in the quaternary system in the
presence of i-content of MgCl
2
(i = 10, 20, and 30 g of MgCl
2
/100 g of H
2
O).
Eutonic dots E
20
0
, E
30
0
, E
40
0
, E
45
0
, and E
55
0
and the eutonic line connecting them
designate binary equilibria of both solid NaCl and KCl in MgCl
2
-free solution at
the corresponding temperatures. Eutonic dots E
20
i
and E
55
i
with connecting lines of
equal MgCl
2
concentrations (hereinafter – “eutonic lines”) correspond to binary
equilibria of solid NaCl and KCl at the constant i-content of MgCl
2
and the tem-
peratures ranging from 20°C to 55°C. Lines E
20
0
–E
20
i
, E
30
0
–E
30
i
, E
40
0
–E
40
i
, E
45
0
–E
45
i
,
and E
55
0
–E
55
i
represent isothermal univariant eutonic lines (hereinafter – “isother-
mal lines”) characterizing the shift of eutonic points of NaCl and KCl, obtained at
20, 30, 40, 45, and 55°C, as a function of MgCl
2
content in solution.
The most significant feature of the diagram is distortion of the isoconcentration
(E
20
0
–E
55
0
and E
20
i
–E
55
i
) and isothermal (E
20
0
–E
20
i
and E
55
0
–E
55
i
) eutonic lines.
2.2 Physicochemical Model 73
It can be seen (Fig. 2.8 a) that the eutonic lines have their extremum points at
≈40–45°C. The extremum is a minimum when solution does not contain any
MgCl
2
, and a maximum when MgCl
2
concentration reaches or exceeds 5.28 wt%;
the maxima become more pronounced when MgCl
2
content increases. Thus, the
eutonic line corresponding to 0–5 wt% MgCl
2
concentrations approaches abscissa
when the temperature rises to about 40–45°C and diverts from this axis when the
temperature exceeds the above level (“inverted” and “direct” sections of eutonic
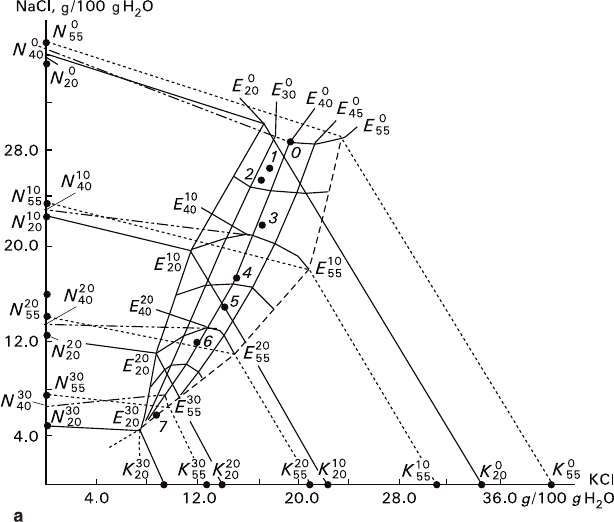
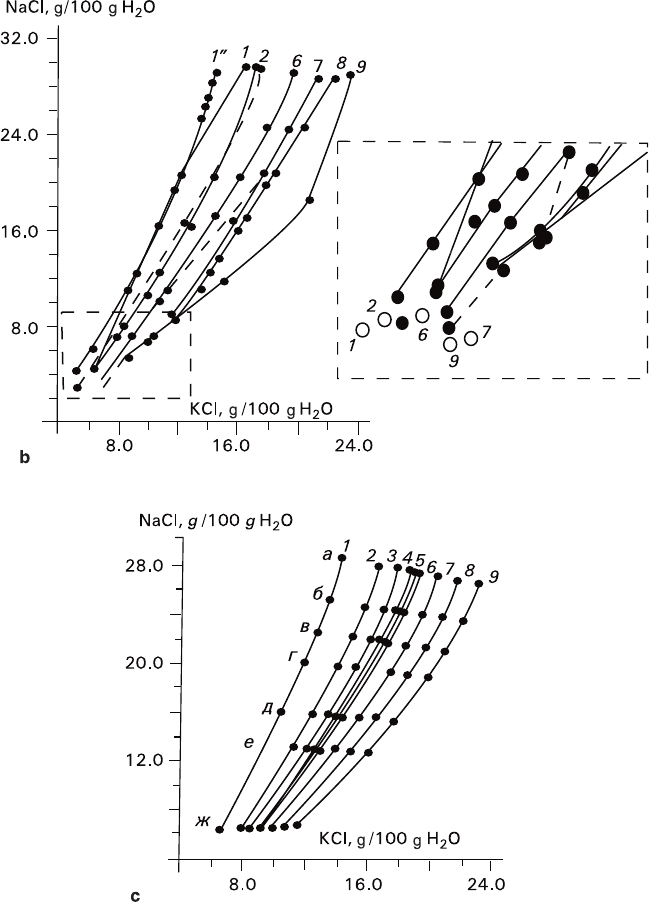
Fig. 2.8 Phase diagram of KCl–NaCl–MgCl
2
–H
2
O system a – According to reported and exper-
imental data; our corrections are represented by dots 0–7. Dash-dotted lines – solubility isotherms
for NaCl at 40°C. E – eutonic points, K – KCl, N – NaCl; superscripts – concentrations of MgCl
2
(wt%), subscripts – temperature (°C). For the other details, see text. b – Reported experimental
data: 1 – 20°C, 2 – 30°C, 3 – 35°C, 4 – 38°C, 5 – 39°C, 6 – 40°C, 7 – 45°C, 8 – 50°C, 9 – 55°C
(MgCl
2
content is in the range of 0–20 wt%). References: 1 and 9 – Kayser 1923 (1˝ – Kayser’s
calculation according to Pitzer’s method for 20°C); 2 – Shestakov and Pelsh 1977: private com-
munication of NE Shestakov (1996) on the data obtained with Pelsh in 1977 (dash line) and unpub-
lished data of 1989 (solid line); 6 – Kurnakov and Osokoreva 1935 and unpublished data of
1987–1989; 7 – Solov’eva et al. 1987 (dotted line) and unpublished data of 1989 (solid line); 8
– Korobkova 1987. Insert: enlarged portion of the diagram containing non-variant point defined by
various authors (hollow circles); unpublished data kindly provided by Dr. S. N. Titkov were
obtained from Research Institute of Mineral-Salt Production c – Isothermal eutonic (univariant) lines
(1–9) calculated according to Pitzer’s method (Cheremnykh and Shestakov 1992). Temperatures
(°C): 1 – 20; 2 – 30; 3 – 35; 4 – 38; 5 – 39; 6 – 40; 7 – 45; 8 – 50; 9 – 55. Concentrations of MgCl
2
(wt%): a – 1.06, b – 3.36, c – 5.28, d – 7.10, e –10.35, f – 12.92, g – 20.01
74 2 Joint Growth of Crystals of Different Phases
Fig. 2.8 (continued)
curve, correspondingly). When MgCl
2
content exceeds about 5 wt%, these sections
switch places (“direct” and “inverted” sections correspond to the temperature
ranges below and above approximately 40°C). “Inverted” eutonic line having no
significant bending is observed when MgCl
2
content is about 5 wt% (≈10 g of
2.2 Physicochemical Model 75
MgCl
2
/100 g of H
2
O). All reported diagrams of this system the author of the present
monograph is aware of (Solubility 1954; Solubility 1979; Processing … 1985;
Buksha and Shestakov 1997) were plotted by simple connecting the eutonic points
obtained at 20 and 50°C with straight lines that correspond to a monotonic shift
from the “invert” eutonic line to the “direct” one with increase of Mg concentration
in the solution.
Also, convexity of E
20
0
–E
20
i
isotherm is directed toward the ordinate, and that of
the E
55
0
–E
55
i
line is directed toward the abscissa (Fig. 2.8a). Isotherms of 30, 40, and
45°C occupy intermediate positions. Extrapolating the converging E
20
0
–E
20
i
and
E
55
0
–E
55
i
isotherms reveals their inversion in point A corresponding to about 22 wt%
of MgCl
2
content (≈30 g of MgCl
2
/100 g of H
2
O). The convergence of isothermal
lines also appears in the diagram plotted according to Pitzer’s method, but in
this case the convergence is insignificant in comparison with our data and the
plotted lines cannot be inverted (Fig. 2.8c: the diagram was plotted by Dr. L.M.
Cheremnykh, Research Institute of Mineral-Salt Production).
The convergence of isothermal lines and their inversion are accompanied by
directional shift of eutonic lines in respect to the directions of the axes. This is
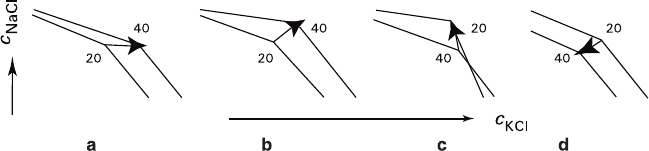
schematically shown in Fig. 2.9. As MgCl
2
concentration increases, orientation of
the eutonic line in temperature range of 20–40°C changes from “inverted,” converg-
ing with abscissa with increase of temperature (Fig. 2.9a, ∼0–5 wt% of MgCl
2
),
to “straight” (Fig. 2.9b, ∼5–22 wt% of MgCl
2
), and then again to “inverted,”
converging, as the temperature rises, with the ordinate axis (Fig. 2.9c; >22 wt% of
MgCl
2
). Subsequent extrapolation assumes a possible transition to the “reversed”
eutonics (Fig. 2.9d). At the same time, in the 40–55°C interval, orientation of
the eutonic line changes in accordance with another scheme: “direct” – “inverted
toward the abscissa” – “reversed.” The new terms mentioned above need explana-
tion. “Eutonics inverted toward the abscissa axis” corresponds to a positive
temperature gradient of KCl solubility and a negative temperature gradient of NaCl
solubility, i.e., as the temperature rises, the equilibrium concentration of KCl
increases, while that of NaCl diminishes. “Direct eutonics” corresponds to positive
solubility temperature gradients for the both substances. “Eutonics inverted toward
the ordinate axis” corresponds to a negative temperature gradient of KCl solubi-
lity and a positive temperature gradient of NaCl solubility. Finally, the “reversed
eutonics” corresponds to negative temperature solubility gradients for the both
substances, i.e., as the temperature rises, the equilibrium concentrations of both
components decrease.
Noteworthy is the fact that at high concentrations of MgCl
2
(above ≈20 wt% of
MgCl
2
, or ≈30 g of MgCl
2
/100 g of H
2
O), both isothermal and isoconcentration
eutonic lines almost merge in the neighborhood of point A (Fig. 2.8a). In particular,
it is typical for the left-wing region of E
20
30
isotherm. It means that in this region
the equilibrium and kinetic properties of the system become irresponsive toward the
minor changes of MgCl
2
content and the solution temperature.
The curved isothermal and isoconcentration eutonic lines plotted above disagree
with the reported data (Figs. 2.8b, c). However, taking into consideration their
compliance with kinetic data (see below) and with our control measurements of
76 2 Joint Growth of Crystals of Different Phases
solubility conducted by means of precision method based upon an isolated seed
observation, we consider our detailing to be rightful. However, we have to point out
a strong disagreement existing among the numerous reported experimental and
calculated solubility data (Kayser 1923; Kurnakov and Osokoreva 1935; Solubility
1954, 1979; Processing… 1985; Korobkova 1987; Solov’eva et al. 1987; Zdanovskii
1990; Cheremnykh and Shestakov 1992) especially obtained in the presence of high
concentrations of magnesium chloride in the solutions (see insert in Fig. 2.8b).
2.2.2 Kinetic Effects and Peculiarities of Phase Equilibria
The plotted phase diagram allows to explain some unusual stages of NaCl dissolu-
tion in supercooled ternary solutions occurring under conditions of abrupt kinetic
instability (Fig. 2.6). It can also help to understand the existence of nonmonotonous
changes in crystal growth rates induced by variation of the solution composition,
and by influence of MgCl
2
content (Fig. 2.7) upon both the phases and effect of
dissolved NaCl on the growth of KCl crystals (Fig. 2.5).
Morphological peculiarities of KCl and NaCl crystals and nucleation and subse-
quent growth of the partner-phase crystals directly on the seed surface indicates a
significant diffusion limitation of crystallization processes. This conclusion can be
further proved by formation of carnallite crystals on the seed surfaces, which occurs
far outside the carnallite thermodynamic stability domain. The above statement
also means that diffusion layer around the crystal can be considered as an area
relatively isolated from the rest of the solution, and concentration variations in
the solution caused by crystal growth/dissolving can be attributed mainly to the
influence of the diffusion layer. Due to a relatively great volume of crystallization
cell, the net composition of the solution changes insignificantly during the experi-
ment; so, the above conclusion is very important in crystallogenic analysis of the
mutual phase influence.
At first it is necessary to consider an equilibrium process that escaped our inves-
tigation before (Fig. 2.10a). When using an excess of both solid phases in hetero-
geneous KCl–NaCl–H
2
O system, change in temperature in proximity of 40°C, i.e.,
Fig. 2.9 Shift of the eutonic line between the KCl and NaCl regions with increase of MgCl
2
concentration (a–d) at the temperatures ranging from 20°C to 40°C resulting in transition from
positive temperature gradients to negative ones (schematic representation)
2.2 Physicochemical Model 77
within the “inverted” eutonic area, is usually characterized by conjugated growth
and dissolution of KCl and NaCl crystals (Glikin 1996a). For example, lowering the
temperature of the solution saturated at E
40
results in shifting the trajectory of equi-
librium composition toward E
38
that corresponds to dissolution of NaCl and growth
of KCl. Raising the temperature of the solution saturated at E
38
reverses direction
of the trajectory and thus a correlation between the growth and dissolution proc-
esses. The obvious conclusion about NaCl dissolution at lowering temperature
seems at least peculiar given the fact that the figurative point of the solution con-
cerned lies within the area of the both phase supersaturation domain circumscribed
by xE
40
y lines. Similarly uncommon is the conclusion about NaCl growth at the
rising temperature, when the solution is undersaturated with both phases (the
region circumscribed by x
*
E
38
y
*
lines).
The isolated seed behaviour in homogenous solution has a number of peculiari-
ties (Figs. 2.10b, c).
Dissolution of NaCl crystals in supercooled eutonic solutions and kinetic insta-
bility of both phase seeds observed in the absence and at a low MgCl
2
concentration
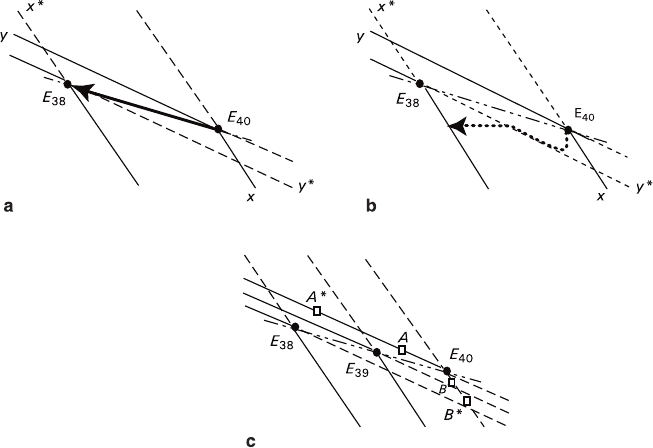
Fig. 2.10 Illustration for physicochemical interpretation of crystal behavior in eutonic KCl–
NaCl–H
2
O solutions at a lowering temperature E – Eutonic points for 38°C, 39°C, and 40°C,
dash-dotted lines – eutonic lines, solid lines – stable equilibrium isotherms, dash lines – continuation
of the isotherms toward the metastable region, solid and dotted arrows – trajectories of the solution
compositions during crystallization. a – Excesses of both crystalline phases b – An isolated seed
in a homogenous solution c – Supercooled solution state in the region of the concentration
deviation from the eutonic point
78 2 Joint Growth of Crystals of Different Phases
are probably of common origin. In our opinion, the above phenomena occur due
to inhomogeneous accumulation of MgCl
2
and the partner-substance in the diffu-
sion layer formed around the seed and owing to uncontrollable crystallization of
both partner-substance and carnallite on the seed surface. Alterations in composition
of the diffusion layer, which has a very small volume, occur spontaneously and
rapidly that results in fluctuations of the growth rate registered in kinematical
curves (Fig. 2.6).
Figure 2.10b shows a hypothetic change of the solution composition in the dif-
fusion layer around a point-like seed of NaCl occurring in the course of transition
from E
40
to E
38
dot (ΔT = 2°C). In the beginning the seed starts to grow; this leads
to depletion of the solution in sodium chloride that is shown by the trajectory seg-
ment, which is parallel to the ordinate axis. When the trajectory approaches E
38
y
*
boundary (metastable equilibrium for NaCl), the growth of the seed is slowing
down and KCl accumulated in the diffusion layer reaches its labile state and starts
precipitating on the seed. As a result, the trajectory bends (slowing down NaCl
growth) and then, due to impossibility of crossing the metastable equilibrium line,
takes a direction proceeding along this line toward E
38
point. This process corre-
sponds to the stage of NaCl dissolution and KCl growth. As NaCl concentration in
the solution is limited, the trajectory reaches the level of initial NaCl concentration
and then goes toward the 38°C isotherm, being parallel to the abscissa axis. Stages
of NaCl seed growth characterized by lowering the growth rate and starting the
dissolution can be matched with corresponding segments of kinematical curve B
shown in Fig. 2.6b. It is possible to trace the potential trajectories of figurative
points in kinematical curves of various types and correlate them with the processes
occurring in the diffusion layers.
At least at the first steps of the experiment a probability for dissolution to occur
decreases with increasing the supercooling degree. If supercooling is quite pro-
nounced, nucleation of KCl crystals occurs in the region, which is sufficiently
remote from the line of NaCl metastable equilibrium, so the tendency for the trajec-
tory to reverse its direction (NaCl dissolution) appears to be slowed down. This
phenomenon can be considered as one of the reasons for scarcity of the reported
experiments in which it was possible to register dissolution phases when changing
from the series with ΔT = 1°C to the series with ΔT = 2°C.
Such deviation of solution composition from the eutonic concentrations resulting
from the metastable growth of one of the phases makes undersaturation exist only
for NaCl phase, while for KCl phase it proves to be impossible due to the diagram
asymmetry. Growth of KCl seeds is represented by the trajectory that is parallel to
the abscissa. Precipitation of NaCl crystals followed by their dissolution when the
trajectory crosses the metastable segment of E
38
y
*
isotherm causes the trajectory to
bend toward the abscissa (as in the case of NaCl seeds), but would not result in
dissolution of KCl seeds.
The above considerations explain the presence of dissolution stages in NaCl
growth process and their absence in transformations of KCl seeds. Since binary
equilibrium E
38
is inaccessible for any of the seeds, the solution remains undersatu-
rated with NaCl.
2.2 Physicochemical Model 79
Thus, dissolution of crystals in supercooled ternary and, obviously, more com-
plex solutions, depends upon differences between the solution composition and the
eutonic concentrations of its components.
Of course, the crystals can dissolve due to a simple mistake made in the course
of solution preparation (like in binary systems). In such a case a greater supercool-
ing compensates the deviation, and the greater is the deviation, the deeper must be
the supercooling applied to initiate the crystal growth. It can be seen (Fig. 2.10c)
that figurative points A and B located at some distance from eutonic point E
40
fall
into the supersaturated solution domain at ΔT = 1°C, whereas the points A
*
and B
*
positioned at a greater distance from the eutonics appear in the supersaturated
domain at ΔT = 2°C. However, dissolution initiated by a preparative mistake must
become apparent in the very beginning of the experiment and persist all the way
though it, showing in both NaCl and KCl transformations. In our experiments, dis-
solution processes were observed at different stages of the experiments and they
were quite unstable (Fig. 2.6). Besides, KCl seeds did not tend to dissolve at all.
Thus, the observed stages of NaCl dissolution are most likely related to the kinetic
processes discussed above.
Nonmonotonous dependence of KCl and NaCl growth rates v on MgCl
2
concen-
tration in the solution (Fig. 2.7) is determined by configurations of isoconcentration
and isothermal eutonic lines. Values of supersaturation Δc/c calculated at constant
supercooling degree for KCl and NaCl in accordance with configuration of the
eutonic lines reveal similar nonmonotonous dependence of supersaturation upon
MgCl
2
content in the solution (Fig. 2.11).
Nonmonotonous character of the growth rates (Fig. 2.7) is characterized by
small absolute values of Δc/c and v at various concentrations of MgCl
2
, either low
or high, and by high absolute values of these parameters at medium MgCl
2
concen-
trations. Dissolving KCl and NaCl in solutions containing considerable amounts of
MgCl
2
at 2.0°C of supercooling confirms inversion of the eutonic lines predicted by
extrapolation of E
20
0
–E
20
i
and E
55
0
–E
55
i
curves and the presence of a region contain-
ing the “reversed” eutonic line. The position of the inversion point (≈22 wt% of
MgCl
2
) is proved by kinetic data. The fact that the both phases dissolve slowly at
ΔT = 2.0°C, but grow slowly at ΔT = 1.0°C can possibly indicate a transition from
the “direct” eutonic area to the “reversed” one and emphasize a narrowness of the
intermediate area that is “directed toward the ordinate.” Explanation of the mutual
locations of Δc/c and v maxima along MgCl
2
-concentration axis and their relative
widths (Figs. 2.7 and 2.11) cannot be made at present state of knowledge and
requires further physicochemical adjustment of the phase diagram and acquiring
additional kinetic data.
For the solutions containing high concentrations of MgCl
2
(>12 wt%), the iso-
thermal eutonic lines almost merge that makes experimental determination of c and
Δc exact values difficult; at any rate, under these conditions supersaturation/under-
saturation in the solutions supercooled by 1.0 and 2.0°C cannot reach the point
where growth/dissolution becomes observable that corresponds to zero growth rates
(Fig. 2.7).