Harris C.M., Piersol A.G. Harris Shock and vibration handbook
Подождите немного. Документ загружается.


36. Babbit, R. O.: “The Vanderbilt Rubber Handbook,” Vanderbilt Company, Norwalk, Conn.,
1978.
37. Bartenev, G. M., and Y. S. Zuyev: “Strength and Failure of Viscoelastic Materials,” Perga-
mon Press, New York, 1968.
38. Gent, A. N.: “Engineering with Rubber,” Hanser Publishers, New York, 1992.
33.18 CHAPTER THIRTY-THREE
8434_Harris_33_b.qxd 09/20/2001 12:30 PM Page 33.18

CHAPTER 34
ENGINEERING PROPERTIES
OF METALS
James E. Stallmeyer
INTRODUCTION
The design of equipment to withstand shock and vibration requires (1) a determina-
tion of the loads and resultant stresses acting on the equipment, and (2) the selection
of a suitable material. The loads and stresses may be determined from an appropri-
ate model of the equipment as described in Chap. 41. This chapter describes some of
the considerations required to adapt the results from the model analysis to the selec-
tion of suitable materials, including such engineering properties as the stress-strain
properties of metals and metal fatigue.
The selection of an appropriate material often involves an evaluation of the types
of stress condition to which the equipment will be subjected. If a small number of
severe stresses constitute the most critical situation, the most important considera-
tion is to design the equipment for adequate strength. For equipment that will be
subjected to sustained vibration or a large number of repeated applications of a
load, fatigue strength is likely to be the critical design parameter.The relative impor-
tance of these types of loading must be determined for each application.
When strength is the primary design factor, an appropriate balance between
stress and ductility is the most important consideration. Analytical models gener-
ally indicate the maximum stress based on linear properties of the material. If non-
ductile materials are used or if permanent deformation cannot be tolerated, the
equipment must be designed in such a way that the stress does not exceed the elas-
tic limit of the material. In some cases, permanent deformation may not be accept-
able because it would cause misalignment of parts whose proper operation depends
on accurate alignment. In other cases, permanent deformation of some structural
members may be acceptable. Several empirical procedures have been developed
for these cases.
One procedure, for members subjected to bending, is to permit some predeter-
mined percentage of the cross section to yield. Ductility of the material is required
for this procedure. The permanent deformation of the member, after the load has
been removed, will be less than the maximum deflection because the core of an elas-
tic material tends to restore the member to its original shape. This procedure is not
34.1
8434_Harris_34_b.qxd 09/20/2001 12:30 PM Page 34.1
easily adapted to members subjected to loading other than bending.Another proce-
dure establishes a maximum allowable stress equal to the yield point plus some
incremental percentage of the difference between the yield point and the ultimate
strength of the material. As the incremental percentage increases, the magnitude of
permanent deformation increases. Consequently, the magnitude of the incremental
percentage will depend upon the function of the particular member and the ability
to make adjustments or repairs. For bolts which are inaccessible for retightening, the
increment is generally zero. In cases where dimensional stability is important, but
some yielding can be tolerated, only a small percentage increment may be permissi-
ble. When significant yielding can be tolerated, the increment may be as much as 50
percent. For bearing surfaces or where permanent deformation is permissible, the
ultimate strength of the material may be used for design.
Design of equipment subject to vibration or repeated load applications requires a
more detailed evaluation of the stress versus time response for the life of the structure.
Three fatigue analysis procedures are available: the stress-life method, the strain-life
method, and the fracture-mechanics method. Which of the three procedures is applica-
ble will depend on the stress-time history. Knowledge of all three methods allows the
engineer to choose the most appropriate method for the specific application.
STRESS-STRAIN PROPERTIES
STATIC PROPERTIES
The important static properties are yield strength, ultimate tensile strength, elonga-
tion at failure, and reduction of area. A standard tensile test specimen, defined by
ASTM Specification A370,
1
is used to evaluate these properties. The rate of loading
and the procedure for evaluation of properties are defined in the specification.
Under dynamic loading the yield strength and the ultimate strength depend upon
the strain rate, which in turn depends upon the geometry of the structure and the
type of loading. Dynamic properties are not standardized easily. There is little infor-
mation about these properties for the wide range of available metals.
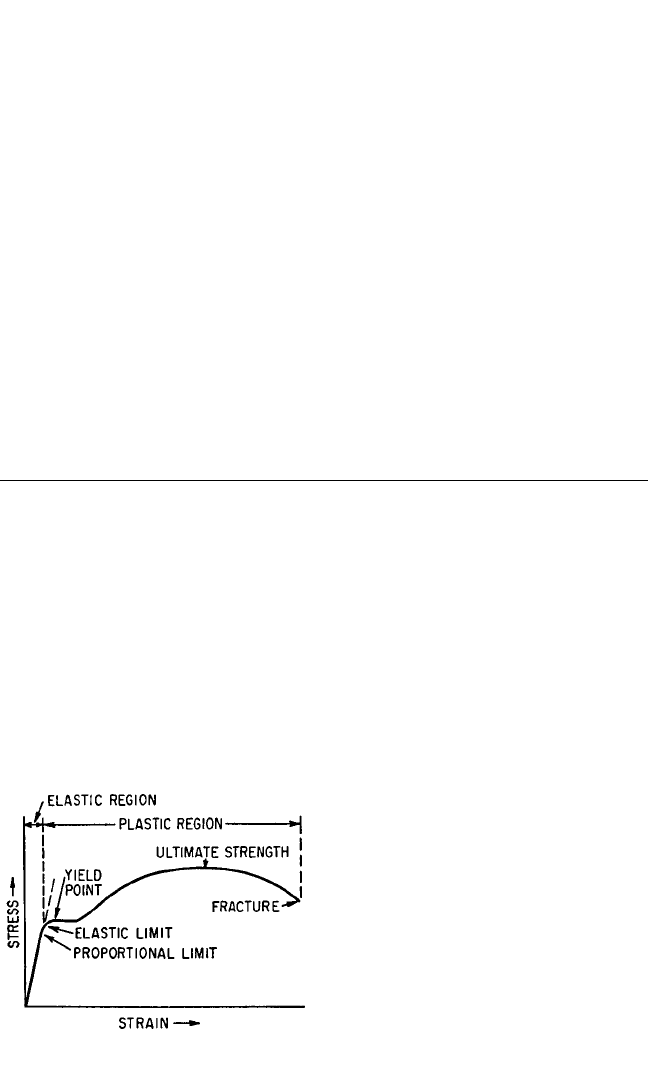
The standard tensile test provides a plot of stress versus strain from which many
of the mechanical properties may be
obtained. A typical stress-strain curve is
presented in Fig. 34.1. For materials
which are linearly elastic, the elongation
e is directly proportional to the length of
the test bar l and the stress σ. The pro-
portionality constant is called the modu-
lus of elasticity E. The plot of stress
versus strain usually deviates from lin-
ear behavior at the proportional limit,
which depends on the sensitivity of the
instrumentation. Most metals can be
stressed slightly higher than the propor-
tional limit without showing permanent
deformation upon removal of the load.
This point is referred to as the elastic
limit. Mild steels exhibit a distinct yield
point, at which permanent deformation
34.2 CHAPTER THIRTY-FOUR
FIGURE 34.1 Typical stress-strain diagram
for a metal with a yield point.
8434_Harris_34_b.qxd 09/20/2001 12:30 PM Page 34.2

begins suddenly and continues with no increase in stress. For materials which exhibit
a nonlinear stress-strain relationship, the term yield strength is generally used. The
yield strength of a material is that stress which produces, on unloading, a permanent
strain of 0.002 in./in. (0.2 percent).
Beyond the yield strength, large permanent deformations occur at a reduced
modulus, the strain-hardening modulus. The strain-hardening modulus decreases at
increasing loads until the cross-sectional area of the test bar begins to decrease,
necking, at the ultimate load. Beyond this point further extension takes place with
decreasing force. This ability of the material to flow without immediate rupture is
called ductility, which is defined as the percent reduction of cross-sectional area
measured at the section of fracture.Another measure of ductility is the percent elon-
gation of the gage length. This value depends on the shape and size of the specimen
and the gage length.
Other static properties of materials find application in the design of equipment to
withstand shock and vibration. The modulus of rigidity G is the ratio of shear stress
to shear strain; it may be determined from the torsional stiffness of a thin-walled
tube of the material.The value of G for steel is 12 × 10
6
lb/in.
2
. Poisson’s ratio ν is the
ratio of the lateral unit strain to the normal unit strain in the elastic range of the
material. This ratio evaluates the deformation of a material that occurs perpendicu-
lar to the direction of application of load. The value of ν for steel is 0.3. More com-
plete data on materials and their properties as used in machine and equipment
design are compiled in available references.
2–4
Values of the static properties of typ-
ical engineering materials are given in Tables 34.1 to 34.3. (All values of σ, G, and E
in these and later tables may be converted to SI units by MPa = 145 lb/in.
2
.)
ENGINEERING PROPERTIES OF METALS 34.3
TABLE 34.1 Mechanical Properties of Typical Cast Irons (A. Vallance and V. Doughtie.
2
)
Endur-
ance
Ultimate strength
limit in
Modulus of elasticity
Elon-
Ten- Com- reversed Brinell Tension gation
sion, pression, bending hard- and Shear in
lb/in.
2
, lb/in.
2
, lb/in.
2
, ness compression, lb/in.
2
, 2 in.,
Material σ
u
† σ
u
σ
e
number lb/in.
2
, EG%
Gray, ordinary 18,000 80,000 9,000 100–150 10–12,000,000 4,000,000 0–1
Gray, good* 24,000 100,000 12,000 100–150 12,000,000 4,800,000 0–1
16,000
Gray, high grade 30,000 120,000 15,000 100–150 14,000,000 5,600,000 0–1
Malleable, S.A.E. 32510 50,000 120,000 25,000 100–145 23,000,000 9,200,000 10
Nickel alloys:
Ni-0.75, C-3.40, Si-1.75, 32,000 120,000 16,000 200 15,000,000 6,000,000 1–2
Mn-0.55* 24,000 175
Ni-2.00, C-3.00, Si-1.10, 40,000 155,000 20,000 220 20,000,000 8,000,000 1–2
Mn-0.80* 31,000 200
Nickel-chromium alloys:
Ni-0.75, Cr-0.30, C-3.40, 32,000 125,000 16,000 200 15,000,000 6,000,000 1–2
Si-1.90, Mn-0.65
Ni-2.75, Cr-0.80, C-3.00, 45,000 160,000 22,000 300 20,000,000 8,000,000 1–2
Si-1.25, Mn -0.60
* Upper figures refer to arbitration test bars. Lower figures refer to the center of 4-in. round specimens.
†
Flexure: For cast irons in bending, the modulus of rupture may be taken as 1.75 σ
u
(tension) for circular sec-
tions, 1.50 σ
u
for rectangular sections and 1.25 σ
u
for I and T sections.
8434_Harris_34_b.qxd 09/20/2001 12:30 PM Page 34.3

TEMPERATURE AND STRAIN-RATE EFFECTS
The static properties of most engineering materials depend upon the testing tem-
perature. As the testing temperature is increased above room temperature, the yield
point, ultimate strength, and modulus of elasticity decrease. For example, the yield
point of structural carbon steel is about 90 percent of the room-temperature value at
400°F (204°C), 60 percent at 800°F (427°C), 50 percent at 1000°F (538°C), 20 percent
at 1300°F (704°C), and 10 percent at 1600°F (871°C).The corresponding changes for
ultimate strength are 100 percent of the room-temperature value at 400°F, 85 per-
cent at 800°F, 50 percent at 1000°F, 15 percent at 1300°F, and 10 percent at 1600°F.
Changes in the modulus of elasticity are 95 percent of the room-temperature value
at 400°F, 85 percent at 800°F, 80 percent at 1000°F, 70 percent at 1300°F, and 50 per-
cent at 1600°F. As a result of these changes in properties, the ductility is increased
significantly.
When materials are tested in temperature ranges where creep of the material
occurs, the creep strains will contribute to the inelastic deformation. The magnitude
of the creep strain increases as the speed of the test decreases. Consequently, tests at
elevated temperatures should be conducted at a constant strain rate, and the value
34.4 CHAPTER THIRTY-FOUR
TABLE 34.2 Mechanical Properties of Typical Carbon Steels (A. Vallance and V. Doughtie.
2
)
Yield strength
Ten- Endur-
sion ance
and limit
Modulus of elasticity
Ultimate strength
com- in re- Tension Elon-
Ten- pres- versed Brinell and com- ga-
sion, Shear, sion, Shear, bending hard- pression, Shear, tion
lb/in.
2
, lb/in.
2
, lb/in.
2
, lb/in.
2
, lb/in.
2
, ness lb/in.
2
, lb/in.
2
, 2 in.,
Material σ
u
σ
u
σ
y
σ
y
σ
e
number EG%
Wrought iron 48,000 50,000 27,000 30,000 25,000 100 28,000,000 11,200,000 30–40
Cast steel:
Soft 60,000 42,000 27,000 16,000 26,000 110 30,000,000 12,000,000 22
Medium 70,000 49,000 31,500 19,000 30,000 120 30,000,000 12,000,000 18
Hard 80,000 56,000 36,000 21,000 34,000 130 30,000,000 12,000,000 15
SAE 1025:
Annealed 67,000 41,000 34,000 20,000 29,000 120 30,000,000 12,000,000 26
Water-quenched* 78,000 55,000 41,000 24,000 43,000 159 30,000,000 12,000,000 35
90,000 63,000 58,000 34,000 50,000 183 27
SAE 1045:
Annealed 85,000 60,000 45,000 26,000 42,000 140 30,000,000 12,000,000 20
Water-quenched* 95,000 67,000 60,000 35,000 53,000 197 30,000,000 12,000,000 28
120,000 84,000 90,000 52,000 67,000 248 15
Oil-quenched* 96,000 67,000 62,000 35,000 53,000 192 30,000,000 12,000,000 22
115,000 80,000 80,000 45,000 65,000 235 16
SAE 1095:
Annealed 110,000 75,000 55,000 33,000 52,000 200 30,000,000 12,000,000 20
Oil-quenched* 130,000 85,000 66,000 39,000 68,000 300 30,000,000 11,500,000 16
188,000 120,000 130,000 75,000 100,000 380 10
* Upper figures: steel quenched and drawn to 1300°F. Lower figures: steel quenched and drawn to 800°F.
Values for intermediate drawing temperatures may be approximated by direct interpolation.
8434_Harris_34_b.qxd 09/20/2001 12:30 PM Page 34.4

ENGINEERING PROPERTIES OF METALS 34.5
TABLE 34.3 Mechanical Properties of Copper-Zinc Alloys (Brass)
(A. Vallance and V. Doughtie
2
)
Modulus of
elasticity
Elon-
Ultimate Yield
Brinell Tension gation
strength strength
Endurance hard- and com- in
Tension, Tension, limit, ness pression, 2 in.,
Type of material lb/in.
2
, σ
u
lb/in.
2
, σ
e
lb/in.
2
, σ
e
number lb/in.
2
, E %
Commercial bronze
(90 Cu, 10 Zn):
Rolled, hard 65,000 63,000 18,000 107 15,000,000 18
Rolled, soft 35,000 11,000 12,000 52 15,000,000 56
Forged, cold 40,000–65,000 25,000–61,000 12,000–16,000 62–102 15,000,000 55–20
Red brass
(85 Cu, 15 Zn):
Rolled, hard 75,000 72,000 20,000 126 15,000,000 18
Rolled, soft 37,000 14,000 14,000 54 15,000,000 55
Forged, cold 42,000–62,000 22,000–54,000 14,000–18,000 63–120 15,000,000 47–20
Low brass
(80 Cu, 20 Zn):
Rolled, hard 75,000 59,000 22,000 130 15,000,000 18
Rolled, soft 44,000 12,000 15,000 56 15,000,000 65
Forged, cold 47,000–80,000 20,000–65,000 63–133 15,000,000 30–15
Spring brass
(75 Cu, 25 Zn):
Hard 84,000 64,000 21,000 107* 14,000,000 5
Soft 45,000 17,000 17,000 57* 18,000,000 58
Cartridge brass
(70 Cu, 30 Zn):
Rolled, hard 100,000 75,000 22,000 154 15,000,000 14
Rolled, soft 48,000 30,000 17,000 70 15,000,000 55
Deep-drawing brass
(68 Cu, 32 Zn):
Strip, hard 85,000 79,000 21,000 106* 15,000,000 3
Strip, soft 45,000 11,000 17,000 13* 15,000,000 55
Muntz metal
(60 Cu, 40 Zn):
Rolled, hard 80,000 66,000 25,000 151 15,000,000 20
Rolled, soft 52,000 22,000 21,000 82 15,000,000 48
Tobin bronze
(60 Cu, 39.25 Zn, 0.75 Sn):
Hard 63,000 35,000 21,000 165 15,000,000 35
Soft 56,000 22,000 90 15,000,000 45
Manganese bronze
(58 Cu, 40 Zn):
Hard 75,000 45,000 20,000 110 15,000,000 20
Soft 60,000 30,000 16,000 90 15,000,000 30
* Rockwell hardness F.
8434_Harris_34_b.qxd 09/20/2001 12:30 PM Page 34.5
used should be reported along with the results. Creep strains may be significant at
room temperature for materials with low melting temperatures.
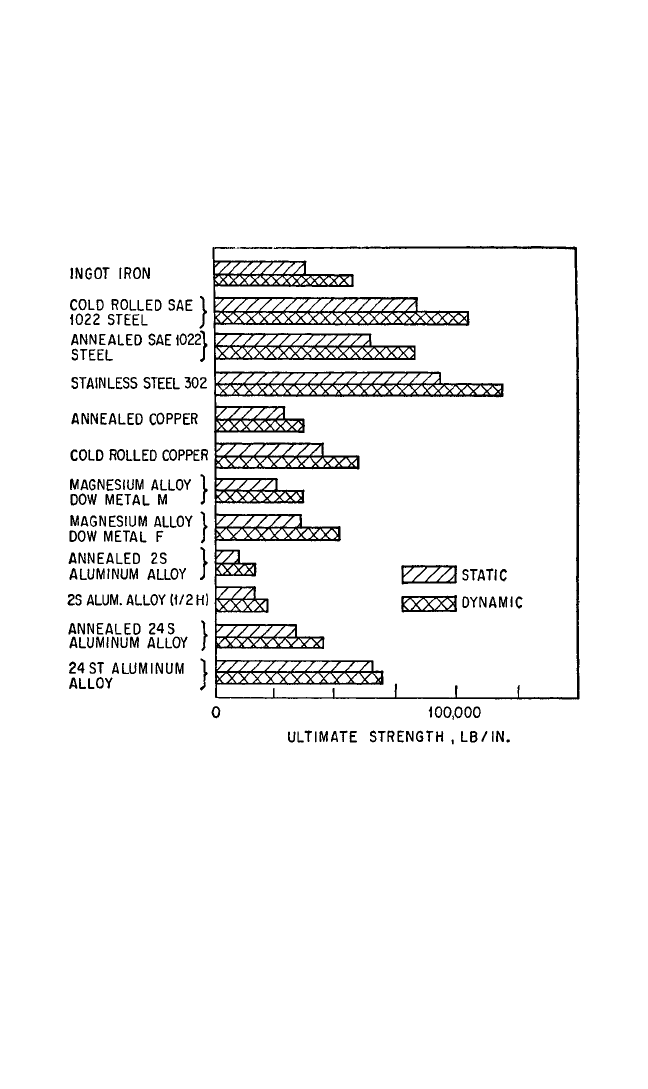
The yield strength and the ultimate strength of certain metals, as well as the
entire stress level of the stress-strain curve, are increased when the rate of deforma-
tion is increased. Figure 34.2 presents information on the static and dynamic values
of the ultimate strength of several metals when the dynamic strength is determined
at impact velocities of 200 to 2500 ft/sec (60 to 76 m/s).
5
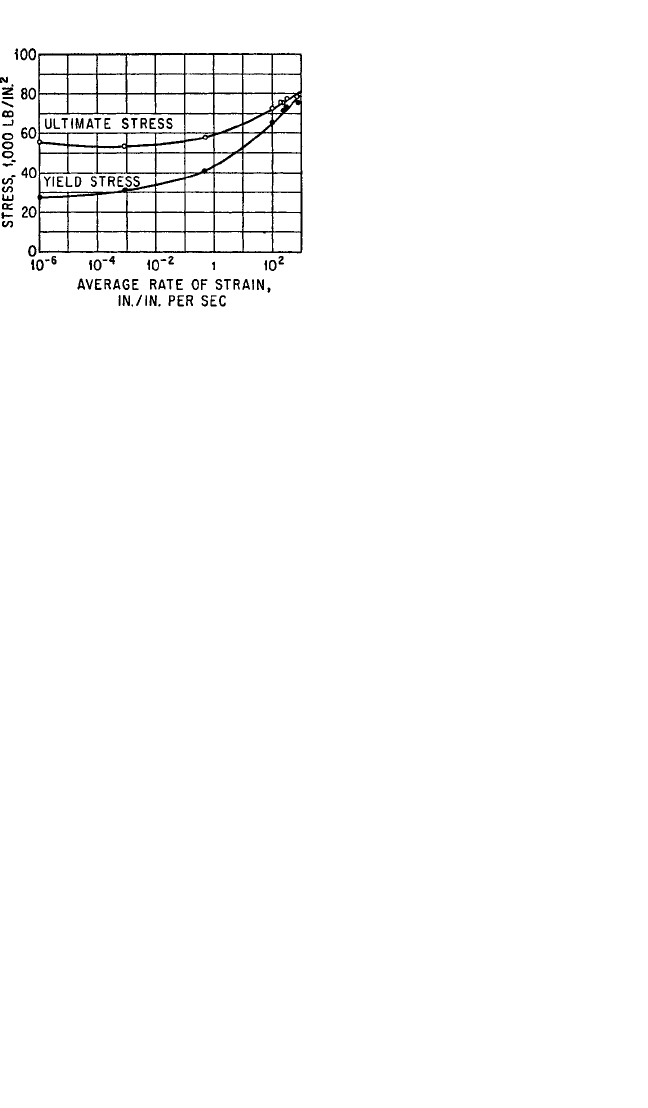
The influence of strain rate
on the tensile properties of mild steel at room temperature is shown in Fig. 34.3. The
marked difference between the yield stress and ultimate stress at low rates of strain
disappears at high rates of strain.
6
Figure 34.3 also shows that the ultimate stress
remains practically unchanged for strain rates below 1 in./in./sec. In this limited
range the stress-strain curve of most engineering metals is not raised appreciably.
7
Mild steel is an exception in which the yield stress in influenced markedly by strain
rate in the range from 0 to 1 in./in./sec.
Although the yield strength and ultimate strength of mild steel show an increase
as the rate of strain increases, as illustrated in Fig. 34.3, this effect is of very limited
significance in the design of equipment to withstand shock and vibration. In general,
a strain rate great enough to cause a significant increase in strength occurs only
34.6 CHAPTER THIRTY-FOUR
FIGURE 34.2 Static and dynamic values of the ultimate strength of several
metals when the dynamic strengths were obtained at impact velocities of 200 to
250 ft/sec. (D. S. Clark and D. S. Wood.
5
)
8434_Harris_34_b.qxd 09/20/2001 12:30 PM Page 34.6
closely adjacent to a source of shock, as
at the point of impact of a projectile on
armor plate. Equipment seldom is sub-
jected to shock of this nature. In a typi-
cal installation, the structure interposed
between the equipment and the source
of shock is unable to transmit large
forces suddenly enough to cause high
strain rates at the equipment. Further-
more, the response of a structure to a
shock is oscillatory; maximum strain
rate occurs at zero strain, and vice
versa. The data of Fig. 34.3 represent
conditions where maximum stress and
maximum rate of strain occur simultane-
ously; thus, they do not apply directly to
the design of shock-resistant equipment.
The use of statically determined yield
strength and ultimate strength for design purposes is a conservative (but not overly
conservative) practice.
TOUGHNESS AND DUCTILITY
It is useful to evaluate the total energy needed to fracture a test bar under tension;
this energy is a measure of the toughness of the material. The area under the typical
stress-strain diagram shown in Fig. 34.1 gives an approximate measure of the fracture
energy per unit volume of material. However, the true fracture energy depends upon
the true stress and true strain characteristics, which take into account the nonuniform
strain resulting from the reduction of area upon necking of the test bar. Calculated
values of the fracture energy for various metals are given in Table 34.4. Tough mate-
rials (e.g., wrought iron and low- or medium-carbon steel) exhibit high unit elonga-
tion and are considered to be ductile. By contrast, cast iron exhibits practically no
elongation and is considered to be brittle. If only the elastic strain energy up to the
proportional limit is included, the resulting stored energy per unit volume is called
the modulus of resilience. Values of this property are also given in Table 34.4.
CRITICAL STRAIN VELOCITY
When a large load is applied to a structure very suddenly, failure of the structure
may occur with a relatively small overall elongation. This has been interpreted as a
brittle fracture, and it has been said that a material loses its ductility at high strain
rates. However, an examination of the failure shows normal ductility (necking) in a
region close to the application of load. Large stresses are developed in this region by
the inertia of the material remote from the application of the load, and failure occurs
before the plastic stress waves are transmitted away from the point of load applica-
tion. This effect is important only where loads are applied very suddenly, as in a
direct hit by a projectile on armor plate. In general, equipment is mounted upon
structures that are protected from direct hits; the resilience of such structures pre-
vents a sufficiently rapid application of load for the above effect to be of significance
in the design of equipment.
ENGINEERING PROPERTIES OF METALS 34.7
FIGURE 34.3 Effect of strain rate on mechan-
ical properties of mild steel. (M. J. Manjoine.
6
)
8434_Harris_34_b.qxd 09/20/2001 12:30 PM Page 34.7

DELAYED INITIATION OF YIELD
Sudden application of load may not immediately result in yielding of a structure
made of ductile material. Rather, yielding may occur after some time delay. This
delay in initiation of yield is a function of the material, stress level, rate of load appli-
cation, and temperature. Consequently, a material may be stressed substantially
above its yield strength for a short period of time without yielding. For mild steel at
room temperature, the delay time is of the order of 0.001 sec. For repeated applica-
tions of load, the material has a memory; i.e., the durations of load are additive to
determine the time of yielding. Equipment subjected to shock or vibration experi-
ences an oscillatory stress pattern wherein the higher stresses occur repeatedly. The
durations of these stresses quickly add up to a time greater than the delay time for
common materials; thus, the effect is of little significance in the design of equipment
to withstand shock and vibration.
FATIGUE
The strength properties discussed up to this point are important to ensure structural
integrity in the event of a single application of severe loading. Most structures, how-
ever, will be subjected to many applications of loads that may be considerably below
the static-load capacity of the member or structure. Under such circumstances, local-
ized permanent changes in the material may lead to the initiation of small cracks,
which propagate under subsequent applications of cyclic load. Cracks may initiate
from crystal imperfections, dislocations, microcracks, lack of penetration, porosity,
etc.The rate of propagation increases as the crack grows in size. If the crack becomes
sufficiently large, the static load capacity of the member may be exceeded, resulting
in a ductile failure. If a critical crack length is reached, the member may fail by brit-
tle fracture at some stress significantly below the ultimate strength of the material.
The critical crack length is a function of stress level, temperature, and material prop-
erties.A comprehensive discussion of the factors which contribute to brittle fracture
can be found in Ref. 11.
34.8 CHAPTER THIRTY-FOUR
TABLE 34.4 Fracture Energy or Toughness of Different Materials (J. M. Lessells.
8
)
Toughness
Yield Tensile Unit elon- or fracture Modulus of
strength, strength, gation, energy, resilience,
Material Condition lb/in.
2
, σ
y
lb/in.
2
, σ
u
in./in., in.-lb/in.
3
in.-lb/in.
3
Wrought iron As received 24,000 47,000 0.50 17,700 7
Steel (0.13% C) As received 26,000 54,000 0.44 17,600 11
Steel (0.25% C) As received 44,000 76,000 0.36 21,600 24
Steel (0.53% C) Oil-quenched 86,000 134,000 0.11 12,000 100
and drawn
Steel (1.2% C) Oil-quenched 130,000 180,000 0.09 10,800 280
and drawn
Steel (spring) Oil-quenched 140,000 220,000 0.03 4,400 320
and drawn
Cast iron As received . . . 20,000 0.005 70 1
Nickel cast iron As received 20,000 50,000 0.10 3,500 9
Rolled bronze As received 40,000 65,000 0.20 10,500 60
Duralumin Forged and 30,000 52,000 0.25 10,200 17
heat-treated
8434_Harris_34_b.qxd 09/20/2001 12:30 PM Page 34.8

Fatigue behavior is affected by a variety of factors. Some of the more important
parameters which influence the fatigue response are the properties of the material,
rate of cyclic loading, stress magnitude, residual stresses, size effect, geometry, and
prior strain history. The basic parameters in fatigue tests are the stress level and the
number of cycles to failure. The effects of other parameters are studied by evaluat-
ing the changes which occur in the relationship between stress and cycles to failure
as these parameters are introduced.
The tensile properties of a material serve as a guide in selecting materials. They
are used quantitatively to proportion members to resist static loading. There is no
equivalent set of fatigue properties available to the designer whose structure must
resist cyclic loading. Fatigue theories attempt to relate stress-strain properties to
fatigue behavior, but complexities which arise during fatigue have thwarted these
attempts. The design of equipment to resist repetitive load cycles is based on empir-
ical data or on the application of crack propagation laws.
Fatigue tests are conducted by subjecting a test specimen to a stress pattern in
which the stress varies with time. The test specimen may be subjected to alternating
bending stress, as in the case of the rotating beam specimen, or to alternating axial
stress. Most fatigue tests are conducted under conditions in which the stress varies
sinusoidally with time. However, the use of servo-controlled hydraulic testing
machines permits the variation of stress with time to follow any desired pattern.Tests
may be carried out under alternating tension and compression, alternating torsion,
alternating tension superimposed upon cyclic alternating tension, and many others.
Most fatigue data available in the literature have been obtained from tests which
involve cycling between maximum and minimum stress levels of constant value.
These are referred to as constant-amplitude tests. Parameters of interest are the stress
range, ∆σ; and the average of the maximum and minimum stress in the stress range,
σ
m
. One-half the stress range is called the stress amplitude, σ
a
.The mathematical for-
mulations for these basic definitions are
∆σ = σ
max
−σ
min
(34.1)
σ
m
= (34.2)
σ
a
= (34.3)
The ratio σ
max
/σ
min
is referred to as the stress ratio, R, and the ratio between σ
a
and
σ
m
is referred to as the amplitude ratio,A. Completely reversed stressing describes the
case in which σ
m
= 0, for which R =−1. The term zero-to-tension stressing is applied
to the case in which σ
min
= 0, and hence R = 0.
Most fatigue data are presented in the form of a stress (or strain) parameter ver-
sus the cycles to failure (S-N curves) obtained in laboratory tests. A schematic S-N
curve is shown in Fig. 34.4. The stress parameter in this plot is the stress range, ∆σ.
The maximum stress in the test specimen is also used for this parameter.
Cycles to failure reported in the fatigue literature depend upon the definition of
failure used in the particular investigation. Failure may be defined as the first
appearance of an observable crack. A crack of a specific length may also be used as
a failure criterion. Finally, the inability to resist the applied load without significant
crack extension or corresponding load relaxation in a constant-amplitude deforma-
tion test may be used to denote failure.
Figure 34.4 also contains plots which represent the portion of the total life con-
tributed by the crack initiation phase and by the crack propagation phase. At high
levels of stress the major portion of the life consists of crack propagation, while at
∆σ
2
σ
max
+σ
min
2
ENGINEERING PROPERTIES OF METALS 34.9
8434_Harris_34_b.qxd 09/20/2001 12:30 PM Page 34.9