Harris C.M., Piersol A.G. Harris Shock and vibration handbook
Подождите немного. Документ загружается.

low stress levels crack initiation constitutes the major portion of the life. Design pro-
cedures for structural components which may have surface irregularities different
from those of the test specimens or which may contain cracklike discontinuities or
flaws must take this difference in behavior into account.
The lowest value of stress or stress amplitude for which the crack propagation is
so small that the number of cycles to failure appears to be infinite, run-out, is com-
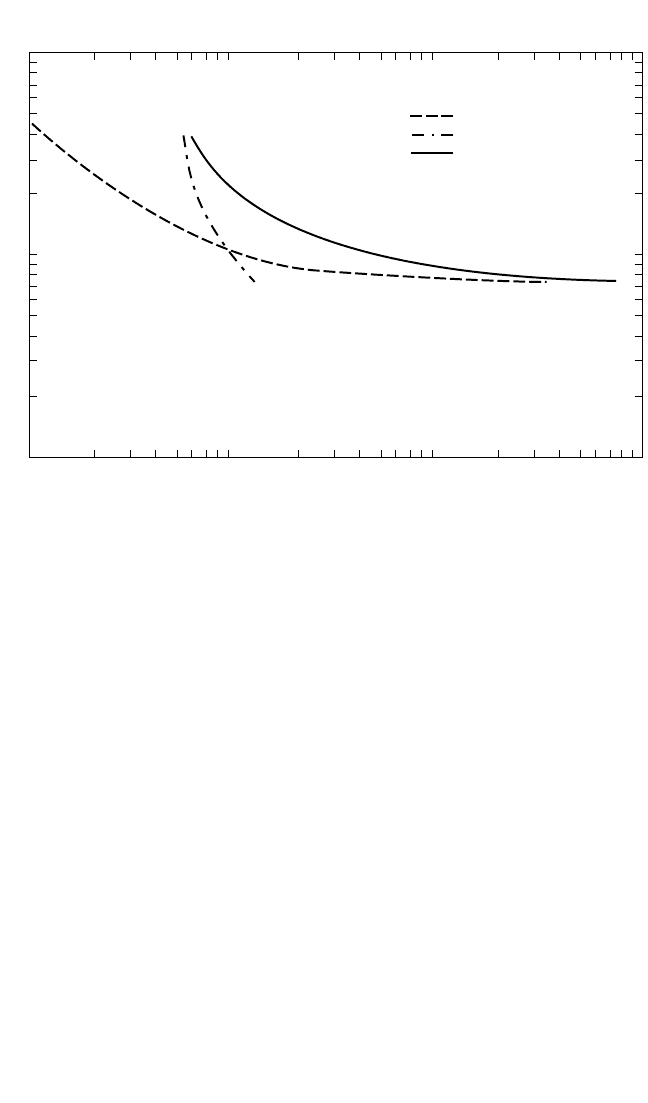
monly referred to as the endurance limit. Representative values of the endurance
limit for a variety of materials are presented in Tables 34.5 and 34.6. The effects of
geometry and corrosive environment on the relationship between fatigue strength
and ultimate strength of steels are shown in Fig. 34.5.
Three design approaches are presented in the following sections. The stress-life
method was the first approach employed and has been the standard method for
many years. It is still widely used in applications in which the applied stress is within
the elastic range. It does not work well where the applied strains have a significant
plastic component, low-cycle fatigue. A strain-life approach is more appropriate in
this case. A more recent development in the evaluation of fatigue life incorporates
the concepts of fracture mechanics to analyze the crack growth from some initial
flaw size as cyclic stresses are applied. In this approach, failure may be defined as the
development of a crack of some specific dimension. Detailed discussions of the dif-
ferent methods are given in Refs. 10 and 11.
STRESS-LIFE METHOD
The first procedure used to design structural components utilizes a design fatigue
curve which characterizes the basic unnotched fatigue properties of the material and
34.10 CHAPTER THIRTY-FOUR
STRESS FLUCTUATION, ∆σ
NUMBER OF CYCLES TO FAILURE
,
N
INITIATION LIFE
PROPAGATION LIFE
TOTAL LIFE
FIGURE 34.4 Schematic S-N curve divided into initiation and propagation components. (J. M.
Barsom and J. T. Rolfe, p. 251, Ref. 11.)
8434_Harris_34_b.qxd 09/20/2001 12:30 PM Page 34.10

a fatigue-strength reduction factor. Parameters characteristic of the specific compo-
nent which make it more susceptible to fatigue failure than the unnotched specimen
are reflected in the strength-reduction factor. Early applications of this method were
based on the results of rotating bending tests. The application of such tests, in which
mirror-polished specimens were subjected to reversed bending, requires considera-
tion of a number of factors which present themselves in design situations. Among
these factors are size, type of loading, surface finish, surface treatments, temperature,
and environment.
In the rotating beam test, a relatively small volume of material is subjected to the
maximum stress. For larger rotating beam specimens, the volume of material is
greater, and therefore there will be a greater probability of initiating a fatigue crack.
Similarly, an axially loaded specimen which has no gradient will exhibit an
endurance limit smaller than that obtained from the rotating beam test. Surface fin-
ish will have a similar effect. Surface finish is more significant for higher-strength
steels. At shorter lives (high stress levels), surface finish has a smaller effect on the
fatigue life. Surface treatment, temperature, and environment have similar effects.
The effect of mean stress on fatigue life is conveniently represented in the form
of a modified Goodman fatigue diagram (Fig. 34.6). In this figure, the ordinate is the
maximum stress, and the abscissa is the minimum stress. Radial lines indicate the
stress ratio. The curves n
1
, n
2
, etc., represent failure at various lives.
Many design specifications
12–15
contain provisions for repeated loadings based
on laboratory tests. In these specifications, fabricated details are categorized for
ENGINEERING PROPERTIES OF METALS 34.11
TABLE 34.5 Tensile and Fatigue Properties of Steels (J. M. Lessells.
8
)
Endur-
Yield Tensile ance
strength, strength, Reduc- limit,
lb/in.
2
, lb/in.
2
, Elonga- tion of lb/in.
2
, Ratio
Material State σ
y
σ
u
tion, % area, % σ
e
σ
e
/σ
u
0.02% C As received 19,000 42,400 48.3 76.2 26,000 0.61
Wrought iron As received 29,600 47,000 35.0 29.0 23,000 0.49
0.24% C As received 38,000 60,500 39.0 64.0 25,600 0.425
0.24% C Water-quenched 45,600 67,000 38.0 71.0 30,200 0.45
and drawn
0.37% C Normalized 34,900 71,900 29.4 53.5 33,000 0.46
0.37% C Water-quenched 63,100 94,200 25.0 63.0 45,000 0.476
and drawn
0.52% C Normalized 47,600 98,000 24.4 41.7 42,000 0.43
0.52% C Water-quenched 84,300 111,400 21.9 56.6 55,000 0.48
and drawn
0.93% C Normalized 33,400 84,100 24.8 37.2 30,500 0.36
0.93% C Oil-quenched 67,600 115,000 23.0 39.6 56,000 0.487
and drawn
1.2% C Normalized 60,700 116,900 7.9 11.6 50,000 0.43
1.2% C Oil-quenched 130,000 180,000 9.0 15.2 92,000 0.51
and drawn
0.31% C, 3.35% Ni Normalized 53,500 104,000 23.0 45.0 49,500 0.47
0.31% C, 3.35% Ni Oil-quenched 130,000 154,000 17.0 49.0 63,500 0.41
and drawn
0.24% C, 3.3% Ni, Oil-quenched 128,000 138,000 18.2 61.8 68,000 0.49
0.87% Cr and drawn
8434_Harris_34_b.qxd 09/20/2001 12:30 PM Page 34.11

design purposes and fatigue-strength stress ranges are given for different fatigue
lives.
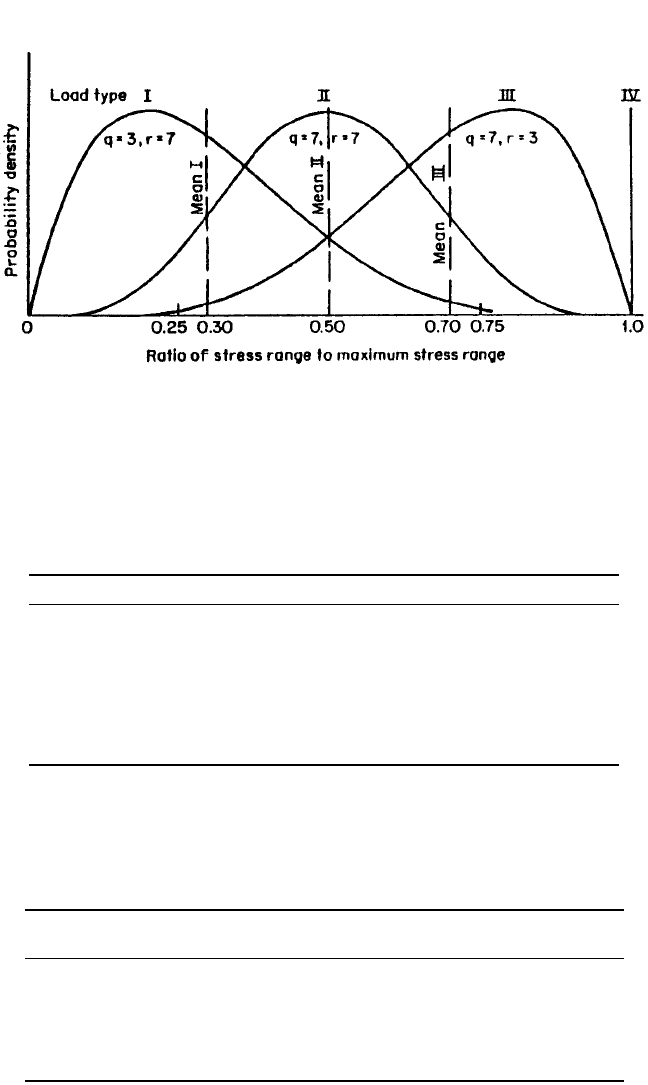
The following procedure
16
has been used to determine an allowable fatigue
design stress range, S
R
. Four different loading histograms, shown in Fig. 34.7, were
used to describe the frequency distribution of the ratio of the cyclic stress range to
the maximum cyclic stress range. The four conditions are defined in Table 34.7; the
first three represent beta-distribution probability density functions that have shape
factors q and r as shown. The allowable fatigue design stress range S
R
may be deter-
mined from
S
R
= S
r
R
F
C
L
(34.4)
34.12 CHAPTER THIRTY-FOUR
TABLE 34.6 Tensile and Fatigue Properties of Nonferrous Metals (J. M. Lessells.
8
)
Endurance
limit or
Tensile fatigue N
1
,* N
2
†
strength, strength, millions millions
lb/in.
2
, lb/in.
2
, of of Ratio
Material State σ
u
σ
e
cycles cycles σ
e
/σ
u
Aluminum 22,600 10,500 100 6 0.46
Duralumin Rolled 51,000 14,000 400 >400 0.27
Duralumin Annealed 25,200 10,000 200 >200 0.40
Duralumin Tempered 51,300 12,000 400 4
1
⁄2 0.24
Magnesium Extruded 32,500 8,000 200 2 0.25
Magnesium alloy 35,200 12,000 600
1
⁄2 0.34
(4% Al)
Magnesium alloy 39,000 15,000 100 1 0.38
(4% Al, 0.25% Mn)
Magnesium alloy 41,200 13,000 600
1
⁄2 0.31
(6.5% Al)
Magnesium alloy 44,500 15,000 100
1
⁄2 0.34
(6.5% Al, 0.25% Mn)
Magnesium alloy 39,000 12,000 600
1
⁄2 0.31
(10% Cu)
Electron metal 36,600 17,000 200 30 0.47
Copper Annealed 32,400 10,000 500 20 0.31
Copper Cold-drawn 56,200 10,000 500 >500 0.18
Brass (60–40) Annealed 54,200 22,000 500 >500 0.44
Brass (60–40) Cold-drawn 97,000 26,000 500 50 0.27
Naval brass 68,400 22,000 300 10 0.32
Aluminum bronze As cast 59,200 23,000 60 3 0.39
(10% Al)
Aluminum bronze Heat-treated 77,800 27,000 40 1 0.35
(10% Al)
Bronze (5% Sn) Annealed 45,600 23,000 1000 10 0.50
Bronze (5% Sn) Cold-drawn 85,000 27,000 500 50 0.32
Manganese bronze As cast 70,000 17,000 150 20 0.24
Nickel Annealed 70,000 28,000 100 50 0.40
Monel metal Hot-rolled 90,000 32,000 450 >450 0.36
* N
1
= cycles on which σ
e
is based.
†
N
2
= cycles at which σ-N curve becomes and remains horizontal.
8434_Harris_34_b.qxd 09/20/2001 12:30 PM Page 34.12
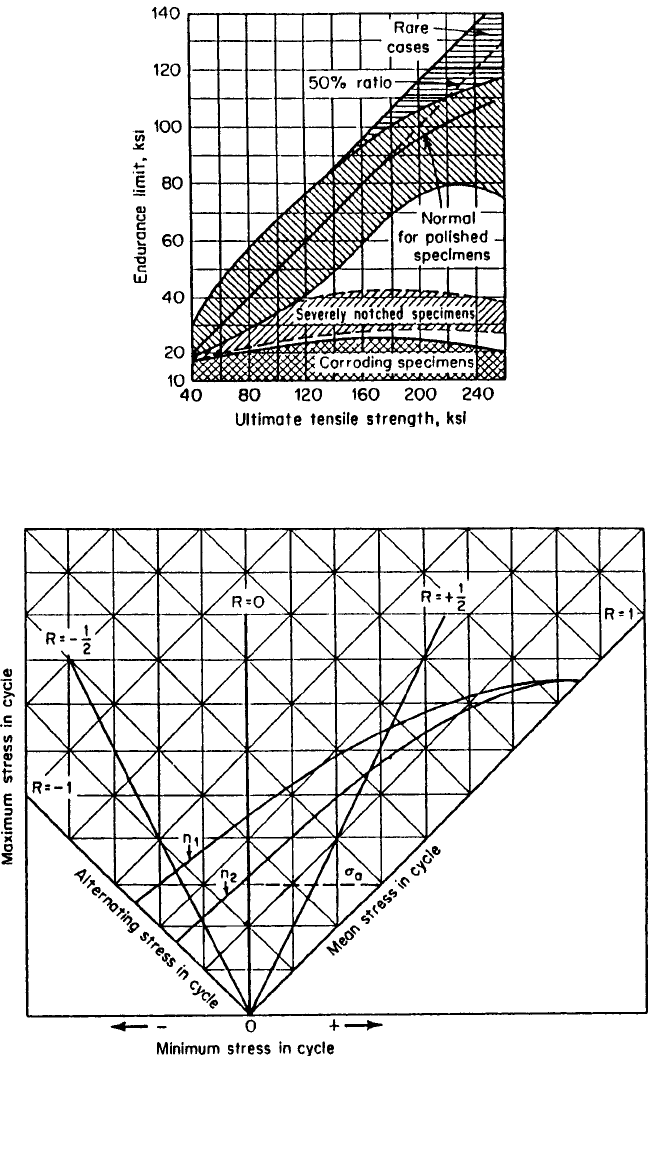
FIGURE 34.6 Modified Goodman diagram for various lives and stress ranges.
34.13
FIGURE 34.5 Relationship between the fatigue limit
and ultimate tensile strength of various steels. (Battelle
Memorial Institute.
9
)
8434_Harris_34_b.qxd 09/20/2001 12:30 PM Page 34.13
34.14 CHAPTER THIRTY-FOUR
TABLE 34.7 Random Loading Coefficients C
L
Type Load description (see Fig. 34.7) Coefficient C
L
I Primarily light loading cycles: mean range of stress 2.75
030% of maximum (q = 3, r = 7)
II Medium loading cycles: mean range of stress 1.85
50% of maximum (q = 7, r = 7)
III Primarily heavy loading cycles: mean range of stress 1.35
70% of maximum (q = 7, r = 3)
IV Constant loading cycles: stress range constant 1.00
and equal to 100% of maximum
TABLE 34.8 Reliability Factors R
F
Level of Reliability
reliability Structural importance of detail factor R
F
90% Secondary details for which fatigue cracking is 0.67
of little structural significance
95% Major structural details for which fatigue cracking 0.60
is important: members in redundant structures
99% Major structural details in fracture-critical members 0.45
where fatigue cracking is critical
FIGURE 34.7 Loading frequency distributions. (W. H. Munse and S. T. Rolfe, Sect. 4 of Ref. 16.)
8434_Harris_34_b.qxd 09/20/2001 12:30 PM Page 34.14

where S
r
= mean constant-cycle fatigue stress range for desired life
R
F
= reliability factor based on a statistical fatigue analysis for
survival, Table 34.8
C
L
= loading coefficient to be selected for load type, Table 34.7
The stress-life method works quite well for the design for long-life and constant-
amplitude stress histories.
STRAIN-LIFE METHOD
At high load levels, at which plastic strains are likely to occur, the response and
material behavior are best modeled under strain-controlled conditions. Engineered
structures almost always contain points of stress concentration which cause plastic
strains to develop. The constraint imposed by the surrounding elastic material pro-
duces an essentially strain-controlled environment. For these conditions, tests under
strain control are used to simulate fatigue damage at points of stress concentration.
The strain-life method does not account for crack growth. Consequently, such meth-
ods may be considered initiation life estimates. For components in which the exis-
tence of a crack may be an overly conservative criterion, fracture mechanics may be
employed to assess the crack propagation life from some assumed initial crack size.
Cyclic inelastic loading of a material produces a hysteresis loop. The stress range,
∆σ, is the total height of the loop. The total width of the loop is ∆, the total strain
range. The strain amplitude,
a
, can be expressed by
a
= (34.5)
and the stress amplitude, σ
a
,is
σ
a
= (34.6)
The sum of the elastic and plastic strain ranges is the total strain, ∆. This may be
expressed mathematically as
∆ =∆
e
+∆
p
(34.7)
In terms of amplitudes
=+ (34.8)
The elastic term may be replaced by ∆σ/E by applying Hooke’s law, so that
=+ (34.9)
Under repeated cycling the stress-strain response may exhibit cyclic hardening,
cyclic softening, cyclic stability, or a mixed behavior (softening or hardening depend-
ing upon the stress range).
∆
p
2
∆σ
2E
∆
2
∆
p
2
∆
e
2
∆
2
∆σ
2
∆
2
ENGINEERING PROPERTIES OF METALS 34.15
8434_Harris_34_b.qxd 09/20/2001 12:30 PM Page 34.15

From experimental data, the following relationship between total strain range
and the number of reversals to failure has been developed:
= (2N
f
)
b
+ ′
f
(2N
f
)
c
(34.10)
where ∆ = total strain range
σ′
f
= fatigue strength coefficient
2N
f
= reversals to failure
b = fatigue strength exponent
′
f
= fatigue ductility coefficient
c = fatigue ductility exponent
The fatigue strength coefficient, σ′
f
, is approximately equal to the true fracture
strength. The fatigue strength exponent, b, varies between −0.05 and −0.12. The
fatigue ductility coefficient, ′
f
, is approximately equal to the true fracture ductility.
The fatigue ductility exponent, c, varies between −0.5 and −0.07. Additional discus-
sion of these parameters and approximate formulations for the fatigue strength
coefficient and the fatigue ductility coefficient are presented in Ref. 10.
Cyclic properties are generally obtained from completely reversed, constant-
amplitude, strain-controlled tests. The effects of mean strain have been studied by
various investigators, and modifications of Eq. (34.10) have been proposed.
This method of analysis is obviously more complicated than the stress-life
approach. Notch root strains must be evaluated by application of some method of
analysis. Since it is based on strain cycling of constant magnitude, it applies only in
the immediate region of the notch and predicts the initiation life for a fatigue crack.
FRACTURE MECHANICS METHOD
Fracture mechanics is the study of the performance of structures with cracklike
defects. The distribution of stress components at the crack tip are related to a con-
stant called the stress intensity factor, characterized by the applied stress and the
dimensions of the crack. In addition to the applied stress, the design process using
fracture mechanics incorporates flaw size and fracture toughness properties of the
material. Fracture toughness replaces strength as the relevant material property.
As noted earlier, fatigue life is divided into an initiation phase and a propagation
phase.The fracture mechanics method can be used to determine the propagation life
on the assumption of some initial crack or defect size. The strain-life approach may
be used to determine the initiation life for an evaluation of the total fatigue life.
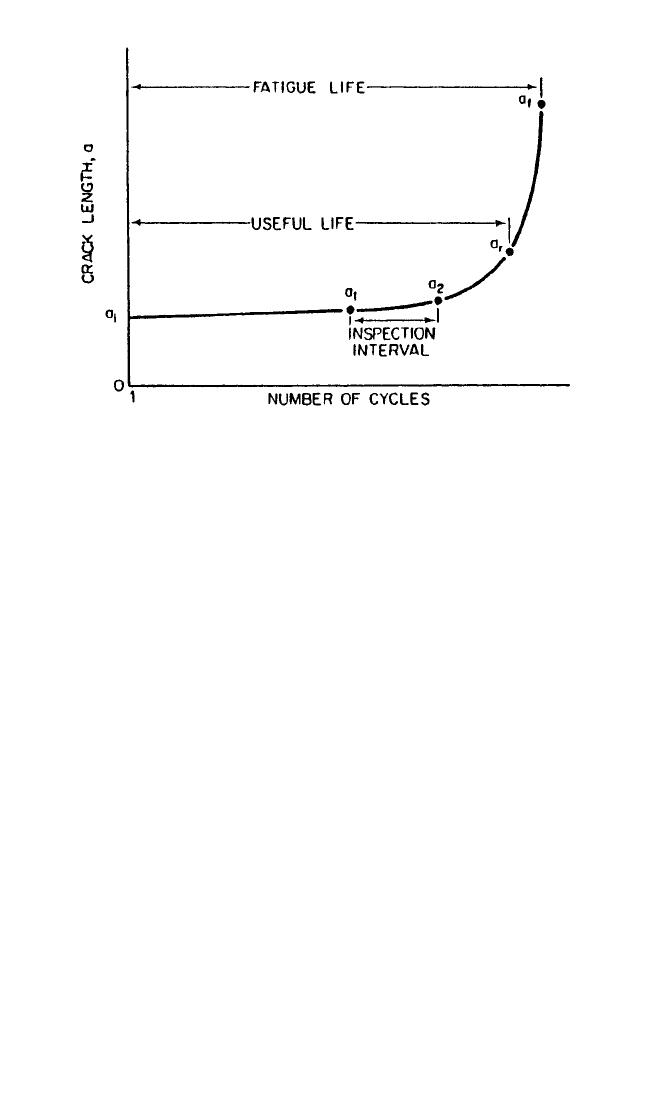
Fatigue crack growth under constant-amplitude cyclic loading can be represented
schematically as shown in Fig. 34.8. Such data can be presented in terms of crack
growth rate per cycle of loading, da/dN, and the fluctuation of the stress intensity fac-
tor, ∆K
1
. The most common presentation of fatigue crack growth data is as a log-log
plot of the rate of fatigue crack growth per cycle of load fluctuation, da/dN, and the
fluctuation of the stress intensity factor, ∆K
1
. Such a plot shows three distinct regions.
At low values of ∆K, the rate of crack propagation is extremely small, essentially
zero. The value of ∆K for this condition is referred to as the fatigue-threshold cyclic
stress intensity factor fluctuation, ∆K
th
, below which cracks do not propagate. There
are sufficient data available to demonstrate the existence of this threshold, but more
work is needed to determine the factors which affect its magnitude for use in design.
The second stage in the crack propagation versus stress intensity factor relation-
ship represents the fatigue crack propagation behavior above ∆K
th
. In this region the
relationship can be defined as
σ′
f
E
∆
2
34.16 CHAPTER THIRTY-FOUR
8434_Harris_34_b.qxd 09/20/2001 12:30 PM Page 34.16
= A(∆K)
m
(34.11)
where a = crack length
N = number of cycles
∆K = stress intensity factor range
and A and m are constants that depend on the properties of the material.
The third stage in the crack propagation versus stress intensity factor relationship
shows a very rapid increase in the rate of crack propagation.
Fatigue crack propagation may be affected by the mean stress, cyclic frequency,
waveform, and environment. Extensive discussion of the effect of these parameters,
as well as values of A and m for different materials, is presented in Ref. 11.
Equation (34.11) can be used, with appropriate values of A and m, to analyze
fatigue crack growth as a function of cyclic loading between some assumed initial
crack size and some critical crack dimension assumed to represent the ultimate con-
dition. The critical crack dimension may be chosen on the basis of the limiting static
strength or on the basis of the crack size which may result in brittle fracture. The
procedure requires the integration of Eq. (34.11) from an initial crack size, a
0
, which
corresponds to an initial value of ∆K. An increment of crack growth must be incor-
porated, during which stage the value of ∆K remains constant. The value of ∆K is
then revised and the process is continued until the crack reaches the limiting critical
dimension. An example of this procedure is presented in Ref. 11.
VARIABLE-AMPLITUDE LOADING
Most laboratory fatigue tests are conducted at constant values of maximum and
minimum stress. Most structures, on the other hand, are subjected to loading cycles
with variable minimum and maximum stresses over the course of their life. Proce-
da
dN
ENGINEERING PROPERTIES OF METALS 34.17
FIGURE 34.8 Schematic representation of fatigue crack growth curve
under constant-amplitude loading. (J. M. Barsom and S. T. Rolfe, p. 279,
Ref. 11.)
8434_Harris_34_b.qxd 09/20/2001 12:30 PM Page 34.17

dures are required to relate the behavior under constant cyclic loading obtained in
laboratory tests and the variations of stress history over time which occur in an
actual structure. It is also necessary to convert the complicated time-history of a real
structure into some equivalent number of individual stress cycles for the evaluation
of their cumulative effect.
DAMAGE RULES
Damage during the initiation phase of fatigue is difficult to assess, as it occurs on a
microscopic level and is not easily observed or evaluated. During the propagation
phase, damage can be related to an observable and measurable crack length. Both
linear and nonlinear damage rules for the accumulation of fatigue damage have
been proposed. Only the linear damage rule will be discussed here.
The most commonly applied linear damage rule was originally proposed in 1924
and was developed further by Miner.
17
The method is referred to simply as Miner’s
rule. Damage under cyclic loading is defined as the ratio of the number of applied
cycles, n
i
, at stress level σ
i
to the number of cycles to failure, N
i
, in a constant-
amplitude test conducted at σ
i
. The hypothesis states that failure occurs when the
accumulated damage reaches 1. Mathematically,
Σ=+++
...
≥ 0 (34.12)
This linear damage rule is easily applied after an appropriate counting method has
been established. It has the shortcoming, however, that it does not consider the
sequence of loading and assumes that damage in any individual stress cycle is inde-
pendent of what has preceded it. Furthermore, it assumes that damage accumulation
is independent of stress amplitude.
CYCLE COUNTING
Some method of cycle counting is required in order to determine the number of
cycles at a specific stress range. The tabulation of stress cycles at the various stress
ranges is referred to as the stress spectrum. Several counting methods have been
proposed, and a summary of these methods is contained in Ref. 18.The two counting
methods most commonly used are the rainflow counting method and the reservoir
method. The following example from Ref. 19 demonstrates the procedures.
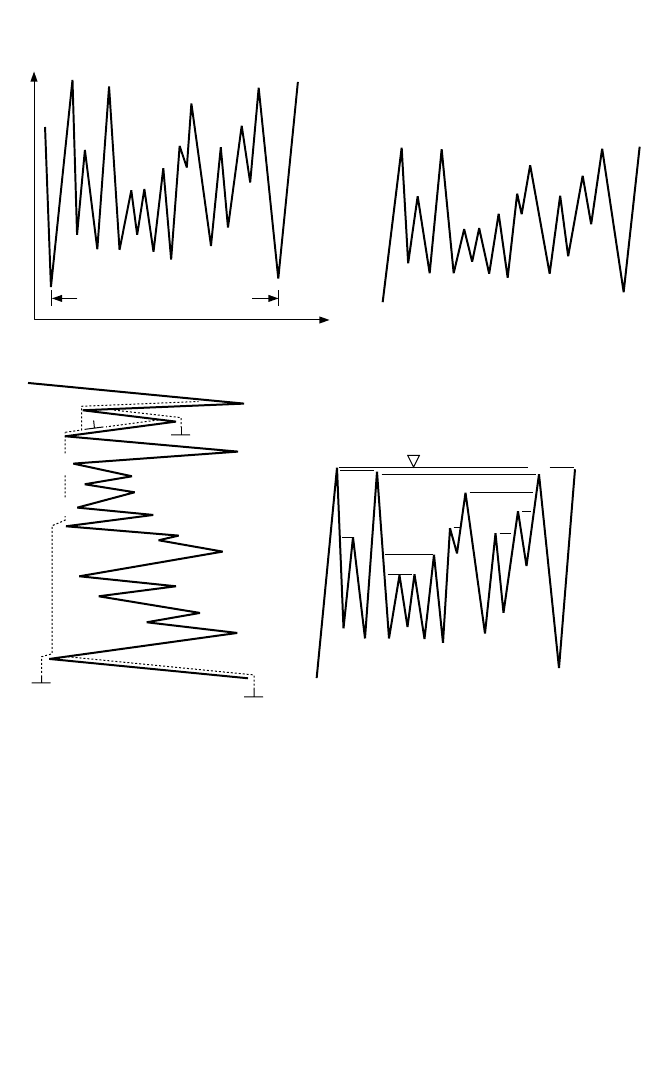
The rainflow counting method employs the analogy of raindrops flowing down a
pagoda roof. Peaks and troughs for one loading event are presented in Fig. 34.9A.
The maximum and minimum stresses are indexed in Fig. 34.9B. The following rules
apply to rainflow counting:
1. A drop flows left from the upper side of a peak or right from the upper side of
a trough and onto subsequent “roofs” unless the surface receiving the drop is formed
by a peak that is more positive for left flow or a trough that is more negative for right
flow. For example, a drop flows left from point 1 off points 2, 4, and 12 until it stops
at the end of the loading event at point 22, since no peak is encountered that is more
positive than point 1. On the other hand, a drop flows right from point 2 off point 3
and stops, since it encounters a surface formed by a trough (point 4) that is more
negative than point 2.
n
3
N
3
n
2
N
2
n
1
N
1
n
i
N
i
34.18 CHAPTER THIRTY-FOUR
8434_Harris_34_b.qxd 09/20/2001 12:30 PM Page 34.18
2. The path of a drop cannot cross the path of a drop that has fallen from above.
For example, a drop flowing left from point 3 stops at the horizontal position of point
2 because it encounters a path coming from point 2.
3. The horizontal movement of a raindrop, measured in units of stress from its
originating peak to its stop position, is counted as one-half of a cycle in the stress
spectrum.
The stress variation of Fig. 34.9A is rotated 90° in Fig. 34.9C for application of the
rainflow counting method. The values of the peaks for the stress history shown in
Fig. 34.9 are given in Table 34.9. Table 34.10 contains the values of the half-cycle
magnitudes which result from application of the rules above.
ENGINEERING PROPERTIES OF METALS 34.19
STRESSES DUE TO
ONE LOADING EVENT
STRESS
1
5
15
13
11
9
7
3
22
2
4
6
8
10
12
16
14
17
19
21
1
22
20
18
6
1
1
22
2
4
11
13
14
8
7
9
16
18
20
19
12
22
5
3
21
15
17
10
1
5
15
13
11
9
7
3
22
2
4
6
8
10
12
16
14
17
19
21
1
22
20
18
FIGURE 34.9 Variable-amplitude loading for analysis. (A) An example of stress variation in an ele-
ment due to one loading event. (B) Peaks and troughs numbered for one loading event. (C) Rainflow
analysis. (D) Reservoir analysis.
(C)
(B)(A)
(D)
8434_Harris_34_b.qxd 09/20/2001 12:30 PM Page 34.19