Harris C.M., Piersol A.G. Harris Shock and vibration handbook
Подождите немного. Документ загружается.


MECHANICAL IMPEDANCE MEASUREMENTS
AND APPLICATIONS
Measurements
Transducers (Chap. 12), instrumentation (Chap. 13), and spectrum analyzers (Chap.
14) are essential subjects related to impedance measurements. Some special consid-
erations are given here. The measurement of mechanical impedance involves the
application of a sinusoidal force and the measurement of the complex ratio of force
to the resulting velocity. Many combinations of transducers are capable of perform-
ing these measurements. However, the most effective method is to use an impedance
transducer such as that shown in Fig. 10.8. These devices are available from suppliers
of vibration-measuring sensors. As shown in Fig. 10.8, the force supplied by the
vibration exciter passes through a force sensor to the unknown Z
x
, and the motion is
measured by an accelerometer whose output is integrated to obtain velocity. The
accelerometer measures the true motion, but the force sensor measures the force
required to move the accelerometer and its mounting structure, as well as the force
to Z
x
. This extra mass is usually called the “mass below the force gage.” The imped-
ance is then as follows:
Z
x
= jω[K
f
/K
a
](e
f
/e
a
) − jωm
o
where e
f
and e
a
are the force gage and accelerometer phasor potentials, K
f
in volts/N
is the force gage sensitivity, K
a
in volts/m/sec
2
is the accelerometer sensitivity, and m
o
is the mass below the force gage. The ratio K
f
/K
a
and m
o
can be determined by a cal-
ibration as follows:
1. With no attachment, Z
x
= 0. Then m
o
= [K
f
/K
a
] (e
f
/e
a
)
0
.
2. Attach a known mass, M. Then M + m
o
= [K
f
/K
a
] (e
f
/e
a
)
1
, m
o
= M/{[(e
f
/e
a
)
0
/
(e
f
/e
a
)
1
] − 1}.
3. Thus [K
f
/K
a
] = m
o
/(e
f
/e
a
)
0
.
MECHANICAL IMPEDANCE 10.11
FIGURE 10.8 Device for the measurement of mechanical
impedance in which force and acceleration are measured.
A
AA
FORCE
TRANSDUCERS
SEC A-A
SEISMIC
MASS
F
e
f
Z
x
e
a
ATTACHMENT
PLATE
8434_Harris_10_b.qxd 09/20/2001 11:18 AM Page 10.11

With the aid of a two-channel analyzer (see Chap. 14) or appropriate signal process-
ing software (see Chap. 22), forces such as sine-sweeps, broad bandwidth random
noise, or impacts can be used for these measurements. The Fourier transform of the
force and acceleration potentials will provide correct sinusoidal terms. The impact
method can be implemented with a hammer equipped with a force gage and
accelerometer, as detailed in Chap. 21.
APPLICATIONS
The impedance concept is widely used in the study of mechanical systems.
2–4,6
Three
practical applications are presented here.
Application 1. Assume one wishes to determine the free motion at a point on a
structure that would be altered by the attachment of a sensor such as an accelerom-
eter.The procedure is illustrated in Fig. 10.9, and involves the following steps.
1. Turn off the source causing the vibration v
f
.
2. Measure the internal impedance Z
0
at a point A over the expected frequency
range.
3. Attach the measuring device whose known impedance is Z
m
and measure v
m
.
4. Draw the Norton equivalent circuit at point A with Z
m
attached. Note that Z
0
is
attached to the reference since it may be masslike.
5. Calculate the free velocity from
v
f
= v
m
Z
m
/(Z
0
+ Z
m
)
Application 2. Assume one wishes to choose a vibration isolator between a
vibrating machine and a flexible structure. The criteria are to reduce the ratio of the
velocity of the structure to the free velocity of the machine below some desired
value, or to reduce the ratio of the force transmitted to the structure to the clapped
force of the machine below some desired value. The procedure is as follows:
1. Model the system as shown in Fig. 10.10, where F
cm
is the clamped force and Z
m
is
the impedance at the attachment point. The structural impedance at the attach-
ment point is Z
st
and “Z” is a set of Z parameters of the isolator that satisfy
F
1
= Z
11
v
1
+ Z
12
v
2
and F
2
= Z
21
v
1
+ Z
22
v
2
10.12 CHAPTER TEN
FIGURE 10.9 Measurement of free motion.
v
m
Z
m
v
f
Z
0
Z
0
v
f
A
8434_Harris_10_b.qxd 09/20/2001 11:18 AM Page 10.12
2. Add the source and structure to obtain
F
1
= F
cm
− Z
m
v
1
and F
2
=−Z
st
v
2
The system equations then become
F
cm
= (Z
11
+ Z
m
)v
1
+ Z
12
v
2
and 0 = Z
21
v
1
+ (Z
22
+ Z
st
)v
1
3. Solve for the force to the structure F
st
= F
2
from
F
st
/F
cm
= Z
12
Z
st
/[(Z
11
+ Z
m
)(Z
22
+ Z
st
) − Z
12
Z
21
]
This result follows from v
st
= F
st
/Z
st
and v
fm
= F
cm
/Z
m
.
4. The ratio of the velocity of the structure to the free velocity of the machine is
then given by
v
st
/v
fm
= Z
21
Z
m
/[(Z
11
+ Z
m
)(Z
22
+ Z
st
) − Z
12
Z
21
]
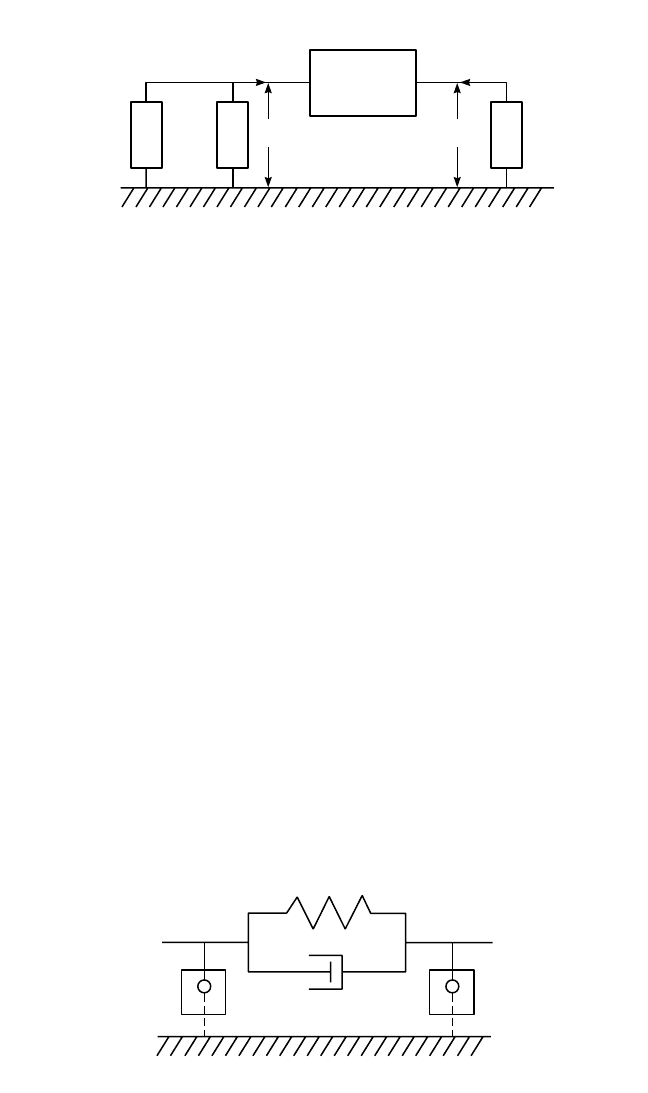
Typical vibration isolators can be modeled as shown in Fig. 10.11, where the Z
parameters are given by
Z
11
= c + jωm
1
+ k/jω; Z
22
= c + jωm
2
+ k/jω; Z
12
= Z
21
= c + k/jω
The values of c, k, m
1
, and m
2
should be available from the manufacturer, or they can
be measured. Using the measured values of Z
m
and Z
st
, the transmissibilities of the
force and velocity can be computed from the expression above, and plots of these
functions versus frequency can be compared to the desired criteria.
Application 3. Assume one wishes to isolate a piece of equipment from a vibrat-
ing structure. The procedure is essentially the same as detailed in Application 2.
MECHANICAL IMPEDANCE 10.13
FIGURE 10.10 Vibration isolation application.
Z
m
F
cm
Z
st
v
1
v
2
“Z”
FIGURE 10.11 Vibration isolator model.
m
1
m
2
c
k
8434_Harris_10_b.qxd 09/20/2001 11:18 AM Page 10.13

Specifically, measure the clamped force F
st
, or the free velocity v
st
, of the structure.
Then in Fig. 10.10, replace the F
cm
and Z
m
with F
st
and Z
st
, and replace Z
st
with Z
m
.
Proceed to write the system 2-port equations and solve for the force or velocity
transmissibility.
REFERENCES
1. Hixson, E. L.: “Mechanical Impedance and Mobility,” chap. 10, in C. M. Harris and C. E.
Crede (eds.), “Shock and Vibration Handbook,” 1st ed., McGraw-Hill Book Company,
Inc., New York, 1961.
2. Morse, P. M.: “Vibration and Sound,” p. 29, McGraw-Hill Book Company, Inc., New York,
1948.
3. Crafton, P. A.: “Shock and Vibration in Linear Systems,” p. 99, Harper & Sons, Inc., New
York, 1961.
4. Snowdon, J. C.,“Vibration and Shock in Damped Mechanical Systems,” p. 105, John Wiley
& Sons, Inc., 1968.
5. Plunkett, R.: ASME Paper 53-A-45, J. Appl. Mechanics, 76:250 (1954).
6. Carlson, U.: J. Acous. Soc. Am., 97(2):1345 (1995).
10.14 CHAPTER TEN
8434_Harris_10_b.qxd 09/20/2001 11:18 AM Page 10.14

CHAPTER 11
STATISTICAL METHODS
FOR ANALYZING
VIBRATING SYSTEMS
Richard G. DeJong
INTRODUCTION
This chapter presents statistical methods for analyzing vibrating systems. Two situa-
tions often occur in which a statistical analysis is useful. The first occurs when the
excitation of a system appears to be random in time, in which case it is convenient to
describe the temporal response of the system statistically rather than deterministi-
cally. This form of analysis is called random vibration analysis
1
and is presented in
the first half of this chapter. The second situation occurs when a system is compli-
cated enough that its resonant modes appear to be distributed randomly in fre-
quency, in which case it is convenient to describe the frequency response of the
system statistically rather than deterministically. This form of analysis
2
is called sta-
tistical energy analysis (SEA) and is presented in the second half of this chapter.
In either situation the randomness need only appear to be so. For example, in
random vibration it may be that the excitation could be calculated exactly if enough
information were known. However, if the excitation is adequately described by sta-
tistical parameters (such as the mean value and variance), then a statistical analysis
of the system response is valid. Similarly, in a complicated system the modes can pre-
sumably be analyzed deterministically. However, if the modal distribution is ade-
quately described by statistical parameters, then a statistical energy analysis of the
system response is valid whether or not the excitation is random.
RANDOM VIBRATION ANALYSIS
A random vibration is one whose instantaneous value is not predictable with the
available information. Such vibration is generated, for example, by rocket engines,
turbulent flows, earthquakes, and motion over irregular surfaces. While the instanta-
neous vibration level is not predictable, it is possible to describe the vibration in sta-
11.1
8434_Harris_11_b.qxd 09/20/2001 11:17 AM Page 11.1

tistical terms, such as the probability distribution of the vibration amplitude, the
mean-square vibration level, and the average frequency spectrum.
A random process may be categorized as stationary (steady-state) or nonstation-
ary (transient). A stationary random process is one whose characteristics do not
change over time. For practical purposes a random vibration is stationary if the
mean-square amplitude and frequency spectrum remain constant over a specified
time period. A random vibration may be broad-band or narrow-band in its fre-
quency content. Figure 11.1 shows typical acceleration-time records from a system
with a mass resiliently mounted on a base subjected to steady, turbulent flow. The
base vibration is broad-band with a Gaussian (or normal) amplitude distribution.
The vibration of the mass is narrow-band (centered at the natural frequency of the
mounted system) but also has a Gaussian amplitude distribution. The peaks of the
narrow-band vibration have a distribution called the Rayleigh distribution.
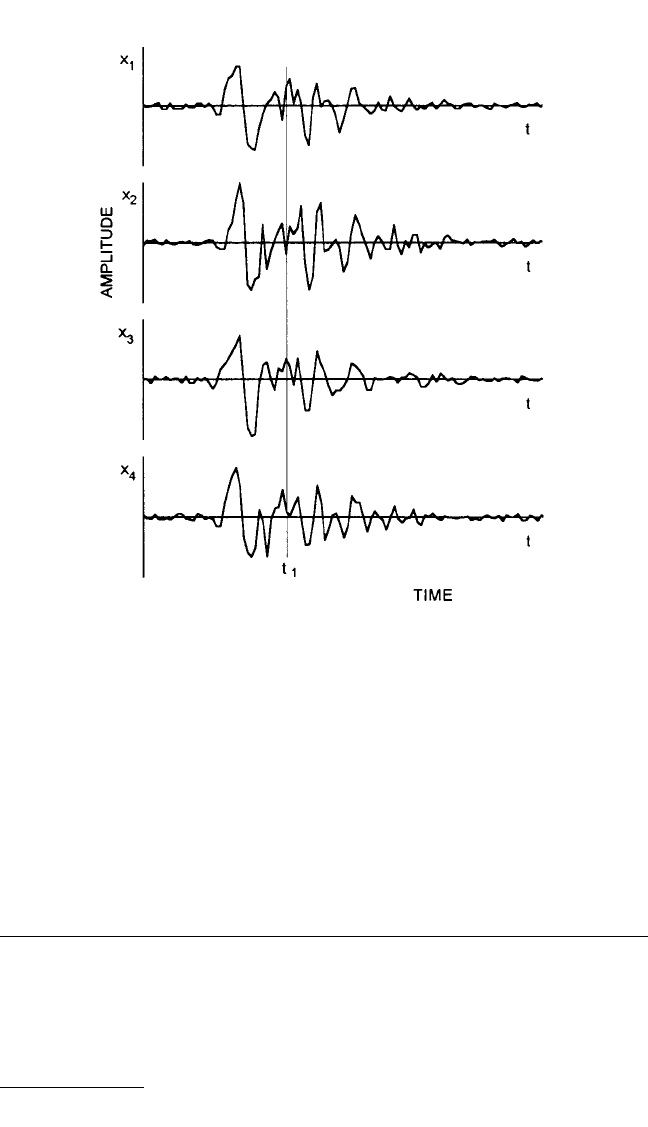
Technically, the statistical measures of a random process must be averaged over
an ensemble (or assembly) of representative samples. For an arbitrary random vibra-
tion this means averaging over a set of independent realizations of the event. This is
illustrated in Fig. 11.2 where four vibration-time records from a point on an internal
combustion engine block are shown synchronized with the firing in a particular
cylinder. Due to uncontrollable variations in the system, the vibration is not deter-
ministically repeatable.The mean-square amplitude is also nonstationary.Therefore,
the statistical parameters of the vibration are time dependent and must be deter-
mined from the ensemble of samples from each record at a particular time.
For a stationary random process it may be possible to obtain equivalent ensem-
ble averages by sampling over time if each time record is representative of the entire
random process. Such a random process is called ergodic. However, not all station-
ary random processes are ergodic. For example, suppose it is desired to determine
the statistical parameters of the vibration levels of an aircraft fuselage during repre-
sentative in-flight conditions. On a particular flight the vibration levels may be suffi-
ciently stationary to obtain useful time averages. However, one flight is unlikely to
encompass all of the expected variations in the weather and other conditions that
affect the vibration levels. In this case it is necessary to combine the time averages
with an ensemble average over a number of different flight conditions which repre-
sent the entire range of possible conditions.
11.2 CHAPTER ELEVEN
FIGURE 11.1 (A) Example of a narrow-band random signal x(t) with a peak envelope x
p
.
(B) Example of a broad-band random signal y(t). Curves along the vertical axes give the
probability distributions for the instantaneous (solid lines) and peak (dashed line) values. (C)
Resiliently mounted mass m with stiffness k and viscous damper c. When the base is exposed
to a broad-band random vibration the mass will have a narrow-band random response.
8434_Harris_11_b.qxd 09/20/2001 11:17 AM Page 11.2
The first half of this chapter describes methods for determining the response of a
vibrating system subjected to random excitations. First, the statistical parameters
used in this analysis are presented. Next, the responses of single and multiple
degree-of-freedom systems to random excitations (stationary and nonstationary)
are analyzed. Then, the application of this analysis to failure prediction is summa-
rized. (More information on failure analysis is included in Chap. 34.)
STATISTICAL PARAMETERS OF RANDOM
VIBRATIONS*
PROBABILITY DISTRIBUTION FUNCTIONS
The fundamental statistical parameter of a random vibration is the probability dis-
tribution of the vibration amplitude x(t) as a function of time. (In general, x may rep-
resent the acceleration, velocity, displacement, stress, etc.) In Fig. 11.1 the amplitude
STATISTICAL METHODS FOR ANALYZING VIBRATING SYSTEMS 11.3
FIGURE 11.2 Ensemble of vibration responses (x
1
, x
2
, x
3
, x
4
) meas-
ured at a point on an internal combustion engine block and synchro-
nized with a particular cylinder firing. The amplitude at time t
1
is a
random variable.
* See Chap. 22 for methods to determine these parameters from measured data.
8434_Harris_11_b.qxd 09/20/2001 11:17 AM Page 11.3
distribution of x is represented by the probability density function p(x).The function
p(x) is obtained from the probability that a particular sample x
i
(t
1
) has a value
between x and x +∆x, represented by Prob[x ≤ x
i
(t
1
) < x +∆x]. For a nonstationary
random process this probability is a function of the time t
1
.The probability density is
defined by
p(x,t
1
) lim
∆x → 0
(11.1)
An alternate representation of the amplitude distribution is the cumulative
(probability) distribution function P(x), which is the probability that a particular
sample x
i
(t
1
) has a value less than or equal to x. The cumulative distribution is
defined by
P(x,t
1
) Prob[x
i
(t
1
) ≤ x] =
x
−∞
p(x′,t
1
) dx′ (11.2)
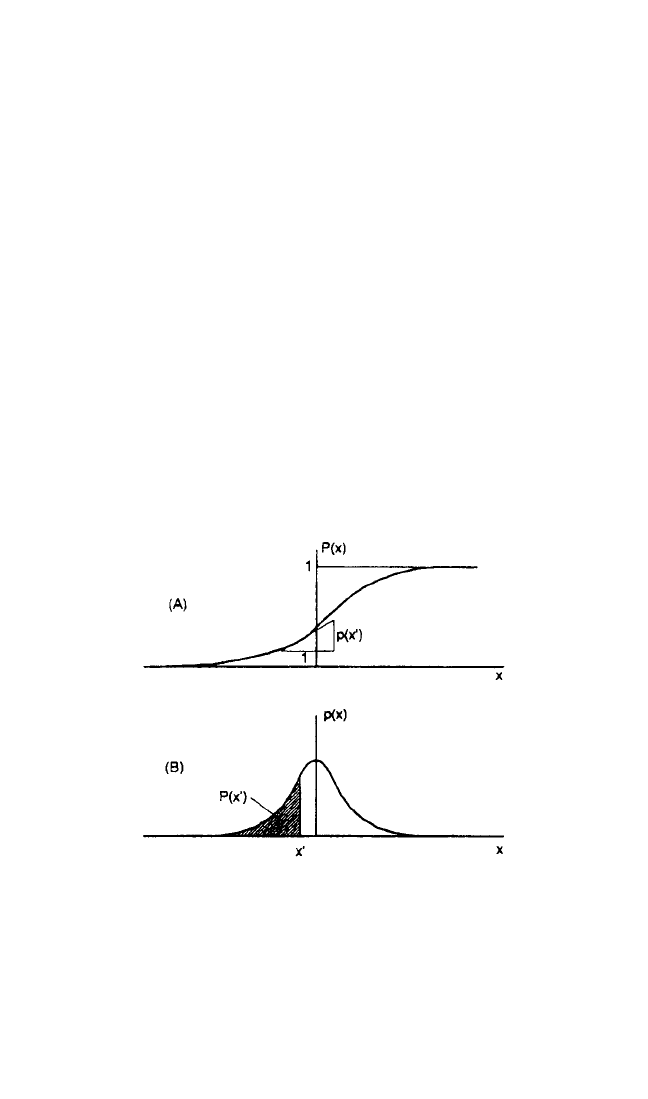
Therefore, the probability density and cumulative distribution functions are related
as illustrated in Fig. 11.3. For most random processes the cumulative distribution
function is smooth and differentiable so that Eq. (11.2) can be rewritten as
p(x,t
1
) = P(x,t
1
) (11.3)
d
dx
Prob[x ≤ x
i
(t
1
) < x +∆x]
∆x
11.4 CHAPTER ELEVEN
FIGURE 11.3 Examples of the probability distribu-
tions of a random variable x. (A) Cumulative (probabil-
ity) distribution function, P(x). (B) Probability density
function p(x).
Since by definition P(x) → 1 as x →∞, the total area under p(x) is normalized to be
unity, or
P(∞,t
1
) =
∞
−∞
p(x,t
1
) dx = 1 (11.4)
8434_Harris_11_b.qxd 09/20/2001 11:17 AM Page 11.4

MEAN VALUE
The mean (or expected) value x
(
t
1
)
of x at time t
1
is defined by the arithmetic aver-
age of all samples x
i
(t
1
):
x
(
t
1
)
lim
N →∞
N
i = 1
x
i
(t
1
) (11.5)
The mean value can be obtained from the probability density by
x
(
t
1
)
=
∞
−∞
xp(x,t
1
) dx (11.6)
If x(t) is stationary over time 0 ≤ t ≤ T, then the mean value can be approximated by
the time average:
x
T
0
x(t) dt (11.7)
where the approximation improves as T →∞.
MEAN-SQUARE VALUE
The mean-square value x
2
(
t
1
)
is defined as the expected value of all samples x
i
2
(t
1
).
The mean-square value can be obtained from the probability density by
x
2
(
t
1
)
=
∞
−∞
x
2
p(x,t
1
) dx (11.8)
If x(t) is stationary, then the mean-square value can be approximated by the time
average:
x
2
T
0
x
2
(t) dt (11.9)
MOMENTS OF THE PROBABILITY DISTRIBUTION
The mean and mean-square values are called the first and second moments of p(x),
respectively. The nth moment of p(x) is then defined by
x
n
(
t
1
)
=
∞
−∞
x
n
p(x,t
1
) dx (11.10)
The variance σ
2
(or square of the standard deviation σ) is the expected value of
the quantity (x − x
)
2
and is evaluated by
σ
2
=
∞
−∞
(x − x
)
2
p(x) dx = x
2
− (x
)
2
(11.11)
where the designation of the time dependence is omitted for clarity. The variance is
then the difference between the mean-square and the square of the mean value of x.
1
T
1
T
1
N
STATISTICAL METHODS FOR ANALYZING VIBRATING SYSTEMS 11.5
8434_Harris_11_b.qxd 09/20/2001 11:17 AM Page 11.5

For many random variables in vibration analysis the mean value is zero so that the
variance and mean-square values can be used interchangeably.
Higher-order moments are usually represented in terms of the normalized vari-
able z = (x − x
)/σ. The value of z is the number of standard deviations x is from the
mean. The normalized third moment is called the skewness a
3
:
a
3
=
∞
−∞
3
p(x) dx (11.12)
The normalized fourth moment is called the kurtosis a
4
:
a
4
=
∞
−∞
4
p(x) dx (11.13)
For a Gaussian distribution a
3
= 0 and a
4
= 3.
GAUSSIAN (NORMAL) DISTRIBUTION
The Gaussian distribution is important in random vibration analysis because it is so
frequently encountered. The Gaussian probability density function is given by
p(x) = e
−1/2[(x − x
)/σ]
2
(11.14)
One reason the Gaussian distribution is so common is the central limit theorem which
states that the sum of N random variables having an arbitrary distribution will
approach a Gaussian distribution as N →∞. If a random vibration results from the
sum of a large number of random excitations, its distribution will tend to be Gaussian.
As a corollary to this, if a vibration response results from the product of a large
number of random variables, the logarithm of the vibration magnitude will be the
sum of the logarithm of the variables, and this sum will tend to have a Gaussian dis-
tribution. The vibration magnitude is then said to have a log-normal distribution.
This occurs in the vibration of complex machinery where the distribution of
responses over an ensemble of nominally identical units will tend to be log-normal.
One common model for the excitation of a random vibration is a sequence of
pulses with random amplitudes and random time spacing as illustrated in Fig. 11.4.
This model can represent, for example, the pressure pulses in the boundary layer of
a turbulent fluid flow or the sequence of stress pulses from an earthquake arriving at
some location after propagating through the earth’s stratified media. The response
of a system to this type of excitation can be thought of as a sum of the responses to
each pulse. The response of a system to a unit impulse is called the impulse response
h(t). The response to a sequence of pulses is then the sum of a sequence of impulse
responses appropriately scaled in amplitude and delayed in time. If the impulse
response is long compared to the average spacing between the pulses, then the
resulting system response will have a Gaussian distribution.
Broad-band, stationary random variables with Gaussian distributions are often
called white noise. Ideally, white noise has an equal contribution from all frequen-
cies. Practically, white noise is usually band-limited to the frequency range of inter-
est. However, a Gaussian distribution does not necessarily imply white noise. This
can be seen from Fig. 11.1 where the vibration response of the resiliently mounted
mass is Gaussian and narrow-band in frequency.
1
σ2
π
x − x
σ
x − x
σ
11.6 CHAPTER ELEVEN
8434_Harris_11_b.qxd 09/20/2001 11:17 AM Page 11.6