Hatano Y., Katsumura Y., Mozumder A. (Eds.) Charged Particle and Photon Interactions with Matter - Recent Advances, Applications, and Interfaces
Подождите немного. Документ загружается.

780 Charged Particle and Photon Interactions with Matter
a and c. Excited triplet states undergoing transitions to either the a- or c-state are thereby for-
bidden by the g ↔ u rule for transitions to both nal states.
An additional important topic related to low-energy electron excitation of the RV states of H
2
involves resonance excitation, especially of the Lyman bands. We have recently published an ana-
lytic model for the n = 2 Lyman band system (B
1
Σ
u
+
→ X
1
Σ
g
+
) of H
2
(Liu etal., 2003) that is accurate
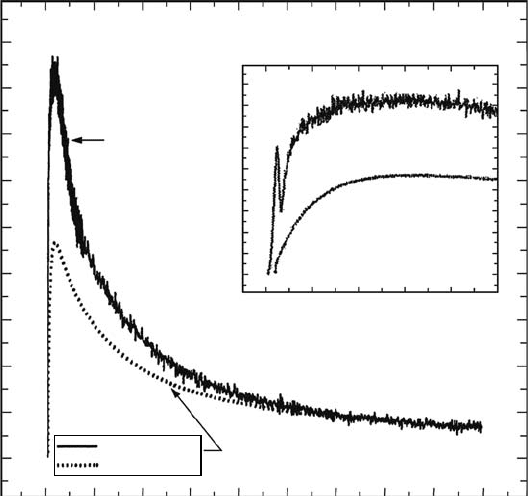
at threshold. We have shown in Figure 28.15 (inset) that for the B
1
Σ
u
+
state, the measurement of
the UV excitation function of a single rotational line of a low vibrational level (0–4) contains near
threshold structure arising from a combination of resonance, dipole-forbidden, and dipole-allowed
components. Figure 28.15 shows a measurement of the B
1
Σ
u
+
(0,4) P3 high-resolution excitation
function. The v′ = 0 excitation function is composed of three processes: (1) direct excitation (see
dotted component in Figure 28.15); (2) resonance excitation of H
2
−
autoionizing states (see rst
peak in inset at ∼13eV); and (3) a dipole-forbidden excitation from (n = 2) EF, (n = 3) GK, (n = 4)
H
−
H
1
Σ
g
+
→ B
1
Σ
u
+
gerade state cascading. The competition between UV emission production by the
band systems of the singlet states and dissociative production of fast H(1s) atoms is a very sensitive
function of electron energy in the threshold energy region of 10–50eV. This allows the mean elec-
tron impact energy to be unfolded from astronomical regimes, as was done with Voyager spectral
observations of the outer planets.
28.4.3 n
2
–euv
The strongest dipole-allowed transitions of N
2
occur in the EUV (Ajello etal., 1989b). The exci-
tation of the N
2
RV states present in the EUV and FUV (80–140nm) plays a role in establishing
1800
1600
1400
1200
1000
800
600
Observed
Direct +
cascade
B-X
Dipole-allowed
400
200
0
1800
1600
1400
1200
1000
800
600
400
200
0
10 20 30 40
Energy (eV)
50 60
0 200 400 600 800
Energy (eV)
Cross section (arb. unit)
Cross section (arb. unit)
1000 1200 1400 1600 1800
Figure 28.15 Comparison of the observed H
2
B-X dipole-allowed direct + dipole-forbidden cascade exci-
tation function for v = 0 (solid), compared to the v > 7 dipole-allowed excitation function (dotted). The inset
shows the threshold behavior of the direct excitation and total cross section. The total cross section demon-
strates the existence of resonance excitation and cascading for the low vibrational levels (0–4) near 15eV (Liu
etal.,
2003).
UV Molecular Spectroscopy from Electron Impact for Astrophysics 781
the physical composition of an N
2
-bearing atmosphere (Earth, Titan, Triton, and Pluto). The elec-
tronic transitions proceed from the X
1
Σ
g
+
ground state to nine closely spaced (12–15eV) RV states,
which are the source of the molecular emissions in the EUV observed by spacecraft (Ajello etal.,
2007). Three of these RV states, b
1
Π
u
, b′
1
Σ
u
+
, and c′
4
1
Σ
u
+
, are highly perturbed, weakly-to-strongly
predissociated, and have signicant emission cross sections (e.g., James etal., 1990). The other
two RV states, c
3
1
Π
u
and o
3
1
Π
u
, are nearly 100% predissociated by the triplet C
3
Σ
u
+
and C′
3
Π
u
states (Lewis etal., 2005). When these ve singlet-ungerade states predissociate, they eject fast
N-atoms (>1 eV) through the N(
4
S
o
) + N(
2
D
o
) and N(
4
S
o
) + N(
2
P
o
) dissociation limits located at 12.1
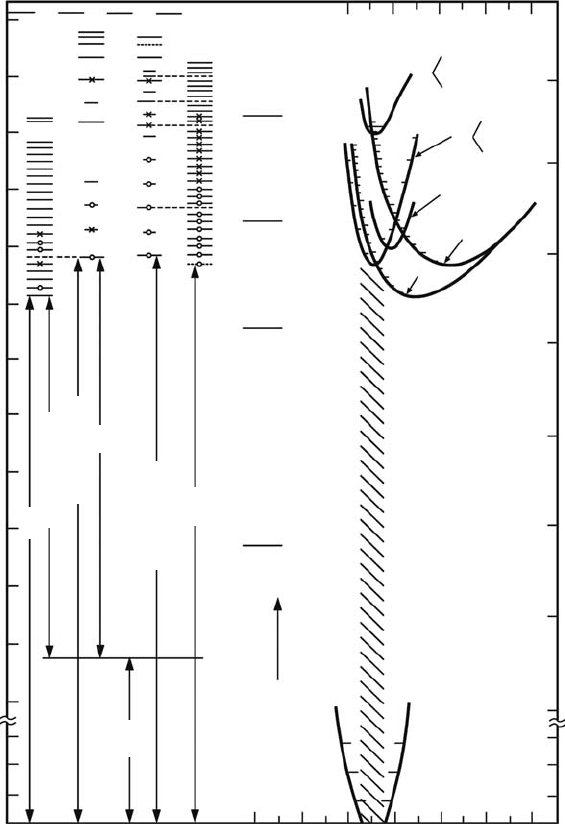
and 13.3eV, respectively. The energy level diagram of the RV states and the names of the emission
band systems are shown in Figure 28.16. Theemission spectrum of the singlet-ungerade RV states
125
120
115
110
105
100
95
90
85
80
75
70
a
1
Π
g
X
1
Σ
g
+
High Rydberg–
valence
states of N
2
3
1
2
4
S
0
+
4
S
0
4
S
0
+
2
D
0
4
S
0
+
2
P
0
2
D
0
+
2
D
0
1.0 1.2 1.4 1.6 1.8
ν
ν
b
1
Π
u
b
1
Π
u
1
Π
u
1
Σ
u
+
b΄
1
Σ
u
+
b΄
1
Σ
u
+
3p
4p
(N
2
+
A
2
Π
u
)3sσ
g
o
1
Π
u
π
u
c
3
1
Π
u
c
4
1
Π
u
σ
u
c΄
4
1
Σ
u
+
c΄
5
1
Σ
u
+
N
2
+
×
2
Σ
u
+
28
27
26
25
24
23
22
21
20
19
18
17
16
15
14
13
12
11
10
9
8
7
4
4
3
2
1
7
10
13
16
1
0
5
8
11
14
17
6
5
4
3
2
1
0
19
23
24
18
17
16
15
14
13
12
11
10
9
8
7
6
5
4
3
2
1
0
65
0
0.6 0.8 1.0 1.2
Internuclear distance (Å)
1.4 1.6 1.8
0
1
8
9
10
11
Energy (eV)
Energy (cm
–1
)
BHI
BHII
Gaydon-Herman
Worley-Jenkins
c-a
Carroll-Yoshino
LBH
Dissociation limits
12
13
14
15
Figure 28.16 Partial energy-level diagram for N
2
emphasizing the 12–15eV energy region of the RV
states. The right side of the gure shows the diabatic potential curve, and the left-hand side the observed
vibrational
levels. The circles and x’s in the gure are explained in Ajello etal. (1989b).

782 Charged Particle and Photon Interactions with Matter
displays many irregularities due to homogeneous RV interactions within the
1
Σ
u
+
and
1
Π
u
mani-
folds and
1
Σ
u
+
∼
1
Π
u
p-complex heterogeneous interactions (Liu etal., 2008). The recently revised
emission cross sections of the highly perturbed b
1
Π
u
, b′
1
Σ
u
+
, and
′
∑
+
c
4
1
u
states that are weakly-to-
strongly predissociated are large; the excitation, emission and predissociation cross sections for
the low-lying ve RV states are summarized in Table 28.2. Table 28.2 adapted from the work of
Ajello et al., 2007, including minor changes, in columns 2 to 4, respectively; and the emission cross
section from the recent higher resolution work of Ajello (2010) is given in column 5.
Ever since the Voyager 1 (V1) encounter with Saturn in 1980, the EUV airglow of Titan has
challenged attempts to explain both its spectral content and its excitation source. Because of the
similarity to optically thin laboratory spectra from electron impact on N
2
(Fischer etal., 1980;
Ajello etal., 1989b), most early analyses of the V1 UVS data argued that Titan’s EUV airglow
was dominated by the N c X
4 u g2
1 1
0 0
′
∑ ∑
+ +
→
( ) ( ) , i.e.,
′
c
4
0 0( , )
band near 95.8nm and the
′
c
4
0 1( , )
band near 98nm (Broadfoot etal., 1981a,b, Strobel and Shemansky, 1982). Though readily excited
by photoelectron impact, the earliest work on the Titan airglow noted, however, that the resonant
′
c
4
0 0( , )
band was optically thick near peak photoelectron excitation. An excitation source driven by
the Sun was therefore ruled out, since the
′
c
4
0 0( , )
emission band would be radiatively trapped, so a
magnetospheric
source near Titan’s exobase was proposed instead (Strobel and Shemansky, 1982).
The
issue was studied by Stevens etal. (1994), who developed a
′
c
4
(0, )v′′
multiple scattering
model for the terrestrial atmosphere and showed that
′
c
4
0 0( , )
should be weak or undetectable near
peak photoelectron excitation and that
′
c
4
0 1( , )
should dominate over
′
c
4
0 0( , )
. A similar analysis was
done for Titan’s airglow by Stevens (2001, 2002) and Stevens et al. (2003), who argued that
′
c
4
0 0( , )
was misidentied at Titan and two prominent N I multiplets (95.2 and 96.4nm) produced primarily
by photodissociative ionization (PDI) of N
2
were present instead. This meant that the Titan EUV
dayglow could be excited exclusively by the Sun. The key N I emissions that could not be conclu-
sively identied by UVS because of its low spectral resolution (3nm) have now been identied with
the
higher spectral resolution (0.56
nm)
of the UVIS instrument on the Cassini spacecraft.
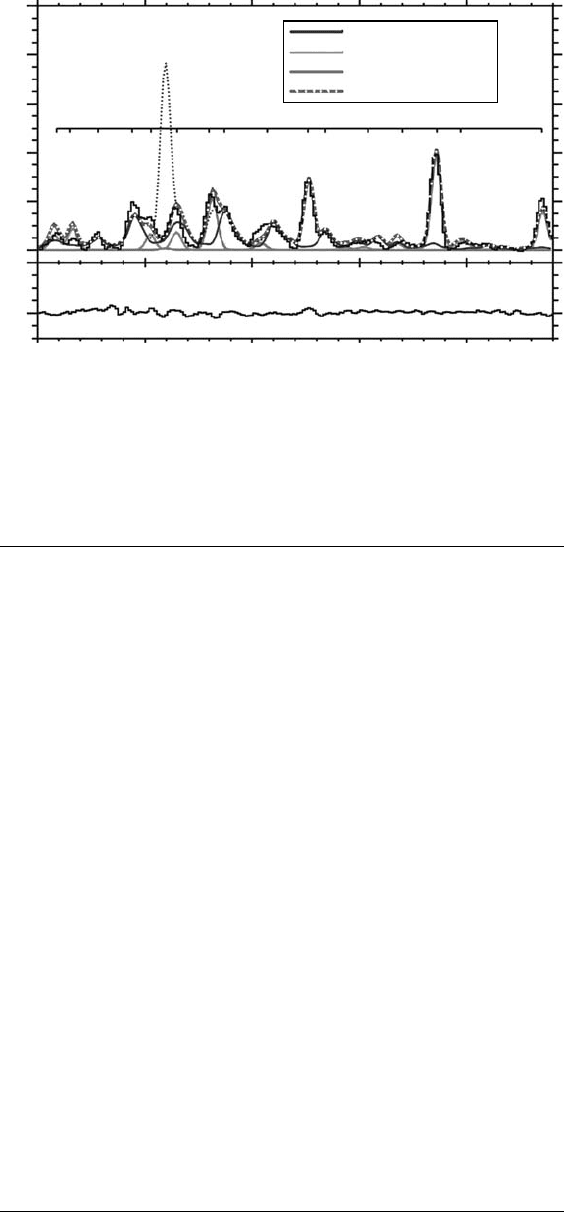
The
UVIS disk-averaged dayglow spectrum in the spectral range 90–114nm is shown in Figure
28.17 (top panel) at 0.56nm FWHM. The 16 indicated dayglow features are identied in Table
28.3. The identications are based on the work of Ajello etal. (1989b), James etal. (1990), and
table 28.2
the
Cross s
ections
for l
ow
l
ying
Five rv s
tates
of n
2
state Q
ex
(10
–19
cm
2
) Q
em
(10
–19
cm
2
) Q
pre
(10
–19
cm
2
) Q
f
em
(10
–19
cm
2
)
c′
4
1
Σ
u
+
158
a,b,d
125
a,c,d
34
a,b,c
122
f
b′
1
Σ
u
+
128
a,e
15.5
a
112.5
a,e
19.3
f
b
1
Π
u
121
a
6.1
a
115
a
8.4
f
c
3
1
Π
u
161
a
0
a
161
a
7.4
f
o
3
1
Π
u
75
a
0
a
75
a
5.7
f
Totals 643 147 497 163
f
Note: Predissociation (fast N I atom) yield (Q
pre
/Q
ex
) = 497/643 = 77% and EUV photon
yield
= 23% (Ajello etal., 2007, columns 2–4).
a
Where Q
ex
= Q
em
+ Q
pre
.
b
v′ = 0 at 150K, η
pre
(
′
c
4
) = 23%, at 300K, η
pre
(
′
c
4
) = 26%, where η is predissociation yield.
c
Includes additional
′
c
4
(0,v″ = 6–12) bands (Bishop et al., 2003; Ajello etal., 2007).
d
Includes revised Q
ex
(v′ = 0) = 125 (units of 10
−19
cm
2
).
e
b′
1
Σ
u
+
value based on correction to v′ = 9 and 11 emission cross sections (Walters etal., 1994;
Ajello
etal., 2007).
f
Preliminary high resolution emission cross sections (Ajello, 2010) in column 5.
UV Molecular Spectroscopy from Electron Impact for Astrophysics 783
1.0
0.8
0.6
0.4
0.2
0.0
0.2
Night
Day
1 2 3 4 5 6 7 8 9 1011 12 13 14 15 16
December 13, 2004
Lab–c΄(0,0–2); 8.7 R
900 950 1000
Wavelength (Å)
1050 1100
0.0
c
4
΄(0,0–2): 1.6 R
Composite: 17.5 R
N I and N II: 5.5 R
Figure 28.17 (Top panel) Regression analysis to UVIS dayglow spectrum from December 13, 2004. The
regression model t consists of three independent vectors: (1) an optically thin 20 eV electron-impact lab
uorescence spectrum, with
′
c
4
(0,0) dotted; (2) the calculated multiple scattered emergent spectrum of the
′
c
4
(0,v″ = 0–2) progression transmitted through an optically thick medium; and (3) a spectrum of N I and N II
emissions
(Ajello etal., 2007). (Lower panel) Cassini UVIS nightglow spectrum.
table 28.3
identication
of s
trongest
t
itan
d
ayglow
e
mission
Features
from
Cassini uvis on d
ecember
13, 2004
Feature λ (Å) 4πI
b,c
(r) identication
a
1 909 0.50
c′(4,1),
N(
4
S-
4
P), b′(16,2), b′(12,1)
2 915 0.32 N(
3
P-
3
P
o
)
3 928 0.41
b′(9,1),
c′(6,4)
4 944 1.56
c′(4,3), c′(3,2), b′(9,2), c′(6,5), b′(16,4)
5 953 0.84 N(
4
S
o
-
4
D), N(
4
S
o
-
4
P)
6 965 1.39
c′((1,1),
N(
4
S
o
-
4
P), c′(3,3), c′(4,4)
7 980 1.47
c′(0,1)
8 987 1.45
c′(3,4),
c′(4,5), c′(6,7)
9 1007 1.46
c (′0,2), c′(3,5), c′(4,6), b(1,1), c′(6,8), b′(9,5)
10 1026 1.71
H
Ly-β
11 1034 0.46
b(1,2), b′(9,6)
12 1054 0.56
N(
2
D
o
-
2
P), b′(11,7), b(1,3), b′(3,5)
13 1070 0.33 N(
2
D
o
-
2,4
D), N(
2
D
o
-
2,4
P)
14 1086 2.31 N
+
(
3
P-
3
D
o
)
15 1118 0.51
N(
2
D
o
-
2
D), N(
2
D
o
-
2
P), b′(9,9)
16 1135 1.33 N(
4
S
o
-
4
P)
Source: Ajello,
J.M. etal., Geophys. Res. Lett., 34, L24204, 2007.
a
Identications from Ajello etal. (1989b), James etal. (1990), Bishop and Feldman
(2003),
and unpublished high-resolution (0.2
Å
FWHM) laboratory spectra.
b
Total observed EUV integrated disk intensity (900–1140Å) in Rayleighs (R) is 16.6 R.
c
VI UVS: UVIS comparison; total observed UVIS intensity (920–1015Å) is 8.6 R vs.
total
modeled
VI
intensity 920–1015
Å
is 20.9 R.

784 Charged Particle and Photon Interactions with Matter
unpublished, laboratory high-resolution spectra Ajello (2010), as well as the terrestrial airglow spectra
of Bishop and Feldman (2003). Laboratory spectra (0.02nm FWHM) have shown the presence of
about 200 spectral features from electron-excited N
2
over the same EUV spectral range (Ajello
etal., 2009). On average, there are some 10 emissions for each feature number in Figure 28.17 (top
panel); we list only the strong ones in Table 28.3. The strongest is feature number 14, the N II multi-
plet (
3
P-
3
D
o
) near 108.5nm with an intensity of 2.3 Rayleigh (R). Whereas Voyager 1 only observed
a few blended EUV features, the UVIS dayglow spectrum indicates 16 features, with the
′
c
4
0 0( , )
band conspicuous by its absence. For completeness, the nightglow spectrum is included in the lower
panel
of Figure 28.17.
There
have been no high-resolution (<0.01 nm FWHM) laboratory studies of the optically thin,
electron-impact N
2
uorescence EUV spectrum from 50 to 120 nm since the medium-resolution
(0.03nm FWHM) study 20 years ago (Ajello etal., 1989b). ESL’s effort for higher resolution
(FWHM ≈ 0.002–0.010 nm) studies is now underway. Our more recent high-resolution labora-
tory measurements have found a total of nine RV states contributing to the N
2
EUV emission
spectra from 80 to 140 nm; see Table 28.4 (Ajello, 2010). These states have principal quantum
numbers through n = 6 and contribute to the emission and predissociation cross sections of N
2
in the EUV.
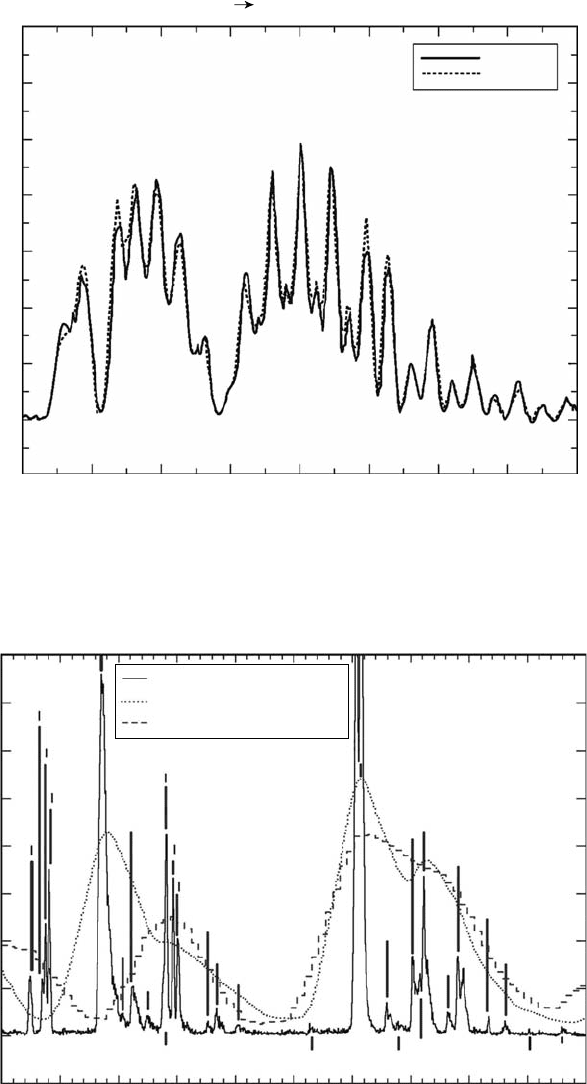
We show examples of high-resolution laboratory spectrum measured at ESL in Figures 28.18
and 28.19. Figure 28.18 shows the
′
→
∑ ∑
+
c ( 0) X 1)
u g4
1 1
v
′ = ′′ =
+
(
v
band model at 98nm (Liu
etal., 2008), the strongest band in the Titan EUV airglow (i.e., feature 7 in Figure 28.17a). The
′
c
4
0 1( , )
band analysis was used to determine predissociation yields for each rotational level and
a band transition moment. There are now full spectral models for the rotational structure of the
′
∑ ∑
+ +
c (
0) X ( 0,1,2)
1
u
1
g4
v v
′ = → ′′ =
progression at 95.9, 98.0, and 100.3nm (Stevens, 2001; Liu
et al., 2005, 2008) with which we can synthesize optically thick photoelectron-excited spectral
lines using a multiple scattering model. Figure 28.19 shows a medium-resolution laboratory spec-
trum (0.02nm FWHM) at both 20 and 100eV compared to a Cassini EUV (90–115 nm) spectrum
(dashed-line) indicating that there are many N
2
bands (approximately 200) contributing to each of
the observed 16 Cassini features in Table 28.3. At this point, it is necessary to study the rotational
cross sections and predissociation yields of the strongest remaining vibrational band features identi-
ed
in Table 28.3.
table 28.4
list
of n
2
rydberg and valence electronic
band
s
ystems
o
bserved
in euv s
pectra
of
electron-
impact-induced
Fluorescence
electronic transition T
e
(cm
−1
)
b′
1
Σ
u
+
→ X
1
Σ
g
+
-valence
104,498
b
1
Π
u
→ X
1
Σ
g
+
-valence
101,675
′
c
4
3pσ
1
Σ
u
+
→ X
1
Σ
g
+
Rydberg
104,519
o
3
3sσ
1
Π
u
→ X
1
Σ
g
+
-core excited
105,869
′
c
5
4pσ
1
Σ
u
+
→ X
1
Σ
g
+
115,876
′
c
6
5pσ
1
Σ
u
+
→ X
1
Σ
g
+
—
c
3
3pπ
1
Π
u
→ X
1
Σ
g
+
104,476
c
4
4pπ
1
Π
u
→ X
1
Σ
g
+
115,636
c
5
5pπ
1
Π
u
→ X
1
Σ
g
+
—
Source: Ajello, J.M. High resolution spectra of N
2
, 2010, in
preparation. See Huber and Herzberg, 1979 for elec-
tronic
energies of each state.
UV Molecular Spectroscopy from Electron Impact for Astrophysics 785
7000
6000
5000
4000
3000
2000
1000
0
–1000
979.9 980.1 980.3 980.5 980.7
Wavelength (Å)
Relative intensity (arb. units)
R(14–21); R(9)b΄
R(10–13; 22, 23)
R(10)b΄; R(7, 8, 9)
R(6)
R(4)
R(5)
R(3)
R(2)
R(1)
R(0)
P(1)
P(2)
P(3)
P(5)
P(4)
Observed
Model
(Δλ = 33 mÅ, E = 100 eV, T = 260 K)
e + N
2
c΄
4
1
Σ
u
+
(0) –X
1
Σ
g
+
(1)
P(6)
P(8)
P(7)
P(9)
P(13)
P(12)b΄
P(14)
P(15)
P(16)
P(17)
P(18)
P(19)
P(20)
P(10)
P(11), P(12)
980.9 981.1 981.3 981.5
Figure 28.18 Comparison of the high-resolution laboratory and close-coupled-Schrödinger spectral
model for the
′
c
4
(0)-X(1) transition rotational structure to obtain predissociation yields and diabatic transition
moments
(Liu etal., 2008).
2.4
2.1
1.8
1.5
N
N
N
c
΄
(1,1)
c
΄
(0,0)
c
΄
(0,1)
N
N
100 eV N
2
lab spectrum
20 eV N
2
lab spectrum
Cassini Titan December 13, 2004
N
N
1.2
0.9
0.6
0.3
–0.3
950 955 960 965 970
Wavelength (Å)
Relative intensity (arb. units)
975 980 985 990 995 1000
0.0
c
3
(1,1)
c
΄
(2,2)
c
΄
(3,3) b
΄
(11,4)
c
΄
(2,3)
b
΄
(18,7)
b
΄
(11,5)
b(1,0)
b΄(6,2)
c
΄
(6,6)
c
΄
(1,2)
c
΄
(3,4)
c
΄
(4,5)
c
΄
(6,7)
b
΄
(12,5)
b΄(16,6)
o
3
(1,3)
b
΄
(12,4)
Figure 28.19 Medium-resolution spectrum of e + N
2
at 0.2Å FWHM 100eV and 0.6Å FWHM at 20eV
compared to the Cassini UVIS spectrum of December 13, 2004 at 4 Å FWHM. The identication of the
molecular
and atomic features is from Ajello (2010).
786 Charged Particle and Photon Interactions with Matter
Additionally, the low temperature of Titan’s atmosphere prompts the need for laboratory mea-
surements of cross sections at low temperatures from 120K found near the mesopause (500km) to
186K at the exobase at 1400km (Wilson and Atreya, 2005). We have perfected expansion cooling of
molecules through effusive nozzle for molecular-beam–electron-beam interaction to match Titan’s
atmospheric
temperatures (Ajello etal., 1998a) and intend to carry out such studies.
28.4.4 n
2
–fuv
A variety of space missions have been own to observe terrestrial N
2
emissions in the FUV spectral
regime. These include the MSX, TIMED, POLAR, IMAGE, and DMSP satellites. Moreover, solar
UV spectral irradiance measurements, important for establishing the radiative energy input to the
Earth’s upper atmosphere, are currently being obtained by instruments on board the TIMED and
SORCE satellites. This suite of instruments allows the interaction between the Sun and the Earth to
be studied in unprecedented detail over a solar cycle.
The measurement goals of these missions are to achieve an accuracy of better than 10% in
dening the atmospheric parameters (temperature, composition, density, etc.) on a global scale
and to determine radiative, chemical, and dynamical energy sources. For remote sensing of the
upper atmosphere, there are four principal wavelength intervals in UV imaging satellites that
have been used to observe the distribution of N
2
and O. Typical of these bands are those of the
Global UltraViolet Imager (GUVI) instrument on TIMED: O I (130.4nm), O I (135.6nm), N
2
(141–
153nm), and N
2
(167–181 nm). The latter two wavelength intervals are referred to as Lyman–Birge–
Hopeld (LBH) short (LBH
S
) and LBH long (LBH
L
), respectively. They arise from the transition
of N
2
(a
1
Π
g
→ X
1
Σ
g
+
). As an example, we show in Figure 28.20 an MSX FUV auroral spectrum
(Paxton and Meng, 1999) with the LBH bands and atomic oxygen emissions indicated. Because
of their importance in atmospheric remote sensing, we review the current understanding of LBH
excitation
and emission processes in some detail in this chapter.
The
analysis of the remote sensing spectra aimed at unraveling the behavior of the major constitu-
ents of the upper thermosphere, N
2
, O
2
, and O, and the auroral energy input depends on the details of
the N
2
LBH, and O emission cross sections, as well as the absorption cross section of O
2
. The funda-
mental excitation and emission processes involved for N
2
and O and their cross section denitions are
1. e
−
(E
e
) + N
2
→ e
−
(E
e
− ΔE
e
) + N
2
* → e
−
+ N
2
+ hν (a
1
Π
g
− X
1
Σ
g
+
)
• σ
ex
(LBH) is the cross section for direct excitation of the optically forbidden (τ ∼ 55μs)
a
1
Π
g
− X
1
Σ
g
+
LBH band system from 120 to 210nm, including LBH
S
(141–153nm) and
LBH
L
(167–181 nm).
2. e
−
(E
e
) + N
2
→ e
−
(E
e
− ΔE
e
) + N
2
* → e
−
+ N
2
+ hν (a′
1
Σ
u
and w
1
Δ
u
→ a
1
Π
g
)
• σ
casc
(LBH) for cascade emission from optically forbidden (τ > 1 ms) cascade transitions
(a′
1
Σ
u
and w
1
Δ
u
→ a
1
Π
g
) to the LBH band system.
3. e
−
(E
e
) + O → e
−
(E
e
− ΔE
e
) + O* → e
−
+ O + hν (
3
P
2
→
5
S
2
o
at 135.6nm)
• σ
ex
for optically forbidden emission (τ ∼ 180μs) of OI (135. 6nm).
4. e
−
(E
e
) + O → e
−
(E
e
− ΔE
e
) + O* → e
−
+ O + hν (3s
5
S
2
o
→ 3p
5
P
1,2,3
and 3s
3
S
1
o
→ 3p
3
P
0,1,2
)
• σ
casc
(O I) for dipole-allowed hν (τ ∼ 1−10ns) of O I (777.4 and 844.6nm and higher
order
states).
The
history of LBH cross sections by electron-impact measurements was reviewed by van der Burgt
etal. (1989) and (Meier, 1991). Shown in Table 28.5 are the N
2
LBH cross section data reported in
the literature. There are considerable differences among the cross sections, with values for direct
excitation to the a-state differing by almost a factor of two in some cases. The discrepancies could be
due to experimental limitations in fully capturing the long-lived emitting states, improper account-
ing of cascade contributions, or both. The shape of the excitation function peaking at about 18eV
was measured by Ajello and Shemansky (1985). This has been the standard cross section used in the
UV Molecular Spectroscopy from Electron Impact for Astrophysics 787
Aeronomy community since then. But recent remeasurements by Johnson et al. (2005b) and Young
et al. (2010) found the peak nearer 20 eV, with a different energy function. The implications of the
new
measurement are discussed below.
Strickland
etal. (1995) have shown that satellite observations of the thermospheric ratio of O I
135.6 to N
2
LBH are closely related to the O/N
2
column density ratio, which itself is a good indicator
of thermospheric dynamical conditions, especially during geomagnetic storms (Meier etal., 2005;
Crowley and Meier, 2008). The N
2
LBH cross sections of Ajello and Shemansky (1985 or AS85) have
been extensively used in establishing this relationship. Various modelers have scaled the AS85 cross
section by as much as a factor of 2 both to adjust for revisions in the absolute standard for the measure-
ments of direct excitation to the a-state and to account for the estimated effects of cascade to the a-state
from the a′
1
Σ
u
and w
1
Δ
u
states (Meier, 2008). Because of the importance of the LBH cross section to
remote sensing, we review the basis of Meier (2008) for estimating the best cross section to use until
new measurements become available.
AS85 obtained a value of 3.02 × 10
−17
cm
2
at 18eV for the peak excitation cross section from a
model t to the laboratory data (their Table 5a, column 2). They found that predissociation accounts
4000
3000
2000
1000
0
80
60
40
20
0
120
5 10 15 20 25 30
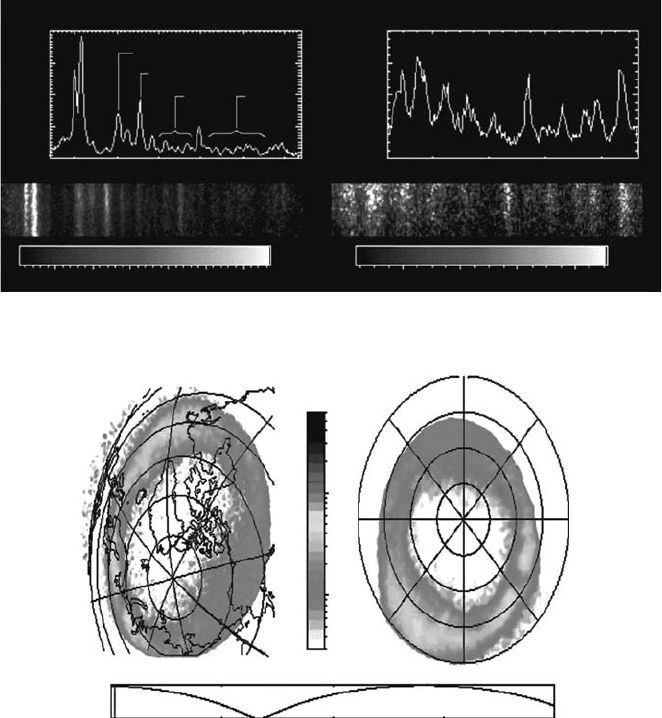
Polar LBH L image
Ultraviolet imager 01 Mar 99 00:10:22 UT
12
60
6
70
80
18
0
100
10
Geographic Lat/Lon
Apex MLat/MLT
9.0
1.8
00:00
(b)
(a)
06:00 12:00 18:00 23:59
GC Alt
Photon cm
–2
s
–1
10
2
10
1
2 4 6 8
180 200 220 240
OI 130.4 nm
SPIM1. Filter1. 40× 272.2 Hz. mixed; 164/886; MP= 19 SPIM2. Filter1. 40 × 272.2 Hz. mixed; 164/886; MP = 19
OI 135.6 nm
LBH S
LBH L
130 140 150 160 170
Figure 28.20 (a) MSX FUV spectrum showing N
2
LBH and OI multiplets (Fischer et al., 1980);
(b)POLARspacecraft image of LBH image. Note that for GUVI, the LBHL band covers 167–181nm (Paxton
and
Meng, 1999).

788 Charged Particle and Photon Interactions with Matter
for a loss of 12.29% of all excitations to the a-state; the emission branching ratio for total emission
is therefore 0.8771 (ignoring vibrational/rotational dependence). To calibrate their emission cross
section measurements, AS85 used as their standard, the cross section for electron impact on H
2
yielding H Lyman alpha. AS85 adopted a cross section of 0.818 × 10
−17
cm
2
at 100eV (or 0.578 ×
10
−17
cm
2
at 200eV). More recently, Liu etal. (1998) measured an H
2
Lyman alpha cross section of
0.716 × 10
−17
cm
2
(near the value of 0.703 × 10
−17
cm
2
recommended by McConkey etal. (2008)).
Consequently, we reduce the AS85 peak LBH excitation cross section to 2.64 × 10
−17
cm
2
(=3.02 ×
0.716/0.818).
For emission without cascade, this becomes 2.64 × 10
−17
× B = 2.32 × 10
−17
cm
2
.
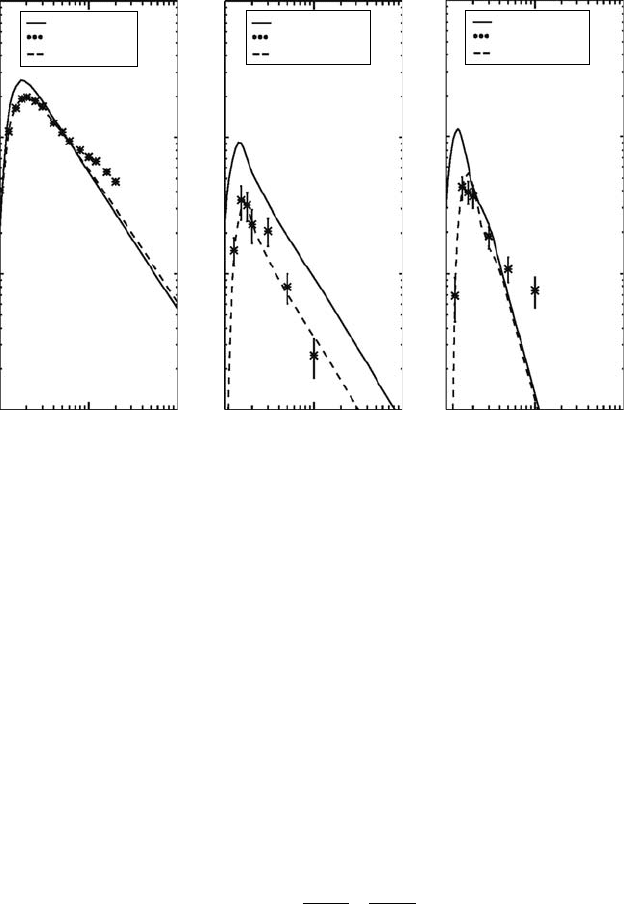
Figure 28.21 shows the electron impact cross sections for excitation of a, a′, and w states. The
scaled AS85 cross section is shown as a solid line, and the data of Young et al. are given by the
individual points. The dashed line is a t to the Young et al. data obtained by scaling and stretch-
ing the AS85 energy function. The Cartwright et al. (1977) a′ and w cross sections, often used for
dayglow modeling (Strickland et al. 1999), are shown as solid lines. More recently, Johnson et al.
(2005b) have remeasured these cross sections, nding them to be lower than Cartwright et al. Their
data are plotted as asterisks. The dashed line is an attempt to t the Young et al. data by adjusting
the Cartwright et al. energy function. The dashed lines in Figure 28.21 do not t the data very well
for energies greater than about 60eV, but they should be sufciently accurate for dayglow modeling
because the photoelectron uxes peak at much lower energies.
It has been known (at least) since the work of Freund (1972) that cascade takes place between
the a
1
Π
g
state and both the a′
1
Σ
u
and w
1
Δ
u
states. Later evaluations of cascade were published by
Cartwright (1977, 1978) and Eastes (2000). Both Cartwright and Eastes carried out detailed calcu-
lations of the interactions among the various states, including laddering back and forth, enhanced
ground state vibrational populations, threshold effects, etc. Because a correct calculation of the a
1
Π
g
table 28.5
Comparison
of n
2
lbh Cross sections (in units of 10
−17
cm
2
)
reference
peak excitation
Cross section
Cascade Contribution
estimates (% of
excitation)
peak emission Cross
section, including
Cascades estimate
Ajello
(1970) PE 3.85
Brinkmann
and
Trajmar
(1970) ES 4.50
Cartwright
(1977;1978) ES 2.72, 3.02
a
73 4.63
Ajello
and Shemansky (1985) PE 2.65
b
Not observed 2.35
Mason
and Newell (1987) MP 3.50
Brunger and
Teubner
(1990) ES 4.24
Eastes and Dentamaro (1996),
Eastes
(2000) model
3.02 55 4.15
Budzien etal. (1994) 2.70 45 3.50
Strickland etal. (2004) estimate 2.71 40 3.79
Campbell
etal. (2001) 4.69
Johnson etal. (2005) EI 2.10
Meier (2008) model analysis 2.64 74 4.08
Young et al. (2010)
Present estimate
1.98 29–48 2.22–2.57
1.98 31 2.28
Note:
PE: photoemission measurement, MP: metastable particle measurement, ES: electron scattering,
EI:electron impact.
a
This value is the result of a scaling by a factor of 0.90 following the work of Trajmar etal. (1983).
b
This value is the result of a scaling by a factor of 0.875 due to the reevaluation of the H Lyman-α standard
(van
der Burgt etal., 1989).
UV Molecular Spectroscopy from Electron Impact for Astrophysics 789
population rate, including interactions with the a′
1
Σ
u
and w
1
Δ
u
states is very involved, it is useful to
derive an effective emission cross section to correct the direct a
1
Π
g
population rate for the effects of
cascade. This has been a common approach where a fully developed cascade model is computation-
ally
prohibitive for routine processing of satellite databases.
Because
transitions of a′ and w to the X-state of N
2
are forbidden, we assume that all excitations
of these states end up as a-state emissions. The total volume emission rate from the a-state (ignor-
ing the details of populating the individual vibrational states) can be written as the product of the
excitation
(population) rates and the branching ratio, B, for emission:
j z Bj z Bj z Bj z
em
a
ex
a
ex
a
ex
w
( ) ( ) ( ) ( )= + +
′
(28.11)
where j is the number of emissions (excitations) cm
3
/s and B is the branching ratio for emission
(1 –the probability of predissociation). Equation 28.11 can be rewritten as
j z Bj z
j z
j z
j z
j z
em
a
ex
a
ex
a
ex
a
ex
w
ex
a
( ) ( )
( )
( )
( )
( )
= + +
1
′
(28.12)
If the a, a′, and w volume excitation rates have similar altitude dependences, the quantity in brackets
is
constant. (See below for more details on this assumption.)
The
direct volume excitation rate is the product of the excitation rate (g-factor) per second per
molecule
and the N
2
number density, n:
j z g z n z
ex ex N
( ) ( ) ( )=
2
(28.13)
with
the g-factor dened as
g z E F E dE
ex ex
( ) ( ) ( )=
∫
σ
(28.14)
Energy (eV)
10
–16
a-state
AS85 scaled
Young et al.
Fit
Cartwright
Johnson et al.
Fit
Cartwright
Johnson et al.
Fit
a'-state w-state
10
–17
10
–18
10
–19
10 100 1000
Energy (eV)
10 100 1000
Energy (eV)
10 100 1000
Excitation cross section (cm
2
)
Figure 28.21 Electron impact excitation cross sections relevant to the N
2
Lyman-Birge-Hopeld band
system (a
1
Π
g
→ Χ
1
Σ
g
+
) in nitrogen atmospheres. Left panel: direct excitation to the a-state. Middle panel: exci-
tation
to the cascading a′-state. Right panel: excitation to the cascading w-state. See text for details.