IEA Statistics. Coal Information 2011
Подождите немного. Документ загружается.


IV.92 - COAL INFORMATION (2011 Edition) PART IV
(million tonnes) Average annual
percent change
1978 1990 2000 2005 2007 2008 2009 78-90 90-09
Steam coal 0.37 1.82 1.85 2.15 2.37 2.16 1.59 14.21 -0.72
Total electricity and heat 0.00 1.42 1.42 1.89 1.98 1.74 1.20 83.11 -0.89
Main activity producers 0.00 1.37 1.36 1.84 1.94 1.70 1.16 82.59 -0.88
Autoproducers - 0.05 0.06 0.04 0.04 0.04 0.04 - -0.95
Patent fuel/BKB plants - - - - - - - --
Coke ovens - - - - - - - --
Blast furnace inputs - - - - - - - --
Gas manufacture - - - - - - - --
Industry 0.04 0.21 0.31 0.21 0.36 0.40 0.36 15.22 2.96
Iron and steel 0.01 - - 0.00 0.09 0.18 0.11 - -
Chemical - 0.01 0.06 0.04 0.02 0.02 0.02 - 5.10
Non-metallic minerals 0.02 0.20 0.17 0.09 0.16 0.14 0.14 21.10 -1.72
Paper, pulp and print - 0.00 0.09 0.09 0.10 0.06 0.09 - 22.11
Other industry 0.00 - - - - 0.00 0.00 - -
Res, comm & pub serv
(1)
0.32 0.19 0.08 0.05 0.03 0.01 0.02 -4.28 -11.10
Non-energy use - 0.00 0.00 0.00 0.00 0.00 0.00 - -3.58
Coking coal 2.01 2.34 1.88 1.90 1.90 1.86 1.69 1.28 -1.68
Total electricity and heat
- - - - - - - --
Main activity producers
- - - - - - - --
Autoproducers
- - - - - - - --
Patent fuel/BKB plants
- - - - - - - --
Coke ovens
2.01 2.34 1.88 1.90 1.90 1.86 1.69 1.28 -1.68
Blast furnace inputs
- - - - - - - --
Gas manufacture
- - - - - - - --
I
ndustry
- - - - - - - --
Iron and steel
- - - - - - - --
Chemical
- - - - - - - --
Non-metallic minerals
- - - - - - - --
Paper, pulp and print
- - - - - - - --
Other industry - - - - - - -
--
Res, comm & pub serv
(1)
- - - - - - - --
Non-energy use
- - - - - - - --
Brown coal 2.99 2.50 1.38 1.28 0.10 0.09 0.08 -1.47 -16.63
Total electricity and heat 2.03 2.13 1.23 1.14 - - - 0.43 -
Main activity producers 1.99 2.08 1.19 1.12 - - - 0.37 -
Autoproducers 0.04 0.05 0.04 0.02 - - - 2.75 -
Patent fuel/BKB plants - - - - - - - --
Coke ovens - - - - - - - --
Gas manufacture 0.03 - - - - - - --
Industry 0.21 0.15 0.11 0.13 0.09 0.09 0.08 -2.72 -3.45
Iron and steel 0.01 - - - - - - --
Chem
ical 0.00 - - - - - - --
Non-metallic minerals 0.01 0.01 0.04 0.07 0.09 0.09 0.08 2.69 10.71
Paper, pulp and print 0.15 0.13 0.07 0.06 0.00 - - -1.05 -
Other industry 0.03 0.00 - - - - - -15.69 -
Res, comm & pub serv
(1)
0.63 0.22 0.05 0.01 0.00 0.00 0.00 -8.51 -20.17
Non-energy use - - - - - - - --
(1) Residential, commercial and public services.
* Please refer to notes and definitions in Part I.
Source: IEA/OECD Energy Statistics of OECD Countries
AUSTRIA
6. Use of coal for selected end-uses*
INTERNATIONAL ENERGY AGENCY

COAL INFORMATION (2011 Edition) PART IV - IV.93
1978
(1)
1980 1990 2000 2006 2007 2008 2009 2010
(US dollars / tce)
For electricity generation
Steam coal 173.19 176.96 80.98 56.94 98.23 101.93 129.35 141.37 124.64
Heavy fuel oil 69.15 120.07 92.64 51.28 164.85 160.66 249.60 153.71 191.32
Natural gas 74.24 164.82 115.57 .. .. .. .. .. ..
For industry
Steam coal 90.20 119.83 78.84 54.73 181.33 203.12 249.48 243.64 236.50
Coking coal .. .. .. .. .. .. .. .. ..
High sulphur fuel oil 74.62 131.06 87.74 .. .. .. .. .. ..
Low sulphur fuel oil .. .. .. 128.14 305.62 346.28 490.10 355.95 438.29
Natural gas 73.76 118.88 121.26 .. .. .. .. .. ..
(Euro / unit)
(2)
For electricity generation
Steam coal 172.67 157.05 63.15 58.33 73.92 70.25 83.53 96.07 88.84
Heavy fuel oil 100.14 154.79 104.94 76.31 180.19 160.84 234.14 151.74 198.10
Natural gas 100.80 199.20 122.74 .. .. .. .. .. ..
For industry
Steam coal 93.75 110.87 64.10 58.45 142.25 145.95 167.96 172.62 175.75
Coking coal .. .. .. .. .. .. .. .. ..
High sulphur fuel oil 108.06 168.96 99.39 .. .. .. .. .. ..
Low sulphur fuel oil .. .. .. 190.67 334.05 346.68 459.75 351.38 453.82
Natural gas 100.14 143.67 128.78 .. .. .. .. .. ..
(1) Earliest year for which split by coal type is available.
(2) For steam coal, coking coal and heavy fuel oil per metric tonne; for natural gas per 10
7
kilocalories GCV.
* Please refer to notes and definitions in Part I.
Source: IEA/OECD Energy Prices & Taxes
1973 1980 1990 2000 2006 2007 2008 2009 2010e
Total imports 4.38 4.01 4.54 4.38 5.41 5.85 5.57 3.99 4.44
Hard coal 2.87 2.71 3.53 3.32 4.02 4.32 3.99 3.07 3.10
Coking coal .. 2.23 2.36 1.72 1.79 1.84 1.92 1.65 1.82
Steam coal .. 0.48 1.18 1.60 2.23 2.48 2.07 1.42 1.27
Brown coal 0.20 0.12 0.01 0.03 0.08 0.07 0.08 0.07 0.07
Peat - - - - - - - - -
Coal products
(1)
1.31 1.18 0.99 1.03 1.31 1.46 1.51 0.85 1.28
Total exports 0.08 0.01 0.00 0.07 0.05 0.03 0.00 0.02 0.01
Hard coal - - - - - 0.00 0.00 - -
Coking coal .. - - - - - - - -
Steam coal .. - - - - 0.00 0.00 - -
Brown coal 0.00 0.01 0.00 - - - 0.00 0.00 -
Peat - - - - - - - - -
Coal products
(1)
0.08 0.00 0.00 0.07 0.05 0.02 - 0.02 0.01
(1) Coal products includes products derived from coal, for example: coke, coal tar, briquettes, patent fuels.
* Please refer to notes and definitions in Part I.
Source: IEA/OECD Energy Balances of OECD Countries, IEA/OECD Energy Statistics of OECD Countries
AUSTRIA
7. Fuel prices to end users*
8. Coal and peat trade by type of coal*
(Mtce)
INTERNATIONAL ENERGY AGENCY

IV.94 - COAL INFORMATION (2011 Edition) PART IV
1978
(1)
1985 1990 1995 2000 2007 2008 2009 2010e
Hard Coal 2307 3599 3609 2994 3409 4426 4063 3146 3166
Coking Coal 2006 2483 2376 1778 1738 1859 1931 1661 1838
Australia - - - - - - - - -
Canada - - - - - - - - -
Czech Republic 662 652 746 - 1187 849 1044 1003 -
Germany 205 147 - - - - - - -
Poland 470 784 566 1778 551 605 377 372 -
United Kingdom - - - - - - - - -
United States - 503 456 - - 405 510 286 -
Other OECD - - - - - - - - -
China, People's Rep. - - - - - - - - -
Colombia - - - - - - - - -
Indonesia - - - - - - - - -
South Africa - - - - - - - - -
Former Soviet Union
(2)
669 397 -------
Russian Federation
(3)
- - 608 - - - - - -
Other FSU
(3)
- - - - - - - - -
Venezuela - - - - - - - - -
Vietnam - - - - - - - - -
Non-specified/other - - - - - - - - 1838
Steam coal 301 1116 1233 1216 1671 2567 2132 1485 1328
Australia - 66 - - - - - - -
Canada - - - - - - - - -
Czech Republic - - - 15 307 909 944 657 482
Germany 8 57 29 10 6 26 28 21 5
Poland 260 949 1189 1087 1358 1448 1050 730 165
United Kingdom - - - - - - - - -
United States - 19 - - - 55 - - 540
Other OECD - - 9 9 - 1 16 11 2
China, People's Rep. - - - - - - - - -
Colombia - - - - - - - - 16
Indonesia - - - - - - - - -
South Africa - - 6 95 - - - - -
Former Soviet Union
(2)
33 - -------
Russian Federation
(3)
- - - - - 121 - - 97
Other FSU
(3)
- - - - - 7 53 37 1
Venezuela - - - - - - 41 29 20
Vietnam - - - - - - - - -
Non-specified/other - 25 - - - - - - -
(1) Earliest year for which split by coal type is available.
(2) For years prior to 1990, or if no details for individual Former Soviet Union republics.
(3) Data for former republics are not available separately for some OECD member countries.
* Please refer to notes and definitions in Part I.
Source: IEA/OECD Coal Statistics
AUSTRIA
9. Hard coal imports by origin*
(thousand tonnes)
INTERNATIONAL ENERGY AGENCY

COAL INFORMATION (2011 Edition) PART IV - IV.95
1990 1995 2000 2005 2006 2007 2008 2009 2010
Coking coal
(1)
.. 214.20 68.06 85.39 206.11 .. 307.83 295.92 289.94
Imports from:
Australia .. .. .. .. .. .. .. .. ..
Canada .. .. .. .. .. .. .. .. ..
Czech Republic .. .. .. 242.07 206.11 .. .. .. ..
Poland .. .. .. .. .. .. .. .. ..
United States .. .. .. .. .. .. .. .. ..
China .. .. .. .. .. .. .. .. ..
Colombia .. .. .. .. .. .. .. .. ..
South Africa .. .. .. .. .. .. .. .. ..
Former Soviet Union
(2)
.. .. .. .. .. .. .. .. ..
Steam coal
(3)
.. 66.80 44.57 116.18 106.63 114.81 170.22 148.12 161.66
Imports from: .. .. .. .. .. 135.44 .. .. ..
Australia .. .. .. 406.70 401.61 .. 321.27 .. ..
Canada .. 63.72 43.50 129.52 115.10 116.79 165.34 144.57 152.93
Czech Republic .. 73.62 45.11 100.29 95.32 106.74 165.52 133.63 138.27
Poland .. .. .. 155.09 141.99 159.43 185.60 173.85 226.78
United States .. .. .. .. 291.30 472.80 505.58 .. ..
China .. .. .. .. .. .. .. .. 241.64
Colombia .. .. .. 133.90 .. 117.62 .. .. ..
South Africa .. .. .. 70.33 84.00 118.57 177.48 175.05 126.39
Former Soviet Union
(2)
.. .. .. .. .. .. .. .. .. .. .. .. .. .. .. .. ..
Note: On occasion, shipment of extremely small quantities of high valued coal results in high import costs.
(1) Weighted average of individual countries using import volumes as weights. Prices exclude intra-EU trade.
(2) Former Soviet Union until 1991, Russian Federation starting in 1992.
(3) Bituminous steam coal only. Weighted average of individual countries using volumes as weights. Prices exclude intra-EU trade.
* Please refer to notes and definitions in Part I.
Source: IEA/OECD Coal Statistics
AUSTRIA
12. Coal import values by origin*
(average unit value, CIF, US$/tonne)
INTERNATIONAL ENERGY AGENCY
IV.96 - COAL INFORMATION (2011 Edition) PART IV
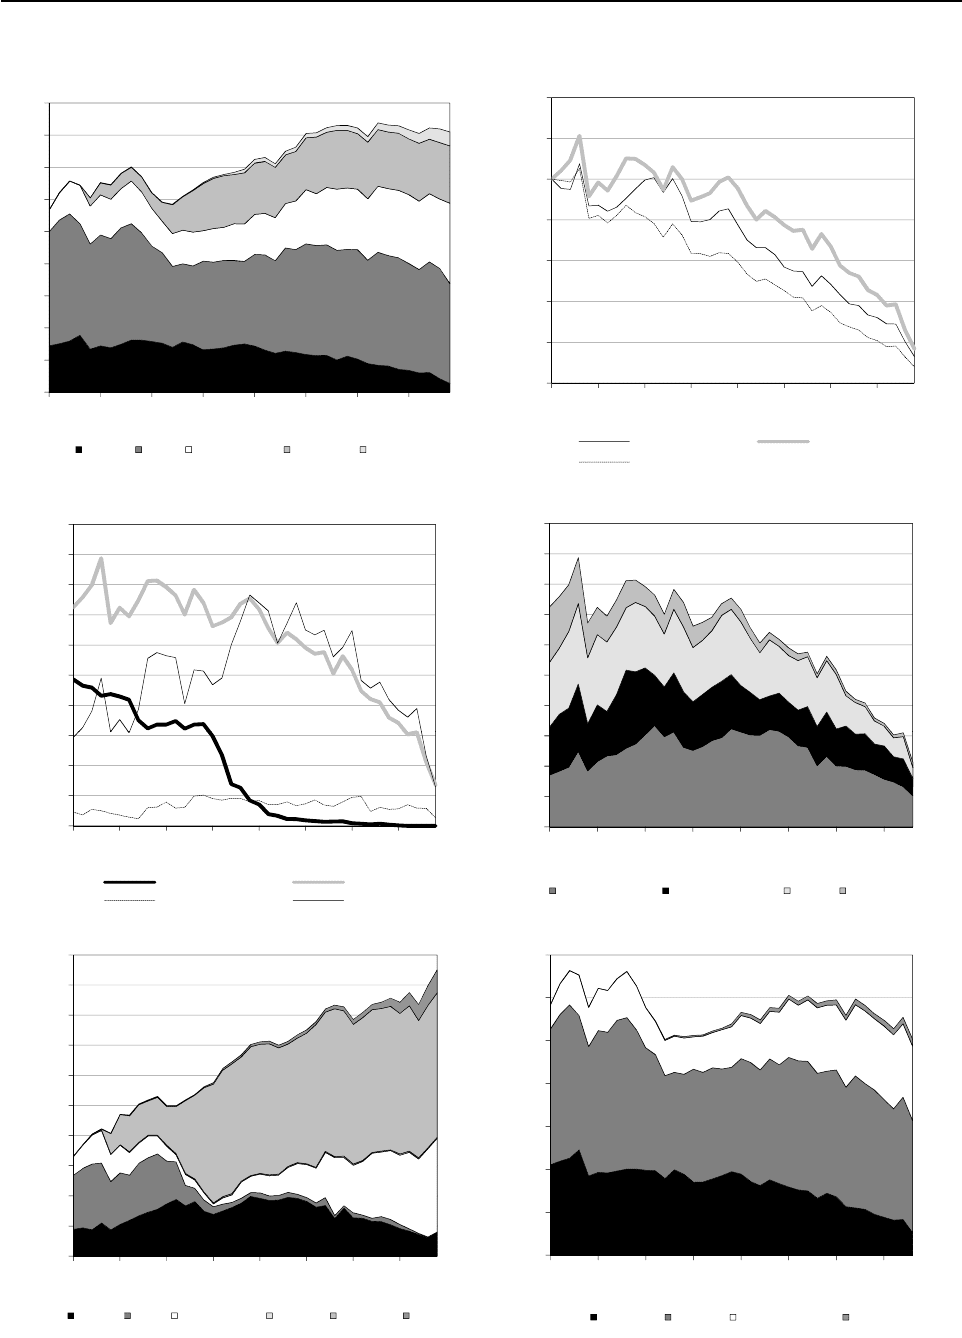
BELGIUM*
0
20
40
60
80
100
120
140
1971 1976 1981 1986 1991 1996 2001
Figure 2: Coal supply indicators (1971 = 100)
Coal/TPES Coal/population
Coal/GDP
4
6
8
10
12
14
16
18
20
Figure 3: Primary coal supply (Mtce)
0
10
20
30
40
50
60
70
80
90
1971 1976 1981 1986 1991 1996 2001
Figure 1: TPES by fuel (Mtce)
Coal Oil Natural Gas Nuclear Renewables
4
6
8
10
12
14
16
18
20
Figure 4: Coal consumption (Mtce)
2010e
2010e
INTERNATIONAL ENERGY AGENCY
*Please refer to notes and definitions in Part I. Peat is included in coal for all figures.
0
2
4
6
1971 1976 1981 1986 1991 1996 2001
Production Coal supply
Exports Imports
0
2
4
6
1971 1976 1981 1986 1991 1996 2001
Electricity and heat Other transformation Industry Other use
2009
0
20
40
60
80
100
120
140
1971 1976 1981 1986 1991 1996 2001
Figure 6: CO
2
emissions by fuel (Mt CO
2
)
Coal Oil Natural Gas Other
2009
0
10
20
30
40
50
60
70
80
90
100
1971 1976 1981 1986 1991 1996 2001
Figure 5: Electricity generation by fuel (TWh)
Coal Oil Natural Gas Hydro Nuclear Other
2010e
2010e
INTERNATIONAL ENERGY AGENCY

COAL INFORMATION (2011 Edition) PART IV - IV.97
Average annual
percent change
1973 1980 1990 2000 2008 2009 2010e 73-90 90-09
TPES (Mtce) 65.70 66.81 68.98 83.58 83.68 81.74 81.14 0.29 0.90
Coal and peat 15.97 16.28 15.10 11.25 6.21 4.25 2.72 -0.33 -6.45
Oil 39.55 33.34 25.65 33.23 34.40 34.30 31.09 -2.52 1.54
Natural Gas 10.20 12.73 11.67 19.09 21.19 21.58 24.99 0.79 3.29
Biofuels and waste 0.01 0.08 1.08 1.48 3.38 4.01 4.03 30.09 7.16
Nuclear 0.03 4.67 15.91 17.93 16.96 17.58 17.85 45.13 0.53
Hydro 0.02 0.03 0.03 0.06 0.05 0.04 0.04 2.63 1.11
Geothermal - - 0.00 0.00 0.00 0.01 0.01 - 3.47
Solar, wind, tide - - 0.00 0.00 0.09 0.16 0.26 - 25.70
Net electricity trade
(1)
-0.09 -0.32 -0.46 0.53 1.30 -0.23 0.07 9.84 -3.66
Heat
(2)
- - - - 0.09 0.03 0.09 - -
(1) Net trade between OECD and non-OECD countries.
(2) Ambient heat from heat pumps used in the transformation sector.
Source: IEA/OECD Energy Balances of OECD Countries
Average annual
percent change
1973 1980 1990 2000 2008 2009 2010e 73-90 90-09
GDP (2000 bil. US$) 127 153 187 232 268 261 266 2.28 1.78
TPES/GDP
(1)
0.52 0.44 0.37 0.36 0.31 0.31 0.30 -1.95 -0.87
Population (millions) 9.7 9.9 10.0 10.2 10.7 10.8 10.9 0.15 0.42
TPES/population
(1)
6.76 6.78 6.92 8.16 7.82 7.58 7.47 0.14 0.48
TPES/GDP
(2)
143.6 121.5 102.8 100.0 86.7 87.1 84.7 -1.95 -0.87
Coal and peat supply/GDP
(2)
259.4 219.9 167.1 100.0 47.8 33.7 21.1 -2.55 -8.09
Elec. consumption/GDP
(2)
80.6 85.0 93.2 100.0 92.4 88.8 .. 0.86 -0.25
Elec. generation (TWh) 41 53 70 83 84 90 95 3.28 1.30
Industrial production
(2)
65.6 70.5 85.9 100.0 111.4 96.5 .. 1.59 0.61
(1) TPES/GDP in units of tce/2000 thousand US$, TPES/population in units of tce/capita.
(2) As index, 2000 = 100
Source: IEA/OECD Energy Balances of OECD Countries, OECD Main Economic Indicators
Average annual
percent change
1978
(1)
1980 1990 2000 2008 2009 2010e 78-90 90-09
Mtce:
Coking coal 3.81 4.04 - - - - - - -
Steam coal 3.19 2.69 1.69 0.29 - - - -5.18 -
Brown coal - - - - - - - - -
Peat - - - - - - - - -
Mt:
Coking coal 3.81 4.04 - - - - - - -
Steam coal 4.90 3.98 2.36 0.38 - - - -5.92 -
Brown coal - - - - - - - - -
Peat - - - - - - - - -
(1) Earliest year for which split by coal type is available.
* Please refer to notes and definitions in Part I.
Source: IEA/OECD Energy Balances of OECD Countries, IEA/OECD Energy Statistics of OECD Countries
BELGIUM
1. Total primary energy supply (TPES) by fuel*
2. Energy supply, GDP and population*
3. Coal and peat production by type*
INTERNATIONAL ENERGY AGENCY

IV.98 - COAL INFORMATION (2011 Edition) PART IV
(Mtce) Average annual
percent change
1973 1980 1990 2000 2007 2008 2009 73-90 90-09
TFC
(1)
48.19 46.12 45.81 59.12 56.64 60.51 56.03 -0.30 1.07
Coal and peat 8.15 6.05 5.05 3.68 1.44 1.72 1.07 -2.78 -7.87
Oil 28.80 24.08 23.04 29.93 28.12 31.32 28.47 -1.30 1.12
Natural Gas 6.57 10.11 9.74 14.52 15.11 15.23 14.45 2.34 2.10
Biofuels and wastes - - 0.54 0.76 1.20 1.39 1.72 - 6.32
Geothermal - - - - - - - - -
Solar, wind, tide - - 0.00 0.00 0.01 0.01 0.02 - 14.57
Electricity 4.20 5.33 7.12 9.53 10.18 10.16 9.49 3.15 1.52
Heat 0.46 0.56 0.32 0.70 0.58 0.68 0.82 -2.14 5.15
of which:
Total industry 19.41 16.00 15.02 18.32 15.78 15.29 12.97 -1.50 -0.77
Coal and peat 5.06 4.57 4.30 3.40 1.26 1.47 0.71 -0.95 -9.04
Oil 7.46 3.65 2.31 2.29 1.43 1.02 0.93 -6.67 -4.64
Natural Gas 3.68 4.33 4.12 6.58 6.94 6.59 5.71 0.67 1.73
Biofuels and wastes - - 0.27 0.54 0.75 0.89 0.93 - 6.68
Geothermal - - - - - - - - -
Solar, wind, tide - - - - - - - - -
Electricity 2.75 2.94 3.75 4.90 4.93 4.79 4.01 1.83 0.36
Heat 0.46 0.51 0.27 0.61 0.47 0.53 0.67 -3.08 4.91
Total transport 6.31 7.72 9.69 11.69 12.11 13.10 13.06 2.55 1.59
Coal and peat 0.02 0.00 - - - - - - -
Oil 6.20 7.60 9.53 11.52 11.78 12.75 12.44 2.57 1.41
Natural Gas - - - - - - - - -
Biofuels and wastes - - - - 0.13 0.14 0.41 - -
Electricity 0.10 0.12 0.15 0.18 0.21 0.21 0.22 2.53 1.83
Residential 15.78 13.70 11.82 13.53 11.58 12.54 11.83 -1.68 0.00
Coal and peat 3.07 1.48 0.75 0.28 0.16 0.22 0.33 -7.99 -4.21
Oil 10.21 7.00 4.98 5.39 3.74 4.80 3.93 -4.14 -1.24
Natural Gas 1.56 3.58 3.55 4.70 4.68 4.71 4.73 4.95 1.53
Biofuels and wastes - - 0.26 0.22 0.29 0.32 0.32 - 1.05
Geothermal - - - - - - - - -
Solar, wind, tide - - - 0.00 0.01 0.01 0.01 - -
Electricity 0.93 1.61 2.26 2.92 2.69 2.45 2.48 5.34 0.49
Heat - 0.02 0.03 0.02 0.02 0.02 0.02 - -1.78
Comm & public services 1.52 4.25 4.11 4.92 5.59 6.74 6.57 6.02 2.50
Coal and peat 0.00 0.00 - - - - - - -
Oil 0.59 2.23 1.65 1.19 1.33 1.65 1.36 6.20 -1.03
Natural Gas 0.51 1.34 1.48 2.21 1.95 2.42 2.46 6.42 2.72
Biofuels and waste - - - 0.00 0.01 0.01 0.01 - -
Geothermal - - - - - - - - -
Solar, wind, tide - - - 0.00 0.00 0.00 0.00 - -
Electricity 0.41 0.65 0.96 1.50 2.23 2.56 2.64 5.08 5.48
Heat - 0.03 0.02 0.02 0.07 0.10 0.10 - 8.59
Non-energy use 4.52 3.73 4.48 9.63 10.28 11.63 10.36 -0.06 4.51
Coal and peat - - - - 0.03 0.03 0.01 - -
Oil 3.69 2.87 3.88 8.60 8.95 10.33 9.13 0.29 4.61
Natural Gas 0.83 0.86 0.60 1.03 1.30 1.27 1.21 -1.87 3.79
(1) Total Final Consumption (TFC) excludes use in transformation processes and energy industry own use.
* Please refer to notes and definitions in Part I.
Source: IEA/OECD Energy Balances of OECD Countries
BELGIUM
4. Final consumption of energy by fuel*
INTERNATIONAL ENERGY AGENCY

COAL INFORMATION (2011 Edition) PART IV - IV.99
Average annual
percent change
1973 1980 1990 2000 2008 2009 2010e 73-90 90-09
Production 9.2 6.7 1.7 0.3 - - - -9.5 -
Imports 7.6 11.5 15.3 11.8 7.8 4.6 2.6 4.2 -6.1
Exports -1.1 -1.2 -1.6 -1.6 -1.2 -1.2 -0.5 2.2 -1.7
Stock changes 0.3 -0.7 -0.3 0.7 -0.4 0.8 0.7 x x
Primary supply 16.0 16.3 15.1 11.3 6.2 4.3 2.7 -0.3 -6.4
Statistical difference 1.5 -0.4 -0.0 -0.5 0.2 -0.0 .. x x
Total transformation -8.2 -9.1 e -9.4 e -6.7 e -4.4 e -3.0 e .. 0.8 -5.7
Electricity and heat gen. -3.9 -5.5 -6.5 -4.7 -2.7 -2.1 .. 3.0 -5.8
Main activity producers
(1)
-3.9 -4.8 -6.0 -4.5 -2.2 -2.0 .. 2.5 -5.7
Autoproducers - -0.7 -0.5 -0.2 -0.5 -0.1 .. - -7.6
Gas works -0.0 0.0 - - - - .. - -
Coal transformation
(2)
-4.3 -3.6 e -2.9 e -2.0 e -1.8 e -1.0 e .. -2.3 -5.5
BKB plants - - - - - - .. - -
Blast furnaces -3.8 -2.9
e
-2.3
e
-2.0
e
-1.7
e
-0.7
e
.. -2.7 -5.9
Coke ovens -0.6 -0.8 -0.5 -0.0 -0.1 -0.2 .. -0.6 -3.9
Patent fuel plants 0.1 0.0 0.0
e
0.0 -0.0 - .. -34.9 -
Other transformation
(3)
- - - - - - .. - -
Energy ind. own use -1.1 -0.8 -0.7 -0.3 -0.2 -0.1 .. -2.6 -8.4
Losses -0.0 -0.0 - - - - .. x x
Final consumption
(4)
8.2 6.0 5.1 3.7 1.7 1.1 .. -2.8 -7.9
Industry
(5)
5.1 4.6 4.3 3.4 1.5 0.7 .. -1.0 -9.0
Iron and steel 3.5 2.9
e
2.9
e
2.8
e
1.1
e
0.3
e
.. -1.1 -10.6
Chemical 0.1 0.1 0.2 0.0 - 0.0 .. 2.2 -23.4
Non-metallic minerals 1.0 1.5 0.8 0.4 0.2 0.2 .. -1.0 -7.0
Paper, pulp and print - 0.0 0.0 0.0 0.0 0.0 .. - -0.7
Transport
(6)
0.0 0.0 - - - - .. - -
Other
(7)
3.1 1.5 0.7 0.3 0.2 0.3 .. -8.0 -4.1
Comm. and pub. services 0.0 0.0 - - - - .. - -
Residential 3.1 1.5 0.7 0.3 0.2 0.3 .. -8.0 -4.2
Non-energy use - - - - 0.0 0.0 .. - -
(1) Main activity electricity and heat generation includes district heating.
(2) Coal transformation refers to the transformation of coal and peat to secondary and tertiary products (mainly coke,
(2)
briquettes, coke oven gas and blast furnace gas).
(3) Other transformation includes liquefaction and non-specified transformation processes.
(4) Final Consumption includes non-energy use and energy use (industry, transport and other).
(5) Please refer to notes and definitions in Part I for detailed explanation.
(6) Transport includes rail and inland waterways.
(7) Other includes commercial and public services, agriculture, and residential.
Source: IEA/OECD Energy Balances of OECD Countries
* as well as peat, peat briquettes and oil shale. Quantities have been converted to Mtce using calorific values reported by the respective countries.
* Please refer to notes and definitions in Part I.
BELGIUM
5. Coal balance*
(Mtce)
* "Coal" refers to all types of coal, primary (anthracite, coking coal, other bituminous coal, sub-bituminous coal, lignite/brown coal) and derived fuels
* (including patent fuel, BKB, coke oven coke, gas coke, coal tar, coke oven gas, gas works gas, blast furnace gas and oxygen steel furnace gas),
INTERNATIONAL ENERGY AGENCY

IV.100 - COAL INFORMATION (2011 Edition) PART IV
(million tonnes) Average annual
percent change
1978 1990 2000 2005 2007 2008 2009 78-90 90-09
Steam coal 8.76 9.00 7.00 4.29 3.07 2.97 2.72 0.22 -6.09
Total electricity and heat 4.44 6.64 4.37 3.05 2.25 1.95 1.74 3.41 -6.80
Main activity producers 4.18 6.34 4.31 2.98 2.19 1.87 1.66 3.53 -6.80
Autoproducers 0.26 0.30 0.07 0.06 0.05 0.09 0.08 1.22 -6.78
Patent fuel/BKB plants 0.12 0.00 0.01 0.01 0.00 0.01 - -32.76 -
Coke ovens 0.03 - - - - - - --
Blast furnace inputs - 0.41 0.98 0.48 0.40 0.40 0.05 - -11.02
Gas manufacture - - - - - - - --
Industry 2.66 1.37 0.98 0.36 0.28 0.37 0.30 -5.39 -7.66
Iron and steel 0.17 0.10 0.48 0.12 0.05 0.08 0.00 -4.36 -21.48
Chemical 0.03 0.14 - - - - - 13.74 -
Non-metallic minerals 2.44 0.87 0.36 0.12 0.10 0.17 0.17 -8.25 -8.27
Paper, pulp and print - 0.05 0.04 0.04 0.05 0.04 0.05 - -
Other industry 0.02 0.22 0.10 0.08 0.09 0.08 0.09 20.19 -4.84
Res, comm & pub serv
(1)
1.63 0.70 0.30 0.19 0.16 0.23 0.36 -6.77 -3.48
Non-energy use - - - 0.01 0.03 0.03 0.02 - -
Coking coal 7.52 7.16 4.05 3.26 3.45 2.91 1.96 -0.42 -6.59
Total electricity and heat
0.20 - - - - - - --
Main activity producers
0.18 - - - - - - --
Autoproducers
0.02 - - - - - - --
Patent fuel/BKB plants
- - - - - - - --
Coke ovens
7.19 7.16 3.86 3.37 3.43 2.82 2.05 -0.03 -6.38
Blast furnace inputs
- - - - - - - --
Gas manufacture
- - - - - - - --
Industry
0.
00 - - - 0.01 - - --
Iron and steel
- - - - - - - --
Chemical
- - - - - - - --
Non-metallic minerals
0.00 - - - 0.01 - - --
Paper, pulp and print
- - - - - - - --
Other industry - - - - - - -
--
Res, comm & pub serv
(1)
0.00 - - - 0.00 - - --
Non-energy use
- - - - - - - --
Brown coal - 0.28 0.22 0.21 0.32 0.28 0.17 - -2.43
Total electricity and heat - - - - - - - --
Main activity producers - - - - - - - --
Autoproducers - - - - - - - --
Patent fuel/BKB plants - - - - - - - --
Coke ovens - - - - - - - --
Gas
manufacture - - - - - - - --
Industry - 0.28 0.22 0.21 0.32 0.28 0.15 - -3.09
Iron and steel - - - - - - - --
Chemical - - - 0.01 - - 0.00 - -
Non-metallic minerals - 0.28 0.22 0.20 0.32 0.28 0.14 - -3.37
Paper, pulp and print - - - - - - - --
Other industry - - - - - - 0.00 - -
Res, comm & pub serv
(1)
- - - - - 0.00 - --
Non-energy use - - - - - - - --
(1) Residential, commercial and public services.
* Please refer to notes and definitions in Part I.
Source: IEA/OECD Energy Statistics of OECD Countries
BELGIUM
6. Use of coal for selected end-uses*
INTERNATIONAL ENERGY AGENCY

COAL INFORMATION (2011 Edition) PART IV - IV.101
1978
(1)
1980 1990 2000 2006 2007 2008 2009 2010
(US dollars / tce)
For electricity generation
Steam coal 53.08 62.51 59.60 42.95 82.93 99.07 171.19 100.77 ..
Heavy fuel oil 66.67 128.76 91.13 129.79 x x x x x
Natural gas 65.42 123.12 96.10 c c c c c c
For industry
Steam coal 29.62 42.87 55.41 .. .. .. .. .. ..
Coking coal 63.67 66.51 61.72 47.21 .. .. .. .. ..
High sulphur fuel oil 66.67 128.76 91.13 129.79 x x x x x
Low sulphur fuel oil .. .. 102.02 117.76 251.62 289.79 444.57 300.97 384.64
Natural gas 71.79 117.89 112.22 c c .. 435.38 324.61 276.04
(Euro / unit)
(2)
For electricity generation
Steam coal 31.61 34.56 37.68 35.54 50.40 55.15 89.29 55.31 ..
Heavy fuel oil 72.53 130.02 105.23 196.15 x x x x x
Natural gas 65.69 114.77 102.43 c c c c c c
For industry
Steam coal 18.34 24.64 36.42 .. .. .. .. .. ..
Coking coal 49.73 48.22 51.17 51.22 .. .. .. .. ..
High sulphur fuel oil 72.53 130.02 105.23 196.15 x x x x x
Low sulphur fuel oil .. .. 117.80 177.97 279.32 294.66 423.54 301.74 404.49
Natural gas 72.09 109.89 119.61 c c .. 382.89 300.41 267.96
(1) Earliest year for which split by coal type is available.
(2) For steam coal, coking coal and heavy fuel oil per metric tonne; for natural gas per 10
7
kilocalories GCV.
* Please refer to notes and definitions in Part I.
Source: IEA/OECD Energy Prices & Taxes
1973 1980 1990 2000 2006 2007 2008 2009 2010e
Total imports 7.60 11.49 15.33 11.84 7.67 7.21 7.79 4.64 2.57
Hard coal 6.36 10.13 14.37 10.66 7.49 6.89 6.88 4.41 2.38
Coking coal .. 4.17 7.13 3.82 3.49 3.25 2.99 1.67 1.34
Steam coal .. 5.96 7.24 6.84 4.00 3.64 3.88 2.74 1.04
Brown coal - 0.03 0.08 0.06 0.08 0.09 0.08 0.05 0.03
Peat - - - - - - - - -
Coal products
(1)
1.24 1.33 0.88 1.12 0.10 0.23 0.83 0.19 0.17
Total exports 1.10 1.23 1.60 1.59 1.12 1.39 1.17 1.16 0.54
Hard coal 0.60 0.47 0.68 1.28 0.93 1.28 1.05 0.77 0.40
Coking coal .. 0.18 - 0.09 0.01 0.01 - 0.01 -
Steam coal .. 0.30 0.68 1.20 0.92 1.27 1.05 0.76 0.40
Brown coal - - - - - - - - -
Peat - - - - - - - - -
Coal products
(1)
0.50 0.76 0.92 0.30 0.19 0.11 0.12 0.39 0.14
(1) Coal products includes products derived from coal, for example: coke, coal tar, briquettes, patent fuels.
* Please refer to notes and definitions in Part I.
Source: IEA/OECD Energy Balances of OECD Countries, IEA/OECD Energy Statistics of OECD Countries
BELGIUM
7. Fuel prices to end users*
8. Coal and peat trade by type of coal*
(Mtce)
INTERNATIONAL ENERGY AGENCY