IEA Statistics. Coal Information 2011
Подождите немного. Документ загружается.


IV.102 - COAL INFORMATION (2011 Edition) PART IV
1978
(1)
1985 1990 1995 2000 2007 2008 2009 2010e
Hard Coal 7007 9320 14761 14099 11347 7415 7431 4806 2533
Coking Coal 3490 4663 7132 5267 3818 3247 2993 1666 1339
Australia 209 16 1015 1614 1109 1739 1624 300 520
Canada 148 94 236 205 678 175 60 140 -
Czech Republic 59 - - - - - - - -
Germany 1751 1028 690 20 - - - 14 -
Poland 392 540 105 66 74 - - - -
United Kingdom 22 - 32 - - - - 2 -
United States 833 2951 4897 3171 1898 1326 1221 1147 729
Other OECD 15 - - 15 - 6 65 63 90
China, People's Rep. - - - - - - 16 - -
Colombia - - - - - - - - -
Indonesia - - - - - - - - -
South Africa 15 34 157 176 59 - 6 - -
Former Soviet Union
(2)
46 - -------
Russian Federation
(3)
- - - - - - - - -
Other FSU
(3)
- - - - - - - - -
Venezuela - - - - - - - - -
Vietnam - - - - - - - - -
Non-specified/other - - - - - 1 1 - -
Steam coal 3517 4657 7629 8832 7529 4168 4438 3140 1194
Australia - 205 388 1283 2354 581 631 77 -
Canada 26 28 66 20 12 11 - - -
Czech Republic - - - - - - - - -
Germany 2316 1067 721 301 118 97 141 140 76
Poland 105 59 242 318 225 6 - 86 23
United Kingdom 129 39 67 66 76 38 49 36 27
United States - 671 981 983 309 403 632 471 140
Other OECD 72 246 60 75 48 46 44 20 36
China, People's Rep. - 112 292 299 167 15 24 - -
Colombia - 51 170 269 431 27 209 114 57
Indonesia - - 6 - 11 275 - - -
South Africa 606 2078 4365 4855 3028 1641 1931 1900 780
Former Soviet Union
(2)
233 73 -------
Russian Federation
(3)
- - 234 154 705 1010 548 206 33
Other FSU
(3)
- - - 111 19 - - - -
Venezuela - - 1 17 3 - 218 - -
Vietnam - - - 81 23 17 10 - -
Non-specified/other 30 28 36 - - 1 1 90 22
(1) Earliest year for which split by coal type is available.
(2) For years prior to 1990, or if no details for individual Former Soviet Union republics.
(3) Data for former republics are not available separately for some OECD member countries.
* Please refer to notes and definitions in Part I.
Source: IEA/OECD Coal Statistics
BELGIUM
9. Hard coal imports by origin*
(thousand tonnes)
INTERNATIONAL ENERGY AGENCY

COAL INFORMATION (2011 Edition) PART IV - IV.103
1978
(1)
1985 1990 1995 2000 2007 2008 2009 2010e
Total Exports 122 1075 724 818 1340 1464 1213 876 462
Total OECD 122 1021 724 818 1340 1462 1213 876 454
Australia - - - - - - - - -
Austria - - - - - - - - -
Belgium - - - - - - - - -
Canada - - - - - - - - -
Chile - - - - - - - - -
Czech Republic - - - - - - - - -
Denmark - 2 1 - - - - - -
Estonia - - - - - - - - -
Finland - - - - 2 - - - -
France 61 317 360 352 609 263 293 406 229
Germany 1 345 67 204 495 409 208 204 113
Greece - - - - - 1 - - -
Hungary - - - - - - - - -
Iceland - - - - - - - - -
Ireland - - - - 7 - - - -
Israel - - - - - - - - -
Italy - 14 5 - - - - - -
Japan - - 61 - - - - - -
Korea - - - - - - - - -
Luxembourg 21 2 - 50 40 46 24 136 30
Mexico - - - - - - - - -
Netherlands 1 79 179 182 136 737 582 129 82
New Zealand - - - - - - - - -
Norway 13 87 - 25 - - - - -
Poland - - - - - 2 - - -
Portugal 6 21 4 - - - - - -
Slovak Republic - - - - - - - - -
Slovenia - - - - - - - - -
Spain 18 7 43 3 6 - - - -
Sweden - 28 - - 15 1 12 1 -
Switzerland 1 18 - - 15 - 92 - -
Turkey - - - - - - - - -
United Kingdom - 101 4 2 15 3 2 - -
United States - - - - - - - - -
Total Non-OECD - 54 - - - - - - -
Brazil - - - - - - - - -
Chinese Taipei - - - - - - - - -
Egypt - - - - - - - - -
India - - - - - - - - -
Romania - - - - - - - - -
Oth. Africa & Mid. East - - - - - - - - -
Other Latin America - 2 - - - - - - -
China
(2)
- - - - - - - - -
Other Asia & Oceania - - - - - - - - -
Other Non-OECD Europe
and Eurasia - 52 - - - - - - -
Non-Specified/Other - - - - - 2 - - 8
(1) Earliest year for which split by coal type is available.
(2) China includes the People's Republic of China and Hong Kong, China.
* Please refer to notes and definitions in Part I.
Source: IEA/OECD Coal Statistics
BELGIUM
11. Steam coal exports by destination*
(thousand tonnes)
INTERNATIONAL ENERGY AGENCY

IV.104 - COAL INFORMATION (2011 Edition) PART IV
1990 1995 2000 2005 2006 2007 2008 2009 2010
Coking coal
(1)
63.93 57.74 44.05 108.68 126.85 120.51 163.26 146.61 180.40
Imports from:
Australia 63.54 58.30 38.58 125.12 150.51 135.93 184.60 314.05 215.58
Canada 63.80 56.91 43.97 148.24 153.27 136.78 .. 166.36 109.55
Czech Republic 254.00 .. .. .. .. .. .. .. ..
Poland 60.08 57.96 .. 133.14 131.24 .. .. .. ..
United States 62.61 58.28 52.54 96.51 101.04 104.33 141.00 140.30 186.51
China .. 63.59 .. 285.09 229.39 163.87 241.46 .. ..
Colombia .. .. .. .. .. .. .. .. ..
South Africa 54.18 49.03 41.49 67.23 59.63 78.76 139.94 79.53 91.21
Former Soviet Union
(2)
.. .. .. 75.13 67.34 91.44 172.22 .. 139.54
Steam coal
(3)
45.57 47.94 39.88 70.83 70.95 82.81 150.58 109.92 114.02
Imports from: 50.57 45.93 40.41 97.75 100.18 90.32 199.82 272.28 160.77
Australia 57.14 66.64 42.87 102.49 .. 72.46 .. 95.33 111.61
Canada .. .. .. .. .. .. .. .. ..
Czech Republic 48.40 46.66 31.66 63.56 57.55 158.69 270.57 72.53 89.28
Poland 51.01 49.77 48.91 .. 66.92 90.95 140.60 139.10 141.31
United States 48.49 45.65 58.92 .. .. 653.12 .. x x
China 51.92 53.17 35.18 73.98 68.14 84.14 .. 152.05 96.91
Colombia 44.88 43.64 36.80 68.15 66.67 80.05 128.43 97.91 97.65
South Africa 44.83 43.65 37.03 67.19 63.23 82.65 139.75 89.68 106.33
Former Soviet Union
(2)
.. .. .. .. .. .. .. .. .. .. .. .. .. .. .. .. ..
Note: On occasion, shipment of extremely small quantities of high valued coal results in high import costs.
(1) Weighted average of individual countries using import volumes as weights. Prices exclude intra-EU trade.
(2) Former Soviet Union until 1991, Russian Federation starting in 1992.
(3) Bituminous steam coal only. Weighted average of individual countries using volumes as weights. Prices exclude intra-EU trade.
* Please refer to notes and definitions in Part I.
Source: IEA/OECD Coal Statistics
BELGIUM
12. Coal import values by origin*
(average unit value, CIF, US$/tonne)
INTERNATIONAL ENERGY AGENCY
COAL INFORMATION (2011 Edition) PART IV - IV.105
CANADA*
0
20
40
60
80
100
120
140
160
1971 1976 1981 1986 1991 1996 2001
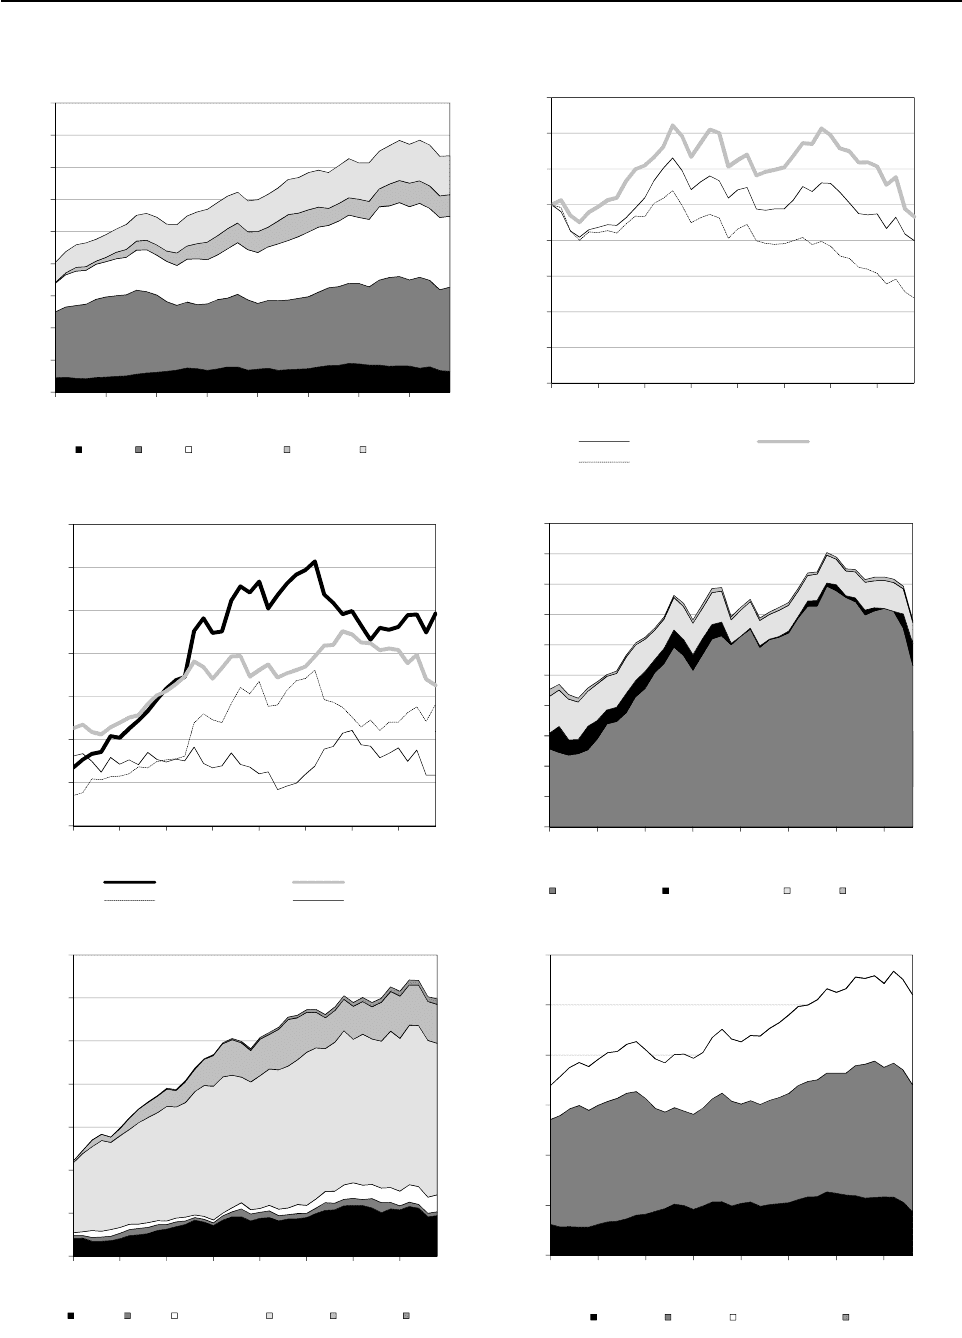
Figure 2: Coal supply indicators (1971 = 100)
Coal/TPES Coal/population
Coal/GDP
10
20
30
40
50
60
70
Figure 3: Primary coal supply (Mtce)
0
50
100
150
200
250
300
350
400
450
1971 1976 1981 1986 1991 1996 2001
Figure 1: TPES by fuel (Mtce)
Coal Oil Natural Gas Nuclear Renewables
10
15
20
25
30
35
40
45
50
Figure 4: Coal consumption (Mtce)
2010e
2010e
INTERNATIONAL ENERGY AGENCY
*Please refer to notes and definitions in Part I. Peat is included in coal for all figures.
0
10
20
1971 1976 1981 1986 1991 1996 2001
Production Coal supply
Exports Imports
0
5
10
15
1971 1976 1981 1986 1991 1996 2001
Electricity and heat Other transformation Industry Other use
2009
0
100
200
300
400
500
600
1971 1976 1981 1986 1991 1996 2001
Figure 6: CO
2
emissions by fuel (Mt CO
2
)
Coal Oil Natural Gas Other
2009
0
100
200
300
400
500
600
700
1971 1976 1981 1986 1991 1996 2001
Figure 5: Electricity generation by fuel (TWh)
Coal Oil Natural Gas Hydro Nuclear Other
2010e
2010e
INTERNATIONAL ENERGY AGENCY

IV.106 - COAL INFORMATION (2011 Edition) PART IV
Average annual
percent change
1973 1980 1990 2000 2008 2009 2010e 73-90 90-09
TPES (Mtce) 227.63 275.14 297.95 359.21 380.77 363.03 364.75 1.60 1.05
Coal and peat 21.80 30.32 34.68 45.23 39.72 34.03 32.67 2.77 -0.10
Oil 113.41 126.46 109.31 124.43 134.55 125.55 131.08 -0.22 0.73
Natural Gas 53.25 65.07 78.18 106.05 111.80 112.37 110.13 2.28 1.93
Biofuels and waste 11.16 10.92 11.65 16.70 17.15 16.26 16.54 0.25 1.77
Nuclear 5.82 14.86 27.71 27.10 34.98 33.66 33.63 9.62 1.03
Hydro 23.91 30.86 36.46 44.05 45.98 44.70 43.18 2.51 1.08
Geothermal - - - - - - - - -
Solar, wind, tide - - 0.00 0.04 e 0.46 0.58 0.73 - 31.47
Net electricity trade
(1)
-1.72 -3.35 -0.04 -4.38 -3.87 -4.13 -3.22 -19.53 27.17
Heat
(2)
- - - - - - - - -
(1) Net trade between OECD and non-OECD countries.
(2) Ambient heat from heat pumps used in the transformation sector.
Source: IEA/OECD Energy Balances of OECD Countries
Average annual
percent change
1973 1980 1990 2000 2008 2009 2010e 73-90 90-09
GDP (2000 bil. US$) 325 412 544 725 868 847 873 3.07 2.36
TPES/GDP
(1)
0.70 0.67 0.55 0.50 0.44 0.43 0.42 -1.43 -1.28
Population (millions) 22.5 24.5 27.7 30.7 33.3 33.7 33.9 1.23 1.05
TPES/population
(1)
10.12 11.22 10.76 11.71 11.43 10.76 10.75 0.36 -0.00
TPES/GDP
(2)
141.3 134.8 110.6 100.0 88.5 86.5 84.3 -1.43 -1.28
Coal and peat supply/GDP
(2)
107.5 117.9 102.2 100.0 73.3 64.4 60.0 -0.29 -2.40
Elec. consumption/GDP
(2)
101.9 110.8 115.8 100.0 86.6 84.8 .. 0.76 -1.62
Elec. generation (TWh) 270 373 482 606 641 603 598 3.47 1.19
Industrial production
(2)
51.3 56.2 69.1 100.0 94.1 84.0 89.1 1.77 1.04
(1) TPES/GDP in units of tce/2000 thousand US$, TPES/population in units of tce/capita.
(2) As index, 2000 = 100
Source: IEA/OECD Energy Balances of OECD Countries, OECD Main Economic Indicators
Average annual
percent change
1978
(1)
1980 1990 2000 2008 2009 2010e 78-90 90-09
Mtce:
Coking coal 13.39 13.75 27.17 23.92 23.91 19.38 23.75 6.07 -1.76
Steam coal 3.25 5.82 9.83 4.79 3.79 4.20 4.68 9.66 -4.38
Brown coal 7.82 9.72 17.18 20.44 21.40 21.36 20.89 6.78 1.15
Peat - - - - - - - - -
Mt:
Coking coal 13.78 14.15 27.66 28.16 28.35 22.98 28.15 5.98 -0.97
Steam coal 3.36 6.02 10.01 5.64 4.50 4.98 5.55 9.52 -3.61
Brown coal 13.34 16.52 30.66 35.36 34.91 34.98 34.19 7.18 0.70
Peat - - - - - - - - -
(1) Earliest year for which split by coal type is available.
* Please refer to notes and definitions in Part I.
Source: IEA/OECD Energy Balances of OECD Countries, IEA/OECD Energy Statistics of OECD Countries
CANADA
1. Total primary energy supply (TPES) by fuel*
2. Energy supply, GDP and population*
3. Coal and peat production by type*
INTERNATIONAL ENERGY AGENCY

COAL INFORMATION (2011 Edition) PART IV - IV.107
(Mtce) Average annual
percent change
1973 1980 1990 2000 2007 2008 2009 73-90 90-09
TFC
(1)
187.48 221.52 227.07 270.90 292.48 286.37 277.39 1.13 1.06
Coal and peat 7.46 6.18 4.41 5.02 5.30 4.59 3.81 -3.04 -0.77
Oil 108.07 114.27 98.27 115.40 130.20 128.53 121.88 -0.56 1.14
Natural Gas 33.89 51.75 61.86 76.30 79.47 76.02 78.14 3.60 1.24
Biofuels and wastes 10.88 10.60 10.26 13.85 14.57 14.72 13.96 -0.35 1.63
Geothermal - - - - - - - - -
Solar, wind, tide - - - - - - - - -
Electricity 27.04 37.25 51.37 59.17 61.80 61.41 58.65 3.85 0.70
Heat 0.14 1.47 0.91 1.16 1.15 1.09 0.95 11.78 0.23
of which:
Total industry 65.02 71.52 67.30 78.56 81.80 75.93 74.39 0.20 0.53
Coal and peat 6.71 5.85 3.87 4.59 4.76 4.13 3.46 -3.18 -0.60
Oil 20.06 16.56 9.70 9.22 9.09 8.33 6.23 -4.19 -2.30
Natural Gas 16.95 23.14 24.07 27.59 32.42 30.01 34.26 2.08 1.88
Biofuels and wastes 8.15 7.87 8.13 11.03 10.80 10.85 9.96 -0.02 1.08
Geothermal - - - - - - - - -
Solar, wind, tide - - - - - - - - -
Electricity 13.01 16.67 20.63 24.98 23.72 21.65 19.59 2.75 -0.27
Heat 0.14 1.43 0.90 1.15 1.02 0.96 0.88 11.73 -0.11
Total transport 48.00 63.31 61.60 74.49 82.39 81.09 78.90 1.48 1.31
Coal and peat 0.18 - - - - - - - -
Oil 47.42 60.70 57.06 66.95 75.03 75.04 73.43 1.09 1.34
Natural Gas - 2.33 4.14 6.79 5.92 4.57 3.89 - -0.33
Biofuels and wastes - - - 0.19 0.95 1.00 1.13 - -
Electricity 0.40 0.28 0.40 0.56 0.50 0.48 0.45 0.06 0.58
Residential 36.34 40.43 41.03 44.10 45.89 46.61 45.36 0.72 0.53
Coal and peat 0.57 0.11 0.07 0.05 0.04 0.05 0.04 -11.87 -2.46
Oil 17.92 14.67 6.66 4.64 3.30 2.95 2.50 -5.66 -5.02
Natural Gas 8.73 12.49 16.22 19.80 20.95 21.15 20.27 3.71 1.18
Biofuels and wastes 2.73 2.73 e 2.13 2.63 2.81 2.87 2.86 -1.44 1.56
Geothermal - - - - - - - - -
Solar, wind, tide - - - - - - - - -
Electricity 6.38 10.42 15.95 16.98 18.78 19.59 19.69 5.54 1.11
Heat - - 0.00 - 0.00 - - - -
Comm & public services 24.13 26.13 31.04 39.17 44.22 45.63 45.06 1.49 1.98
Coal and peat 0.00 0.04 0.01 0.00 - - - 6.38 -
Oil 8.93 7.08 5.82 8.25 11.72 11.83 11.64 -2.48 3.71
Natural Gas 8.20 10.05 11.89 15.45 14.72 15.14 15.62 2.21 1.45
Biofuels and waste - - - - 0.01 e 0.01 e 0.01 e - -
Geothermal - - - - - - - - -
Solar, wind, tide - - - - - - - - -
Electricity 7.00 8.92 13.31 15.46 17.64 18.52 17.73 3.86 1.52
Heat - 0.04 0.01 0.01 0.13 0.13 0.06 - 12.44
Non-energy use 10.44 16.65 21.46 28.56 32.71 31.64 28.86 4.33 1.57
Coal and peat - 0.18 0.47 0.38 0.50 0.41 0.31 - -2.07
Oil 10.44 13.14 16.16 22.35 27.44 26.78 25.19 2.61 2.36
Natural Gas - 3.33 4.83 5.84 4.77 4.45 3.36 - -1.89
(1) Total Final Consumption (TFC) excludes use in transformation processes and energy industry own use.
* Please refer to notes and definitions in Part I.
Source: IEA/OECD Energy Balances of OECD Countries
CANADA
4. Final consumption of energy by fuel*
INTERNATIONAL ENERGY AGENCY

IV.108 - COAL INFORMATION (2011 Edition) PART IV
Average annual
percent change
1973 1980 1990 2000 2008 2009 2010e 73-90 90-09
Production 16.7 29.3 54.2 49.2 49.1 44.9 49.3 7.2 -1.0
Imports 15.0 15.4 13.6 21.5 17.6 11.8 11.7 -0.5 -0.8
Exports -10.9 -14.9 -30.6 -27.5 -27.6 -24.2 -28.2 6.3 -1.2
Stock changes 1.0 0.5 -2.5 2.1 0.6 1.6 -0.2 x x
Primary supply 21.8 30.3 34.7 45.2 39.7 34.0 32.7 2.8 -0.1
Statistical difference 0.5 0.1 1.7 1.2 -0.6 -2.3 .. x x
Total transformation -14.8 e -24.3 e -31.8 e -41.3 e -34.5 e -27.8 e .. 4.6 -0.7
Electricity and heat gen. -11.9 -21.5 -30.0 -39.7 -32.8 -26.6 .. 5.6 -0.6
Main activity producers
(1)
-11.9 -21.4 -30.0 -39.6 -32.8 -26.6 .. 5.6 -0.6
Autoproducers - -0.0 -0.0 -0.1 -0.0 -0.0 .. - -2.0
Gas works - - - - - - .. - -
Coal transformation
(2)
-2.9 e -2.8 e -1.8 e -1.6 e -1.7 e -1.3 e .. -2.8 -1.9
BKB plants - - - - - - .. - -
Blast furnaces -1.9
e
-2.1
e
-1.5
e
-1.4
e
-1.1
e
-1.0
e
.. -1.2 -2.5
Coke ovens -1.0 -0.7 -0.3 -0.2 -0.6 -0.3 .. -7.8 0.7
Patent fuel plants - - - - - - .. - -
Other transformation
(3)
- - - - - - .. - -
Energy ind. own use -0.1 -0.0 -0.1 -0.1 -0.1 -0.1 .. 2.6 -3.0
Losses - - - - - - .. x x
Final consumption
(4)
7.5 6.2 4.4 5.0 4.6 3.8 .. -3.0 -0.8
Industry
(5)
6.7 5.9 3.9 4.6 4.1 3.5 .. -3.2 -0.6
Iron and steel 3.7
e
4.1
e
2.3
e
2.6
e
2.0
e
1.8
e
.. -2.8 -1.2
Chemical - 0.0 - - - - .. - -
Non-metallic minerals 0.7 0.3 0.7 1.0 - - .. -0.0 -
Paper, pulp and print 0.3 0.3 0.1 0.1 - - .. -4.4 -
Transport
(6)
0.2 - - - - - .. - -
Other
(7)
0.6 0.1 0.1 0.1 0.0 0.0 .. -11.4 -3.0
Comm. and pub. services 0.0 0.0 0.0 0.0 - - .. 6.4 -
Residential 0.6 0.1 0.1 0.1 0.0 0.0 .. -11.9 -2.5
Non-energy use - 0.2 0.5 0.4 0.4 0.3 .. - -2.1
(1) Main activity electricity and heat generation includes district heating.
(2) Coal transformation refers to the transformation of coal and peat to secondary and tertiary products (mainly coke,
(2)
briquettes, coke oven gas and blast furnace gas).
(3) Other transformation includes liquefaction and non-specified transformation processes.
(4) Final Consumption includes non-energy use and energy use (industry, transport and other).
(5) Please refer to notes and definitions in Part I for detailed explanation.
(6) Transport includes rail and inland waterways.
(7) Other includes commercial and public services, agriculture, and residential.
Source: IEA/OECD Energy Balances of OECD Countries
* as well as peat, peat briquettes and oil shale. Quantities have been converted to Mtce using calorific values reported by the respective countries.
* Please refer to notes and definitions in Part I.
CANADA
5. Coal balance*
(Mtce)
* "Coal" refers to all types of coal, primary (anthracite, coking coal, other bituminous coal, sub-bituminous coal, lignite/brown coal) and derived fuels
* (including patent fuel, BKB, coke oven coke, gas coke, coal tar, coke oven gas, gas works gas, blast furnace gas and oxygen steel furnace gas),
INTERNATIONAL ENERGY AGENCY

COAL INFORMATION (2011 Edition) PART IV - IV.109
(million tonnes) Average annual
percent change
1978 1990 2000 2005 2007 2008 2009 78-90 90-09
Steam coal 11.51 13.86 18.04 16.16 8.23 7.53 6.50 1.56 -3.91
Total electricity and heat 10.30 12.21 15.75 13.21 8.72 5.93 3.58 1.42 -6.25
Main activity producers 10.29 12.19 15.74 13.20 8.71 5.93 3.57 1.42 -6.25
Autoproducers 0.01 0.02 0.01 0.01 0.01 0.01 0.01 2.12 -6.52
Patent fuel/BKB plants - - - - - - - --
Coke ovens - - - - e - e - - --
Blast furnace inputs - - - - - - - --
Gas manufacture - - - - - - - --
Industry 1.41 1.22 1.74 1.86 2.30 2.30 1.82 -1.20 2.13
Iron and steel 0.07 - - - - - - --
Chemical 0.26 - - - - - - --
Non-metallic minerals 0.36 0.69 1.03 1.20 - - - 5.41 -
Paper, pulp and print 0.28 0.09 0.03 0.02 -
- - -8.
64 -
Other industry 0.44 0.44 0.67 0.64 2.30 2.30 1.82 0.02 7.74
Res, comm & pub serv
(1)
0.05 0.04 0.02 0.02 - - - -0.95 -
Non-energy use - 0.26 0.33 0.53 0.55 0.45 0.33 - 1.23
Coking coal 6.78 5.02 4.46 4.29 4.73 5.08 3.35 -2.46 -2.11
Total electricity and heat
- - - - - - - --
Main activity producers
- - - - - - - --
Autoproducers
- - - - - - - --
Patent fuel/BKB plants
- - - - - - - --
Coke ovens
6.98 5.00 4.23 4.29 e 4.30 e 4.26 3.04 -2.74 -2.57
Blast furnace inputs
- - - - - - - --
Gas manufacture
- - - - - - - --
I
ndustry
- - - - - - - --
Iron and steel
- - - - - - - --
Chemical
- - - - - - - --
Non-metallic minerals
- - - - - - - --
Paper, pulp and print
- - - - - - - --
Other industry - - - - - - -
--
Res
, comm & pub serv
(1)
- - - - - - - --
Non-energy use
- - - - - - - --
Brown coal 13.17 30.26 40.47 39.76 44.22 42.92 38.23 7.18 1.24
Total electricity and heat 12.61 29.95 40.08 39.26 44.69 44.80 38.83 7.47 1.38
Main activity producers 12.61 29.95 40.08 39.26 44.69 44.80 38.83 7.47 1.38
Autoproducers - - - - - - - --
Patent fuel/BKB plants - - - - - - - --
Coke ovens - - - - - - - --
Gas manufacture - - - - - - - --
Industry 0.29 0.17 0.16 0.10 - - - -4.25 -
Iron and steel - - - - - - - --
Chem
ical - - - - - - - --
Non-metallic minerals - - - - - - - --
Paper, pulp and print 0.17 0.10 0.10 0.06 - - - -4.60 -
Other industry 0.12 0.08 0.07 0.04 - - - -3.77 -
Res, comm & pub serv
(1)
0.25 0.06 0.07 0.06 0.09 0.09 0.08 -11.22 1.68
Non-energy use - 0.09 0.14 0.16 - - - --
(1) Residential, commercial and public services.
* Please refer to notes and definitions in Part I.
Source: IEA/OECD Energy Statistics of OECD Countries
CANADA
6. Use of coal for selected end-uses*
INTERNATIONAL ENERGY AGENCY

IV.110 - COAL INFORMATION (2011 Edition) PART IV
1978
(1)
1980 1990 2000 2006 2007 2008 2009 2010
(US dollars / tce)
For electricity generation
Steam coal 37.88 48.61 61.02 20.54 30.19 31.97 .. .. ..
Heavy fuel oil 51.11 58.22 .. 87.53 162.14 190.56 .. .. ..
Natural gas 34.43 32.89 48.90 104.81 170.13 206.75 .. .. ..
For industry
Steam coal 43.98 42.74 .. .. .. .. .. .. ..
Coking coal 62.70 64.82 .. .. .. .. .. .. ..
High sulphur fuel oil 51.91 71.09 93.40 148.04 268.17 321.39 416.74 315.10 402.25
Low sulphur fuel oil .. .. .. .. .. .. .. .. ..
Natural gas 43.30 50.88 65.09 69.84 211.58 168.06 273.98 134.26 124.55
(Canadian dollars / unit)
(2)
For electricity generation
Steam coal 37.62 49.49 62.00 26.55 29.81 29.90 .. .. ..
Heavy fuel oil 79.95 93.37 .. 178.28 252.23 280.73 .. .. ..
Natural gas 50.49 49.45 73.37 200.12 248.12 285.55 .. .. ..
For industry
Steam coal 51.08 50.89 .. .. .. .. .. .. ..
Coking coal 73.20 77.58 .. .. .. .. .. .. ..
High sulphur fuel oil 81.21 114.01 149.50 301.51 417.17 473.47 610.17 493.24 568.31
Low sulphur fuel oil .. .. .. .. .. .. .. .. ..
Natural gas 63.50 76.50 97.67 133.36 308.56 232.11 376.07 197.03 164.97
(1) Earliest year for which split by coal type is available.
(2) For steam coal, coking coal and heavy fuel oil per metric tonne; for natural gas per 10
7
kilocalories GCV.
* Please refer to notes and definitions in Part I.
Source: IEA/OECD Energy Prices & Taxes
1973 1980 1990 2000 2006 2007 2008 2009 2010e
Total imports 14.95 15.40 13.64 21.50 18.13 14.99 17.62 11.76 11.72
Hard coal 14.62 15.15 13.32 18.15 14.25 9.41 10.65 8.07 8.54
Coking coal .. 6.21 4.22 4.15 4.11
e
3.21 3.18 2.13 3.02
Steam coal .. 8.94 9.10 14.00 10.14
e
6.20 7.47 5.94 5.53
Brown coal - - - 2.76 2.94 4.88 6.22 2.97 2.48
Peat - - - - - - - - -
Coal products
(1)
0.33 0.25 0.32 0.59 0.93 0.71 0.75 0.73 0.70
Total exports 10.91 14.91 30.63 27.53 24.07 26.29 27.62 24.25 28.21
Hard coal 10.56 14.84 30.45 27.25 23.83 25.92 26.58 24.01 28.06
Coking coal .. 13.73 26.37 24.11 21.40
e
22.65 22.47 18.17 23.22
Steam coal .. 1.10 4.08 3.14 2.43
e
3.26 4.11 5.84 4.84
Brown coal 0.00 - 0.00 - 0.14 0.21 0.97 0.17 0.07
Peat - - - - - - - - -
Coal products
(1)
0.34 0.07 0.18 0.28 0.10 0.17 0.07 0.07 0.08
(1) Coal products includes products derived from coal, for example: coke, coal tar, briquettes, patent fuels.
* Please refer to notes and definitions in Part I.
Source: IEA/OECD Energy Balances of OECD Countries, IEA/OECD Energy Statistics of OECD Countries
CANADA
7. Fuel prices to end users*
8. Coal and peat trade by type of coal*
(Mtce)
INTERNATIONAL ENERGY AGENCY

COAL INFORMATION (2011 Edition) PART IV - IV.111
1978
(1)
1985 1990 1995 2000 2007 2008 2009 2010e
Hard Coal 14250 14579 14169 9735 18790 10399 11026 8353 8845
Coking Coal 5454 6188 4491 4129 4296 3322 3286 2204 3122
Australia - - - - - - - - -
Canada - - - - - - - - -
Czech Republic - - - - - - - - -
Germany - - - - - - - - -
Poland - - - - - - - - -
United Kingdom - - - - - - - - -
United States 5454 6188 4491 4129 4296 3322 3286 2204 3122
Other OECD - - - - - - - - -
China, People's Rep. - - - - - - - - -
Colombia - - - - - - - - -
Indonesia - - - - - - - - -
South Africa - - - - - - - - -
Former Soviet Union
(2)
- - -------
Russian Federation
(3)
- - - - - - - - -
Other FSU
(3)
- - - - - - - - -
Venezuela - - - - - - - - -
Vietnam - - - - - - - - -
Non-specified/other - - - - - - - - -
Steam coal 8796 8391 9678 5606 14494 7077 7740 6149 5723
Australia - - - - - - - - -
Canada - - - - - - - - -
Czech Republic - - - - - - - - -
Germany - - - - - - - - -
Poland - - - - - - - - -
United Kingdom - - - - - - 5 200 1
United States 8796 8391 9639 5095 14090 5142 6037 4458 3888
Other OECD - - - - - - - 73 26
China, People's Rep. - - - - 155 - - - -
Colombia - - - 511 - 968 1389 1220 -
Indonesia - - - - - - - - -
South Africa - - - - 61 - - - -
Former Soviet Union
(2)
- - -------
Russian Federation
(3)
- - - - 26 279 226 157 12
Other FSU
(3)
- - - - - 64 19 41 151
Venezuela - - 39 - 91 624 64 - 32
Vietnam - - - - - - - - -
Non-specified/other - - - - 71 - - - 1613
(1) Earliest year for which split by coal type is available.
(2) For years prior to 1990, or if no details for individual Former Soviet Union republics.
(3) Data for former republics are not available separately for some OECD member countries.
* Please refer to notes and definitions in Part I.
Source: IEA/OECD Coal Statistics
CANADA
9. Hard coal imports by origin*
(thousand tonnes)
INTERNATIONAL ENERGY AGENCY