IEA Statistics. Coal Information 2011
Подождите немного. Документ загружается.


IV.132 - COAL INFORMATION (2011 Edition) PART IV
Average annual
percent change
1973 1980 1990 2000 2008 2009 2010e 73-90 90-09
TPES (Mtce) 27.13 27.34 24.80 26.62 27.45 26.58 28.12 -0.53 0.36
Coal and peat 2.76 8.39 8.70 5.69 5.73 5.73 5.49 6.99 -2.18
Oil 23.89 18.17 10.93 11.45 10.53 10.06 10.69 -4.50 -0.44
Natural Gas 0.00 0.00 2.60 6.35 5.82 5.58 6.26 65.00 4.11
Biofuels and waste 0.51 0.92 1.63 2.49 4.29 4.31 4.82 7.11 5.26
Nuclear - - - - - - - - -
Hydro 0.00 0.00 0.00 0.00 0.00 0.00 0.00 0.91 -2.02
Geothermal - - 0.00 0.00 0.02 0.02 0.01 - 8.88
Solar, wind, tide - 0.00 0.08 0.53 0.87 0.85 0.98 - 13.34
Net electricity trade
(1)
-0.03 -0.15 0.87 0.08 0.18 0.04 -0.14 - -14.83
Heat
(2)
- - 0.00 0.00 0.01 0.01 0.01 - 1.30
(1) Net trade between OECD and non-OECD countries.
(2) Ambient heat from heat pumps used in the transformation sector.
Source: IEA/OECD Energy Balances of OECD Countries
Average annual
percent change
1973 1980 1990 2000 2008 2009 2010e 73-90 90-09
GDP (2000 bil. US$) 90 101 124 160 177 168 171 1.90 1.61
TPES/GDP
(1)
0.30 0.27 0.20 0.17 0.16 0.16 0.16 -2.38 -1.22
Population (millions) 5.0 5.1 5.1 5.3 5.5 5.5 5.5 0.14 0.38
TPES/population
(1)
5.40 5.33 4.83 4.99 5.00 4.81 5.08 -0.66 -0.01
TPES/GDP
(2)
181.4 163.0 120.4 100.0 93.3 95.3 98.8 -2.38 -1.22
Coal and peat supply/GDP
(2)
86.2 233.9 197.4 100.0 91.1 96.0 90.1 5.00 -3.72
Elec. consumption/GDP
(2)
88.3 105.7 112.9 100.0 92.7 92.9 .. 1.46 -1.02
Elec. generation (TWh) 19 27 26 36 37 36 39 1.82 1.79
Industrial production
(2)
.. 56.7 74.7 100.0 104.7 88.9 90.5 - 0.92
(1) TPES/GDP in units of tce/2000 thousand US$, TPES/population in units of tce/capita.
(2) As index, 2000 = 100
Source: IEA/OECD Energy Balances of OECD Countries, OECD Main Economic Indicators
Average annual
percent change
1978
(1)
1980 1990 2000 2008 2009 2010e 78-90 90-09
Mtce:
Coking coal - - - - - - - - -
Steam coal - - - - - - - - -
Brown coal - - - - - - - - -
Peat - - - - - - - - -
Mt:
Coking coal - - - - - - - - -
Steam coal - - - - - - - - -
Brown coal - - - - - - - - -
Peat - - - - - - - - -
(1) Earliest year for which split by coal type is available.
* Please refer to notes and definitions in Part I.
Source: IEA/OECD Energy Balances of OECD Countries, IEA/OECD Energy Statistics of OECD Countries
DENMARK
1. Total primary energy supply (TPES) by fuel*
2. Energy supply, GDP and population*
3. Coal and peat production by type*
INTERNATIONAL ENERGY AGENCY

COAL INFORMATION (2011 Edition) PART IV - IV.133
(Mtce) Average annual
percent change
1973 1980 1990 2000 2007 2008 2009 73-90 90-09
TFC
(1)
21.87 21.05 18.82 20.32 21.62 21.25 20.32 -0.88 0.40
Coal and peat 0.65 0.83 0.62 0.44 0.39 0.33 0.20 -0.28 -5.81
Oil 19.02 16.17 9.79 9.38 9.74 9.40 8.88 -3.83 -0.51
Natural Gas - - 1.60 2.36 2.33 2.31 2.21 - 1.71
Biofuels and wastes 0.23 0.55 0.81 0.93 1.69 1.68 1.61 7.65 3.72
Geothermal - - - - - - - - -
Solar, wind, tide - 0.00 0.00 0.01 0.01 0.02 0.02 - 9.01
Electricity 1.98 2.66 3.48 3.99 4.11 4.09 3.88 3.39 0.57
Heat - 0.84 2.51 3.22 3.35 3.44 3.52 - 1.80
of which:
Total industry 4.79 4.51 3.85 4.19 4.04 3.85 3.33 -1.27 -0.76
Coal and peat 0.33 0.56 0.46 0.38 0.31 0.26 0.14 2.11 -6.06
Oil 3.81 3.02 1.31 1.08 1.07 0.93 0.79 -6.07 -2.65
Natural Gas - - 0.76 1.11 1.02 1.03 0.94 - 1.09
Biofuels and wastes 0.08 0.11 0.16 0.16 0.21 0.25 0.21 4.01 1.46
Geothermal - - - - - - - - -
Solar, wind, tide - - - - - - - - -
Electricity 0.57 0.71 1.04 1.23 1.23 1.19 1.05 3.64 0.04
Heat - 0.11 0.11 0.23 0.19 0.20 0.20 - 3.49
Total transport 3.86 4.32 4.93 5.76 6.73 6.63 6.29 1.44 1.30
Coal and peat 0.00 - - - - - - - -
Oil 3.85 4.31 4.90 5.71 6.68 6.58 6.23 1.43 1.27
Natural Gas - - - - - - - - -
Biofuels and wastes - - - - 0.01 0.01 0.01 - -
Electricity 0.01 0.02 0.03 0.04 0.04 0.05 0.05 3.87 3.54
Residential 9.90 7.97 5.72 5.94 6.35 6.31 6.29 -3.18 0.50
Coal and peat 0.31 0.25 0.07 0.02 0.01 0.01 0.01 -8.52 -7.90
Oil 8.66 5.96 1.81 1.11 0.74 0.69 0.66 -8.79 -5.20
Natural Gas - - 0.55 0.92 0.89 0.89 0.90 - 2.65
Biofuels and wastes 0.12 0.35 0.48 0.61 1.31 1.28 1.24 8.64 5.13
Geothermal - - - - - - - - -
Solar, wind, tide - 0.00 0.00 0.01 0.01 0.01 0.01 - 9.02
Electricity 0.81 0.91 1.19 1.25 1.27 1.26 1.24 2.27 0.23
Heat - 0.49 1.62 2.03 2.12 2.17 2.22 - 1.68
Comm & public services 0.46 1.75 2.46 2.61 2.84 2.85 2.81 10.38 0.71
Coal and peat 0.01 0.01 0.01 0.00 0.00 0.00 0.00 -3.42 -8.45
Oil - 0.72 0.46 0.19 0.11 0.11 0.11 - -7.41
Natural Gas - - 0.20 0.23 0.33 0.31 0.30 - 2.09
Biofuels and waste 0.02 0.02 0.04 0.09 0.08 0.07 0.06 5.04 1.94
Geothermal - - - - - - - - -
Solar, wind, tide - - 0.00 0.00 0.00 0.00 0.00 - 8.92
Electricity 0.43 0.75 1.03 1.22 1.34 1.35 1.32 5.28 1.32
Heat - 0.24 0.72 0.90 0.98 1.00 1.03 - 1.89
Non-energy use 1.02 0.59 0.43 0.42 0.44 0.37 0.36 -4.88 -1.05
Coal and peat - - - - - - - - -
Oil 1.02 0.59 0.43 0.42 0.44 0.37 0.36 -4.88 -1.05
Natural Gas - - - - - - - - -
(1) Total Final Consumption (TFC) excludes use in transformation processes and energy industry own use.
* Please refer to notes and definitions in Part I.
Source: IEA/OECD Energy Balances of OECD Countries
DENMARK
4. Final consumption of energy by fuel*
INTERNATIONAL ENERGY AGENCY

IV.134 - COAL INFORMATION (2011 Edition) PART IV
Average annual
percent change
1973 1980 1990 2000 2008 2009 2010e 73-90 90-09
Production - - - - - - - - -
Imports 2.7 8.7 8.9 5.5 6.3 5.7 3.9 7.2 -2.4
Exports -0.1 -0.1 -0.0 -0.1 -0.1 -0.1 -0.1 -1.0 0.6
Stock changes 0.1 -0.3 -0.2 0.3 -0.5 0.1 1.7 x x
Primary supply 2.8 8.4 8.7 5.7 5.7 5.7 5.5 7.0 -2.2
Statistical difference 0.0 0.2 -0.0 -0.0 0.1 0.0 .. x x
Total transformation -2.1 -7.8 -8.1 -5.2 -5.5 -5.6 .. 8.2 -1.9
Electricity and heat gen. -2.3 -8.0 -8.1 -5.2 -5.5 -5.6 .. 7.8 -2.0
Main activity producers
(1)
-2.3 -7.9 -8.1 -5.2 -5.5 -5.6 .. 7.7 -1.9
Autoproducers - -0.1 -0.1 -0.0 -0.0 -0.0 .. - -12.2
Gas works 0.2 0.2 0.1 0.0 0.0 0.0 .. -6.4 -5.9
Coal transformation
(2)
- - - - - - .. - -
BKB plants - - - - - - .. - -
Blast furnaces - - - - - - .. - -
Coke ovens - - - - - - .. - -
Patent fuel plants - - - - - - .. - -
Other transformation
(3)
- - - - - - .. - -
Energy ind. own use -0.0 -0.0 - - - - .. - -
Losses -0.0 -0.0 -0.0 -0.0 -0.0 -0.0 .. x x
Final consumption
(4)
0.7 0.8 0.6 0.4 0.3 0.2 .. -0.3 -5.8
Industry
(5)
0.3 0.6 0.5 0.4 0.3 0.1 .. 2.1 -6.1
Iron and steel 0.0 0.0 0.0 0.0 - - .. -14.6 -
Chemical 0.0 0.0 0.0 0.0 - - .. 15.1 -
Non-metallic minerals 0.1 0.4 0.2 0.2 0.2 0.1 .. 2.4 -3.3
Paper, pulp and print 0.0 0.1 0.0 0.0 0.0 0.0 .. 15.2 -27.9
Transport
(6)
0.0 - - - - - .. - -
Other
(7)
0.3 0.3 0.2 0.1 0.1 0.1 .. -4.2 -5.1
Comm. and pub. services 0.0 0.0 0.0 0.0 0.0 0.0 .. -3.4 -8.4
Residential 0.3 0.2 0.1 0.0 0.0 0.0 .. -8.5 -7.9
Non-energy use - - - - - - .. - -
(1) Main activity electricity and heat generation includes district heating.
(2) Coal transformation refers to the transformation of coal and peat to secondary and tertiary products (mainly coke,
(2)
briquettes, coke oven gas and blast furnace gas).
(3) Other transformation includes liquefaction and non-specified transformation processes.
(4) Final Consumption includes non-energy use and energy use (industry, transport and other).
(5) Please refer to notes and definitions in Part I for detailed explanation.
(6) Transport includes rail and inland waterways.
(7) Other includes commercial and public services, agriculture, and residential.
Source: IEA/OECD Energy Balances of OECD Countries
* as well as peat, peat briquettes and oil shale. Quantities have been converted to Mtce using calorific values reported by the respective countries.
* Please refer to notes and definitions in Part I.
DENMARK
5. Coal balance*
(Mtce)
* "Coal" refers to all types of coal, primary (anthracite, coking coal, other bituminous coal, sub-bituminous coal, lignite/brown coal) and derived fuels
* (including patent fuel, BKB, coke oven coke, gas coke, coal tar, coke oven gas, gas works gas, blast furnace gas and oxygen steel furnace gas),
INTERNATIONAL ENERGY AGENCY

COAL INFORMATION (2011 Edition) PART IV - IV.135
(million tonnes) Average annual
percent change
1978 1990 2000 2005 2007 2008 2009 78-90 90-09
Steam coal 5.65 9.99 6.64 6.29 7.90 6.84 6.78 4.86 -2.02
Total electricity and heat 4.99 9.40 6.19 5.91 7.55 6.68 6.64 5.43 -1.82
Main activity producers 4.93 9.34 6.18 5.90 7.54 6.68 6.63 5.47 -1.79
Autoproducers 0.06 0.06 0.02 0.01 0.00 0.00 0.01 0.41 -12.41
Patent fuel/BKB plants - - - - - - - --
Coke ovens - - - - - - - --
Blast furnace inputs - - - - - - - --
Gas manufacture 0.09 - - - - - - --
Industry 0.69 0.47 0.38 0.30 0.30 0.25 0.13 -3.18 -6.67
Iron and steel - - - - - - - --
Chemical - 0.00 0.02 0.02 - - - --
Non-metallic minerals 0.55 0.20 0.23 0.21 0.23 0.18 0.10 -8.07 -3.76
Paper, pulp and print 0.06 0.05 - - - - - -1.35 -
Other industry 0.09 0.22 0.13 0.07 0.07 0.06 0.03 7.85 -9.76
Res, comm & pub serv
(1)
0.01 0.03 0.00 - - - - 5.95 -
Non-energy use - - - - - - - --
Coking coal - - - - - - - --
Total electricity and heat
- - - - - - - --
Main activity producers
- - - - - - - --
Autoproducers
- - - - - - - --
Patent fuel/BKB plants
- - - - - - - --
Cok
e ovens
- - - - - - - --
Blast furnace inputs
- - - - - - - --
Gas manufacture
- - - - - - - --
Industry
- - - - - - - --
Iron and steel
- - - - - - - --
Chemical
- - - - - - - --
Non-metallic minerals
- - - - - - - --
P
aper, pulp and print
- - - - - - - --
Other industry - - - - - - -
--
Res, comm & pub serv
(1)
- - - - - - - --
Non-energy use
- - - - - - - --
Brown coal - - - - - - - --
Total electricity and heat - - - - - - - --
Main activity producers - - - - - - - --
Autoproducers - - - - - - - --
Patent fuel/BKB plants - - - - - - - --
Cok
e ovens - - - - - - - --
Gas manufacture - - - - - - - --
Industry - - - - - - - --
Iron and steel - - - - - - - --
Chemical - - - - - - - --
Non-metallic minerals - - - - - - - --
Paper, pulp and print - - - - - - - --
Ot
her industry - - - - - - - --
Res, comm & pub serv
(1)
- - - - - - - --
Non-energy use - - - - - - - --
(1) Residential, commercial and public services.
* Please refer to notes and definitions in Part I.
Source: IEA/OECD Energy Statistics of OECD Countries
DENMARK
6. Use of coal for selected end-uses*
INTERNATIONAL ENERGY AGENCY

IV.136 - COAL INFORMATION (2011 Edition) PART IV
1978
(1)
1980 1990 2000 2006 2007 2008 2009 2010
(US dollars / tce)
For electricity generation
Steam coal .. 55.86 .. .. .. .. .. .. ..
Heavy fuel oil .. 118.19 .. .. .. .. .. .. ..
Natural gas c c c c c c c c c
For industry
Steam coal 76.39 95.46 119.94 .. .. .. .. .. ..
Coking coal x x x x x x x x x
High sulphur fuel oil 69.50 145.83 .. .. .. .. .. .. ..
Low sulphur fuel oil .. .. 108.11 162.96 315.42 353.68 453.28 360.54 477.71
Natural gas 258.29 538.28 c c c c c 585.00 ..
(Danish crowns / unit)
(2)
For electricity generation
Steam coal .. 262 .. .. .. .. .. .. ..
Heavy fuel oil .. 918 .. .. .. .. .. .. ..
Natural gas c c c c c c c c c
For industry
Steam coal 421 538 742 .. .. .. .. .. ..
Coking coal x x x x x x x x x
High sulphur fuel oil 528 1133 .. .. .. .. .. .. ..
Low sulphur fuel oil .. .. 922 1817 2584 2654 3186 2664 3702
Natural gas 1830 3900 c c c c c 4031 ..
(1) Earliest year for which split by coal type is available.
(2) For steam coal, coking coal and heavy fuel oil per metric tonne; for natural gas per 10
7
kilocalories GCV.
* Please refer to notes and definitions in Part I.
Source: IEA/OECD Energy Prices & Taxes
1973 1980 1990 2000 2006 2007 2008 2009 2010e
Total imports 2.73 8.70 8.93 5.51 7.42 6.83 6.35 5.67 3.86
Hard coal 2.58 8.54 8.88 5.46 7.38 6.79 6.31 5.65 3.84
Coking coal .. 0.01 - - - - - - -
Steam coal .. 8.54 8.88 5.46 7.38 6.79 6.31 5.65 3.84
Brown coal - - - - - - - - -
Peat - - - - - - - - -
Coal products
(1)
0.14 0.16 0.05 0.05 0.04 0.03 0.04 0.02 0.02
Total exports 0.06 0.06 0.05 0.10 0.09 0.16 0.13 0.05 0.06
Hard coal - 0.00 0.05 0.10 0.09 0.16 0.13 0.05 0.06
Coking coal .. - - - - - - - -
Steam coal .. 0.00 0.05 0.10 0.09 0.16 0.13 0.05 0.06
Brown coal - - - - - - - - -
Peat - - - - - - - - -
Coal products
(1)
0.06 0.06 - 0.00 - - - - -
(1) Coal products includes products derived from coal, for example: coke, coal tar, briquettes, patent fuels.
* Please refer to notes and definitions in Part I.
Source: IEA/OECD Energy Balances of OECD Countries, IEA/OECD Energy Statistics of OECD Countries
DENMARK
7. Fuel prices to end users*
8. Coal and peat trade by type of coal*
(Mtce)
INTERNATIONAL ENERGY AGENCY

COAL INFORMATION (2011 Edition) PART IV - IV.137
1978
(1)
1985 1990 1995 2000 2007 2008 2009 2010e
Hard Coal 6110 12457 10255 13009 6416 8122 7569 6713 4570
Coking Coal - 6 - - - - - - -
Australia - - - - - - - - -
Canada - - - - - - - - -
Czech Republic - 4 - - - - - - -
Germany - 2 - - - - - - -
Poland - - - - - - - - -
United Kingdom - - - - - - - - -
United States - - - - - - - - -
Other OECD - - - - - - - - -
China, People's Rep. - - - - - - - - -
Colombia - - - - - - - - -
Indonesia - - - - - - - - -
South Africa - - - - - - - - -
Former Soviet Union
(2)
- - -------
Russian Federation
(3)
- - - - - - - - -
Other FSU
(3)
- - - - - - - - -
Venezuela - - - - - - - - -
Vietnam - - - - - - - - -
Non-specified/other - - - - - - - - -
Steam coal 6110 12451 10255 13009 6416 8122 7569 6713 4570
Australia 177 2484 1127 917 143 144 - - -
Canada 307 328 646 - - - - - -
Czech Republic 6 38 39 3 - - - - -
Germany 941 14 52 1 - 6 10 3 -
Poland 3078 2056 972 3476 2311 357 159 100 -
United Kingdom 145 1311 592 30 3 3 11 - -
United States 2 2271 3223 2423 - 6 344 516 375
Other OECD 8 30 8 26 177 400 409 158 182
China, People's Rep. - 29 57 - - - - - -
Colombia - 332 2057 1116 812 2475 1680 2019 1328
Indonesia - - - 382 - 288 - - -
South Africa 868 3496 - 3493 1672 2099 2243 1075 735
Former Soviet Union
(2)
528 - -------
Russian Federation
(3)
- - - 1078 1295 2252 2604 2710 1381
Other FSU
(3)
- - - 59 - 92 109 131 -
Venezuela - - - - - - - - -
Vietnam - - - 2 3 - - - -
Non-specified/other 50 62 e 1482 3 - - - - 569
(1) Earliest year for which split by coal type is available.
(2) For years prior to 1990, or if no details for individual Former Soviet Union republics.
(3) Data for former republics are not available separately for some OECD member countries.
* Please refer to notes and definitions in Part I.
Source: IEA/OECD Coal Statistics
DENMARK
9. Hard coal imports by origin*
(thousand tonnes)
INTERNATIONAL ENERGY AGENCY

IV.138 - COAL INFORMATION (2011 Edition) PART IV
1978
(1)
1985 1990 1995 2000 2007 2008 2009 2010e
Total Exports - 57 54 25 123 190 156 64 71
Total OECD - 57 54 25 123 190 156 64 71
Australia - - - - - - - - -
Austria - - - - - - - - -
Belgium - - - - - - - - -
Canada - - - - - - - - -
Chile - - - - - - - - -
Czech Republic - - - - - - - - -
Denmark - - - - - - - - -
Estonia - - - - - - - - -
Finland - - - - - - - - -
France - - - - - - - - -
Germany - - 9 10 76 102 129 32 70
Greece - - - - - - - - -
Hungary - - - - - - - - -
Iceland - - - - - - - - -
Ireland - - - - - - - - -
Israel - - - - - - - - -
Italy - - - - - - - - -
Japan - - - - - - - - -
Korea - - - - - - - - -
Luxembourg - - - - - - - - -
Mexico - - - - - - - - -
Netherlands - - - - - 7 - - -
New Zealand - - - - - - - - -
Norway - - 14 7 34 81 27 - -
Poland - - - - 13 - - 32 -
Portugal - - - - - - - - -
Slovak Republic - - - - - - - - -
Slovenia - - - - - - - - -
Spain - - - - - - - - -
Sweden - 54 31 8 - - - - 1
Switzerland - - - - - - - - -
Turkey - - - - - - - - -
United Kingdom - 3 - - - - - - -
United States - - - - - - - - -
Total Non-OECD - - - - - - - - -
Brazil - - - - - - - - -
Chinese Taipei - - - - - - - - -
Egypt - - - - - - - - -
India - - - - - - - - -
Romania - - - - - - - - -
Oth. Africa & Mid. East - - - - - - - - -
Other Latin America - - - - - - - - -
China
(2)
- - - - - - - - -
Other Asia & Oceania - - - - - - - - -
Other Non-OECD Europe
and Eurasia - - - - - - - - -
Non-Specified/Other - - - - - - - - -
(1) Earliest year for which split by coal type is available.
(2) China includes the People's Republic of China and Hong Kong, China.
* Please refer to notes and definitions in Part I.
Source: IEA/OECD Coal Statistics
DENMARK
11. Steam coal exports by destination*
(thousand tonnes)
INTERNATIONAL ENERGY AGENCY

COAL INFORMATION (2011 Edition) PART IV - IV.139
1990 1995 2000 2005 2006 2007 2008 2009 2010
Coking coal
(1)
93.62 535.51 390.83 625.03 .. 154.99 434.34 .. ..
Imports from:
Australia .. .. .. .. .. .. .. .. ..
Canada .. .. .. .. .. .. .. .. ..
Czech Republic .. .. .. .. .. .. .. .. ..
Poland .. .. 390.83 .. .. .. .. .. ..
United States .. .. .. .. .. .. .. .. ..
China .. .. .. .. .. .. .. .. ..
Colombia .. .. .. .. .. .. .. .. ..
South Africa .. .. .. .. .. .. .. .. ..
Former Soviet Union
(2)
.. .. .. .. .. .. .. .. ..
Steam coal
(3)
46.02 38.53 31.67 61.84 59.15 75.20 113.34 88.22 86.27
Imports from: 43.67 35.66 25.20 56.06 .. 67.34 .. 75.00 ..
Australia 50.24 39.52 .. .. .. .. .. .. ..
Canada 72.83 .. .. .. .. .. .. .. ..
Czech Republic 45.29 36.22 31.78 52.10 51.93 89.54 153.20 96.54 83.70
Poland 46.31 42.57 36.07 62.81 65.96 .. 138.51 74.51 ..
United States 43.94 .. .. .. .. .. .. .. ..
China 47.11 36.57 30.52 62.06 59.23 78.38 .. 97.37 84.83
Colombia .. 39.01 31.93 67.27 59.65 70.30 136.65 76.04 82.40
South Africa 41.65 40.89 32.65 59.88 60.51 73.66 109.46 90.53 92.94
Former Soviet Union
(2)
.. .. .. .. .. .. .. .. .. .. .. .. .. .. .. .. ..
Note: On occasion, shipment of extremely small quantities of high valued coal results in high import costs.
(1) Weighted average of individual countries using import volumes as weights. Prices exclude intra-EU trade.
(2) Former Soviet Union until 1991, Russian Federation starting in 1992.
(3) Bituminous steam coal only. Weighted average of individual countries using volumes as weights. Prices exclude intra-EU trade.
* Please refer to notes and definitions in Part I.
Source: IEA/OECD Coal Statistics
DENMARK
12. Coal import values by origin*
(average unit value, CIF, US$/tonne)
INTERNATIONAL ENERGY AGENCY
IV.140 - COAL INFORMATION (2011 Edition) PART IV
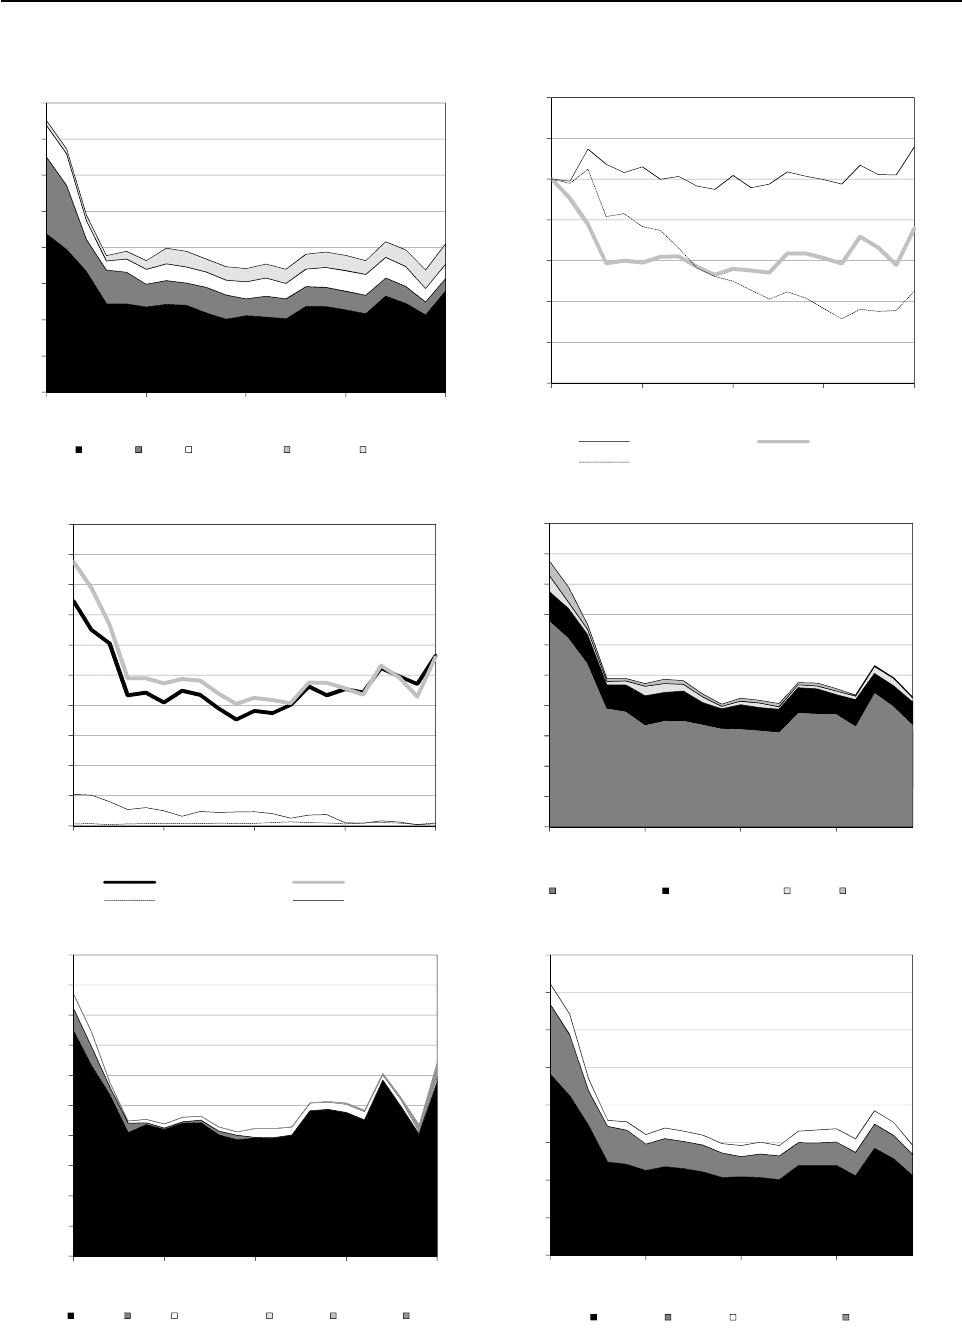
ESTONIA*
0
20
40
60
80
100
120
140
1990 1995 2000 2005 2010e
Figure 2: Coal supply indicators (1990 = 100)
Coal/TPES Coal/population
Coal/GDP
2
3
4
5
6
7
8
9
10
Figure 3: Primary coal supply (Mtce)
0
2
4
6
8
10
12
14
16
1990 1995 2000 2005 2010e
Figure 1: TPES by fuel (Mtce)
Coal Oil Natural Gas Nuclear Renewables
2
3
4
5
6
7
8
9
10
Figure 4: Coal consumption (Mtce)
2010e
2010e
INTERNATIONAL ENERGY AGENCY
*Please refer to notes and definitions in Part I. Peat is included in coal for all figures.
0
1
2
3
1990 1995 2000 2005 2010e
Production Coal supply
Exports Imports
0
1
2
3
1990 1995 2000 2005
Electricity and heat Other transformation Industry Other use
2009
0
5
10
15
20
25
30
35
40
1990 1995 2000 2005
Figure 6: CO
2
emissions by fuel (Mt CO
2
)
Coal Oil Natural Gas Other
2009
0
2
4
6
8
10
12
14
16
18
20
1990 1995 2000 2005 2010e
Figure 5: Electricity generation by fuel (TWh)
Coal Oil Natural Gas Hydro Nuclear Other
2010e
2010e
INTERNATIONAL ENERGY AGENCY

COAL INFORMATION (2011 Edition) PART IV - IV.141
Average annual
percent change
1973 1980 1990 2000 2008 2009 2010e 73-90 90-09
TPES (Mtce) .. .. 14.16 6.74 7.77 6.78 7.82 - -3.80
Coal and peat .. .. 8.77 4.25 4.92 4.28 5.61 - -3.70
Oil .. .. 4.24 0.93 0.94 0.72 0.69 - -8.94
Natural Gas .. .. 1.75 0.95 1.10 0.75 0.80 - -4.35
Biofuels and waste .. .. 0.27 0.73 0.90 1.00 1.09 - 7.14
Nuclear .. .. - - - - - - -
Hydro .. .. - 0.00 0.00 0.00 0.00 - -
Geothermal .. .. - - - - - - -
Solar, wind, tide .. .. - - 0.02 0.02 0.03 - -
Net electricity trade
(1)
.. .. -0.86 -0.11 -0.12 0.01 -0.40 - -
Heat
(2)
.. .. - - - - - - -
(1) Net trade between OECD and non-OECD countries.
(2) Ambient heat from heat pumps used in the transformation sector.
Source: IEA/OECD Energy Balances of OECD Countries
Average annual
percent change
1973 1980 1990 2000 2008 2009 2010e 73-90 90-09
GDP (2000 bil. US$) .. .. 6 6 9 8 8 - 1.69
TPES/GDP
(1)
.. .. 2.42 1.19 0.83 0.84 0.94 - -5.40
Population (millions) .. .. 1.6 1.4 1.3 1.3 1.3 - -0.89
TPES/population
(1)
.. .. 8.92 4.91 5.80 5.06 5.84 - -2.94
TPES/GDP
(2)
.. .. 204.2 100.0 70.2 71.2 79.5 - -5.40
Coal and peat supply/GDP
(2)
.. .. 200.6 100.0 70.5 71.3 90.5 - -5.30
Elec. consumption/GDP
(2)
.. .. 136.5 100.0 85.4 94.1 .. - -1.94
Elec. generation (TWh) .. .. 17 9 11 9 13 - -3.53
Industrial production
(2)
.. .. .. 100.0 178.2 135.3 163.6 - -
(1) TPES/GDP in units of tce/2000 thousand US$, TPES/population in units of tce/capita.
(2) As index, 2000 = 100
Source: IEA/OECD Energy Balances of OECD Countries, OECD Main Economic Indicators
Average annual
percent change
1978
(1)
1980 1990 2000 2008 2009 2010e 78-90 90-09
Mtce:
Coking coal .. .. - - - - - - -
Steam coal .. .. - - - - - - -
Brown coal .. .. 6.91 3.70 4.88 4.59 5.51 - -2.13
Peat .. .. 0.56 0.12 0.08 0.12 0.13 - -7.93
Mt:
Coking coal .. .. - - - - - - -
Steam coal .. .. - - - - - - -
Brown coal .. .. 22.49 11.73 16.12 14.94 17.93 - -2.13
Peat .. .. 1.73 0.35 0.21 0.33 0.36 - -8.39
(1) Earliest year for which split by coal type is available.
* Please refer to notes and definitions in Part I.
Source: IEA/OECD Energy Balances of OECD Countries, IEA/OECD Energy Statistics of OECD Countries
ESTONIA
1. Total primary energy supply (TPES) by fuel*
2. Energy supply, GDP and population*
3. Coal and peat production by type*
INTERNATIONAL ENERGY AGENCY