IEA Statistics. Oil Information 2011
Подождите немного. Документ загружается.


III.88 - OIL INFORMATION (2011 Edition)
AUSTRALIA
Table 7B: Imports by country of origin
000 metric tons
2008 2009 2010e 2008 2009 2010e 2008 2009 2010e
Total products Liquefied petroleum gases Naphtha
Australia - - - - - - - - -
Bel
g
ium 2 2 - - - - - - -
Canada 1 1 - - - - - - -
Czech Re
p
ubli
c
- - - - - - - - -
Denmark - - - - - - - - -
Finland - - - - - - - - -
France 3 3 - - - - - - -
German
y
3 3 1 - - - - - -
Greece - - - - - - - - -
Hun
g
ar
y
- - - - - - - - -
Ireland - - - - - - - - -
Ital
y
1 1 - - - - - - -
Ja
p
an 1 067 1 636 1 705 - - - - - -
Korea 659 1 423 1 620 2 1 - - - -
Mexic
o
- - - - - - - - -
Netherlands 27 4 - - - - - - -
New Zealand 37 203 - - - - - - -
Norwa
y
3 - - - - - - - -
Poland - - - - - - - - -
S
p
ain 1 1 - - - - - - -
Sweden 2 1 4 - - - - - -
Turke
y
- 68 34 - - - - - -
United Kin
g
dom 3 2 33 - - - - - -
United States 715 754 567 - 41 - - - -
Othe
r
- - - - - - - - -
OECD 2 524 4 102 3 964 2 42 - - - -
Ar
g
entina - - 19 - - - - - -
Brazil - - - - - - - - -
Colombia - - - - - - - - -
Ecuado
r
- - - - - - - - -
Netherlands Antilles - - - - - - - - -
Peru - - - - - - - - -
Trinidad and Toba
go
- - - - - - - - -
Venezuela - - - - - - - - -
Othe
r
- - - - - - - - -
Latin America - - 19 - - - - - -
Kazakhstan - - - - - - - - -
Russian Federation - - - - - - - - -
Other - - - - - - - - -
Non-OECD Europe/Eurasia
- - - - - - - - -
Iran - - 79 - - 79 - - -
Ira
q
- - - - - - - - -
Kuwai
t
88 86 68 88 86 68 - - -
Oman - 79 34 - - - - - -
Qata
r
88 119 337 88 88 337 - - -
Saudi Arabia 302 168 1 261 167 1 - - -
United Arab Emirates 50 93 38 49 93 38 - - -
Othe
r
31 - - - - - - - -
Middle East 559 545 557 486 434 523 - - -
India 3 3 9 - - - - - -
Indonesi
a
10 39 74 - - - - - -
Sin
g
a
p
ore 8 243 8 218 8 223 - - - - - -
Othe
r
1 016 766 808 5 9 1 - - -
Asia 9 272 9 026 9 114 5 9 1 - - -
China 264 231 198 - 2 - - - -
Al
g
eria - - - - - - - - -
An
g
ola - - - - - - - - -
Cameroon - - - - - - - - -
E
gypt
- 1 - - - - - - -
Gabon - - - - - - - - -
Lib
y
an Arab Jamahiri
y
a - - - - - - - - -
Ni
g
eria - - - - - - - - -
Tunisia - - - - - - - - -
Othe
r
4 4 20 - - 19 - - -
Africa 4 5 20 - - 19 - - -
Non-spec./Other 1 491 1 320 1 429 - - - - - -
Total imports 14 114 15 229 15 301 493 487 543 - - -
Memo: Total OPEC 528 466 523 486 434 523 - - -
Source: Annual Oil Statistics.
INTERNATIONAL ENERGY AGENCY

OIL INFORMATION (2011 Edition) - III.89
AUSTRALIA
Table 7C: Imports by country of origin
000 metric tons
2008 2009 2010e 2008 2009 2010e 2008 2009 2010e
Total gasoline Total kerosene Gas/diesel
Australia - - - - - - - - -
Bel
g
ium - - - - - - - - -
Canada - - - - - - - - -
Czech Re
p
ubli
c
- - - - - - - - -
Denmark - - - - - - - - -
Finland - - - - - - - - -
France - - - - - - - - -
German
y
- - - - - - - - -
Greece - - - - - - - - -
Hun
g
ar
y
- - - - - - - - -
Ireland - - - - - - - - -
Ital
y
- - - - - - - - -
Ja
p
an - 30 42 79 139 49 976 1 455 1 607
Korea 13 59 206 35 145 83 582 1 175 1 268
Mexic
o
- - - - - - - - -
Netherlands 21 1 - - - - 1 1 -
New Zealand - - - - - - 6 3 -
Norwa
y
-- -- - - 3 - -
Poland - - - - - - - - -
S
p
ain - - - - - - - - -
Sweden - - - - - - - - -
Turke
y
- 68 34 - - - - - -
United Kin
g
dom - - 33 - - - - - -
United States 23 - - - - - 13 23 2
Othe
r
- - - - - - - - -
OECD 57 158 315 114 284 132 1 581 2 657 2 877
Ar
g
entina - - - - - - - - -
Brazil - - - - - - - - -
Colombia - - - - - - - - -
Ecuado
r
- - - - - - - - -
Netherlands Antilles - - - - - - - - -
Peru - - - - - - - - -
Trinidad and Toba
go
- - - - - - - - -
Venezuela - - - - - - - - -
Othe
r
- - - - - - - - -
Latin America - - - - - - - - -
Kazakhstan - - - - - - - - -
Russian Federation - - - - - - - - -
Other - - - - - - - - -
Non-OECD Europe/Eurasia
- - - - - - - - -
Iran - - - - - - - - -
Ira
q
- - - - - - - - -
Kuwai
t
- - - - - - - - -
Oman - 79 34 - - - - - -
Qata
r
- 31 - - - - - - -
Saudi Arabia - - - - - - 41 - -
United Arab Emirates - - - - - - - - -
Othe
r
31 - - - - - - - -
Middle East 31 110 34 - - - 41 - -
India - - - - - - - - -
Indonesi
a
- - - - - - - 24 74
Sin
g
a
p
ore 2 411 2 500 2 436 1 173 1 245 1 444 4 036 3 909 3 899
Othe
r
82 217 66 175 75 172 643 305 411
Asia 2 493 2 717 2 502 1 348 1 320 1 616 4 679 4 238 4 384
China - - - - - - 1 61 30
Al
g
eria - - - - - - - - -
An
g
ola - - - - - - - - -
Cameroon - - - - - - - - -
E
gypt
- - - - - - - - -
Gabon - - - - - - - - -
Lib
y
an Arab Jamahiri
y
a - - - - - - - - -
Ni
g
eria - - - - - - - - -
Tunisia - - - - - - - - -
Othe
r
- - - - - - - - -
Africa - - - - - - - - -
Non-spec./other - 2 - - - - - 3 -
Total imports 2 581 2 987 2 851 1 462 1 604 1 748 6 302 6 959 7 291
Memo: Total OPEC - 31 - - - - 41 - -
Source: Annual Oil Statistics.
INTERNATIONAL ENERGY AGENCY

III.90 - OIL INFORMATION (2011 Edition)
AUSTRALIA
Table 7D: Imports by country of origin
000 metric tons
2008 2009 2010e 2008 2009 2010e 2008 2009 2010e
Fuel oil (residual) Petroleum coke Other products
Australia - - - - - - - - -
Bel
g
ium - - - - - - 2 2 -
Canada - - - - - - 1 1 -
Czech Re
p
ubli
c
- - - - - - - - -
Denmark - - - - - - - - -
Finland - - - - - - - - -
France - - - - - - 3 3 -
German
y
- - - - - - 3 3 1
Greece - - - - - - - - -
Hun
g
ar
y
- - - - - - - - -
Ireland - - - - - - - - -
Ital
y
- - - - - - 1 1 -
Ja
p
an 3 6 - - - 5 9 6 2
Korea - 4 - - - - 27 39 63
Mexic
o
- - - - - - - - -
Netherlands - 1 - - - - 5 1 -
New Zealand 31 200 - - - - - - -
Norwa
y
- - - - - - - - -
Poland - - - - - - - - -
S
p
ain - - - - - - 1 1 -
Sweden - - - - - - 2 1 4
Turke
y
- - - - - - - - -
United Kin
g
dom - - - - - - 3 2 -
United States - - - 612 645 529 67 45 36
Othe
r
- - - - - - - - -
OECD 34 211 - 612 645 534 124 105 106
Ar
g
entina - - - - - 19 - - -
Brazil - - - - - - - - -
Colombia - - - - - - - - -
Ecuado
r
- - - - - - - - -
Netherlands Antilles - - - - - - - - -
Peru - - - - - - - - -
Trinidad and Toba
go
- - - - - - - - -
Venezuela - - - - - - - - -
Othe
r
- - - - - - - - -
Latin America - - - - - 19 - - -
Kazakhstan - - - - - - - - -
Russian Federation - - - - - - - - -
Other - - - - - - - - -
Non-OECD Europe/Eurasia
- - - - - - - - -
Iran - - - - - - - - -
Ira
q
- - - - - - - - -
Kuwai
t
- - - - - - - - -
Oman - - - - - - - - -
Qata
r
- - - - - - - - -
Saudi Arabia - 1 - - - - - - -
United Arab Emirates - - - - - - 1 - -
Othe
r
- - - - - - - - -
Middle East - 1 - - - - 1 - -
India - 1 - - - - 3 2 9
Indonesi
a
10 15 - - - - - - -
Sin
g
a
p
ore - - - - - - 623 564 444
Othe
r
4 42 - - - - 107 118 158
Asia 14 58 - - - - 733 684 611
China 1 11 - 257 153 165 5 4 3
Al
g
eria - - - - - - - - -
An
g
ola - - - - - - - - -
Cameroon - - - - - - - - -
E
gypt
- - - --- - 1 -
Gabon - - - - - - - - -
Lib
y
an Arab Jamahiri
y
a - - - - - - - - -
Ni
g
eria - - - - - - - - -
Tunisia - - - - - - - - -
Othe
r
- - - - - - 4 4 1
Africa - - - - - - 4 5 1
Non-spec./other 1 491 1 315 1 428 - - - - - 1
Total imports 1 540 1 596 1 428 869 798 718 867 798 722
Memo: Total OPEC - 1 - - - - 1 - -
Source: Annual Oil Statistics.
INTERNATIONAL ENERGY AGENCY

OIL INFORMATION (2011 Edition) - III.91
AUSTRALIA
Table 8A: Exports by country of destination
000 metric tons
2008 2009 2010e 2008 2009 2010e 2008 2009 2010e
Crude oil Natural gas liquids Feedstocks and other
Australia - - - - - - - - -
Austria - - - - - - - - -
Bel
g
ium - - - - - - - - -
Canada - - - - - - - - -
Denmark - - - - - - - - -
Finland - - - - - - - - -
France - - - - - - - - -
German
y
- - - - - - - - -
Greece - - - - - - - - -
Ireland - - - - - - - - -
Ital
y
- - - - - - - - -
Ja
p
an 1 520 1 827 1 389 863 800 1 073 301 160 155
Luxembour
g
- - - - - - - - -
Mexic
o
- - - - - - - - -
Netherlands - - - - - - - - -
Norwa
y
- - - - - - - - -
Portu
g
al - - - - - - - - -
S
p
ain - - - - - - - - -
Sweden - 35 38 - - - - - -
Switzerland - - - - - - - - -
Turke
y
- - - - - - - - -
United Kin
g
dom - - - - - - - - -
United States 926 1 137 584 - - - - - -
Other OECD 3 399 3 747 2 926 194 253 81 42 26 58
OECD 5 845 6 746 4 937 1 057 1 053 1 154 343 186 213
Africa - - - - 15 3 - - -
Latin America - 81 83 - - - - - -
Asia 5 045 4 853 6 777 99 98 90 728 510 539
China 765 822 1 744 253 192 201 72 53 -
Non-OECD Euro
p
e/Eurasi
a
- - - - - - - - -
Russian Federation - - - - - - - - -
Middle Eas
t
- - - - - - - - -
Non-s
p
ecified/Othe
r
-- - --52 - 3 2
Non-OECD 5 810 5 756 8 604 352 305 346 800 566 541
Total exports 11 655 12 502 13 541 1 409 1 358 1 500 1 143 752 754
Total products Liquefied petroleum gas Naphtha
Australia - - - - - - - - -
Austria - - - - - - - - -
Bel
g
ium - - - - - - - - -
Canada 2 - - - - - - - -
Denmark - - - - - - - - -
Finland - - - - - - - - -
France - - - - - - - - -
German
y
1 - - - - - - - -
Greece - - - - - - - - -
Ireland - - - - - - - - -
Ital
y
1 - - - - - - - -
Ja
p
an 65 51 28 - - - - - -
Luxembour
g
- - - - - - - - -
Mexic
o
1 - - - - - - - -
Netherlands 2 - - - - - - - -
Norwa
y
- - - - - - - - -
Portu
g
al - - - - - - - - -
S
p
ain - - - - - - - - -
Sweden 1 - - - - - - - -
Switzerland - - - - - - - - -
Turke
y
- - - - - - - - -
United Kin
g
dom - - - - - - - - -
United States 3 - 15 - - - - - -
Other OECD 633 306 246 - - - - - -
OECD 709 357 289 - - - - - -
Africa - 1 - - - - - - -
Latin America 2 - - - - - - - -
Asia 667 587 302 - - - - - -
China 55 4 8 - - - - - -
Non-OECD Euro
p
e/Eurasi
a
- - - - - - - - -
Russian Federation - - - - - - - - -
Middle Eas
t
- - 5 - - - - - -
Non-s
p
ecified/othe
r
29 18 90 - - - - - -
Non-OECD 753 610 405 - - - - - -
Total exports 1 462 967 694 - - - - - -
Source: Annual Oil Statistics.
INTERNATIONAL ENERGY AGENCY

III.92 - OIL INFORMATION (2011 Edition)
AUSTRALIA
Table 8B: Exports by country of destination
000 metric tons
2008 2009 2010e 2008 2009 2010e 2008 2009 2010e
Total gasoline Total kerosene Gas/diesel oil
Australia - - - - - - - - -
Austria - - - - - - - - -
Bel
g
ium -- - --- - - -
Canada - - - - - - - - -
Denmark - - - - - - - - -
Finland - - - - - - - - -
France - - - - - - - - -
German
y
-- - --- - - -
Greece - - - - - - - - -
Ireland - - - - - - - - -
Ital
y
-- - --- - - -
Ja
p
an -- - --- 3 - -
Luxembour
g
-- - --- - - -
Mexic
o
-- - --- - - -
Netherlands - - - - - - - - -
Norwa
y
-- - --- - - -
Portu
g
al -- - --- - - -
S
p
ain -- - --- - - -
Sweden - - - - - - - - -
Switzerland - - - - - - - - -
Turke
y
-- - --- - - -
United Kin
g
dom -- - --- - - -
United States - - - - - 15 - - -
Other OECD 445 174 189 118 84 41 38 16 -
OECD 445 174 189 118 84 56 41 16 -
Africa - - - - - - - - -
Latin America - - - - - - - - -
Asia 80 42 1 - - - 283 273 131
China - - - - - - 44 - -
Non-OECD Euro
p
e/Eurasi
a
-- - --- - - -
Russian Federation - - - - - - - - -
Middle Eas
t
-- - --- - - -
Non-s
p
ecified/Othe
r
1 1 - - - - 21 13 22
Non-OECD 81 43 1 - - - 348 286 153
Total exports 526 217 190 118 84 56 389 302 153
Fuel oil (residual) Petroleum coke Other products
Australia - - - - - - - - -
Austria - - - - - - - - -
Bel
g
ium -- - --- - - -
Canada 2 - - - - - - - -
Denmark - - - - - - - - -
Finland - - - - - - - - -
France - - - - - - - - -
German
y
1 - - - - - - - -
Greece - - - - - - - - -
Ireland - - - - - - - - -
Ital
y
1 - - - - - - - -
Ja
p
an 48 41 22 - - - 14 10 6
Luxembour
g
-- - --- - - -
Mexic
o
1 - - - - - - - -
Netherlands 2 - - - - - - - -
Norwa
y
-- - --- - - -
Portu
g
al -- - --- - - -
S
p
ain -- - --- - - -
Sweden 1 - - - - - - - -
Switzerland - - - - - - - - -
Turke
y
-- - --- - - -
United Kin
g
dom -- - --- - - -
United States 3 - - - - - - - -
Other OECD 1 6 - - - - 31 26 16
OECD 60 47 22 - - - 45 36 22
Africa - - - - - - - 1 -
Latin America 2 - - - - - - - -
Asia 169 128 61 - - - 135 144 109
China 5 - 5 - - - 6 4 3
Non-OECD Euro
p
e/Eurasi
a
-- - --- - - -
Russian Federation - - - - - - - - -
Middle Eas
t
-- 5 --- - - -
Non-s
p
ecified/othe
r
7 4 4 - - - - - 64
Non-OECD 183 132 75 - - - 141 149 176
Total exports 243 179 97 - - - 186 185 198
Source: Annual Oil Statistics.
INTERNATIONAL ENERGY AGENCY
OIL INFORMATION (2011 Edition) - III.93
A
USTRI
A
* Excluding electricity trade.
** Includes hydro, geothermal, solar, wind, combustible renewables and waste, etc.
Source: Annual Energy Balances.
0
10
20
30
40
50
60
Coal Oil Gas Nuclear Other **
Percentage
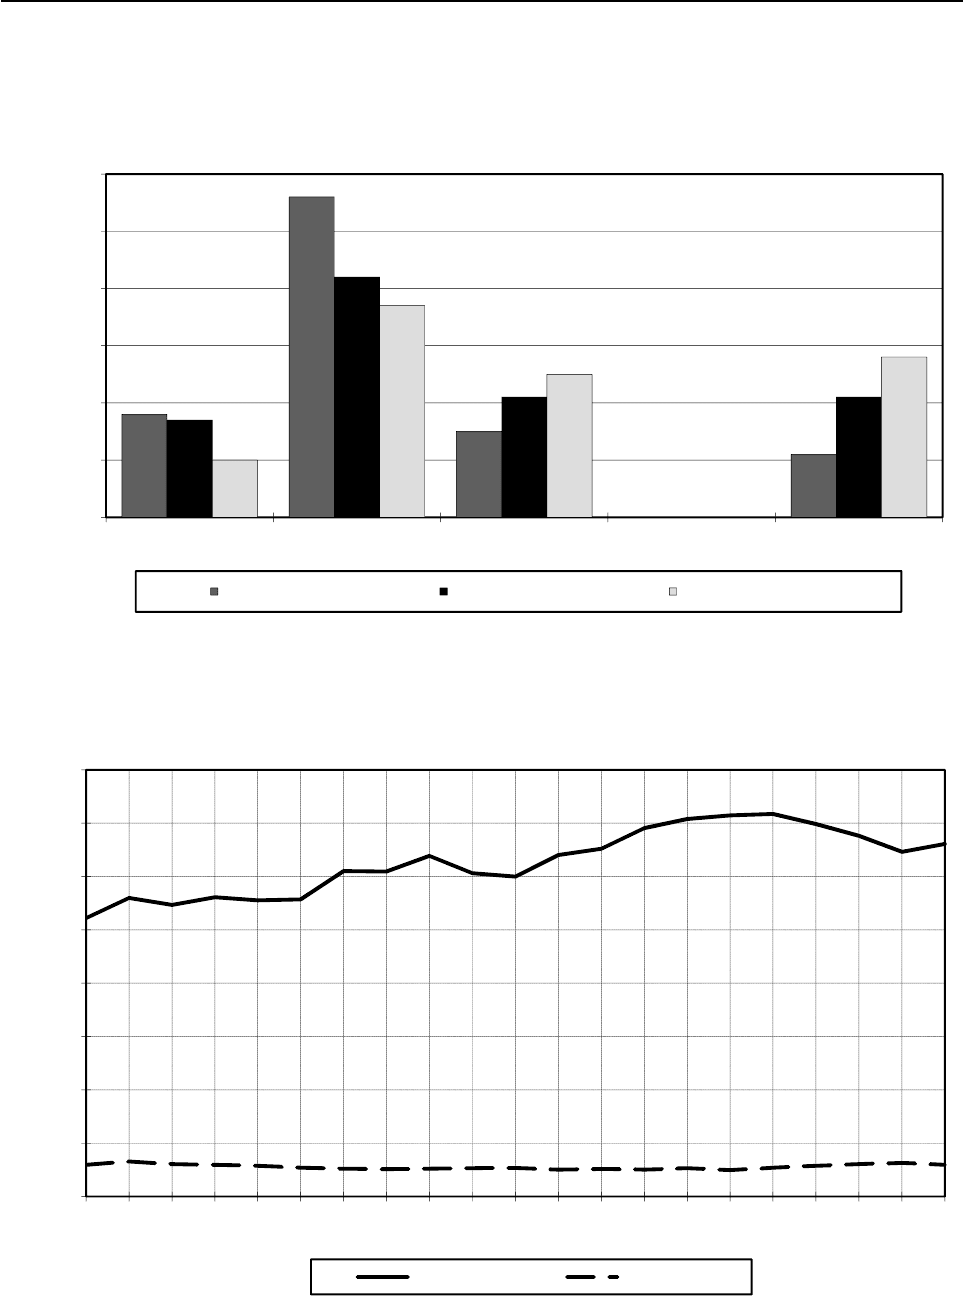
Figure 1. Fuel shares of TPES *
1973 TPES = 21 Mtoe 1990 TPES = 25 Mtoe 2010e TPES = 33 Mtoe
16
Figure 2. Oil production and consumption
*** Includes refinery fuel and international marine bunkers.
Source: Annual Oil Statistics.
0
2
4
6
8
10
12
14
16
1990
1991
1992
1993
1994
1995
1996
1997
1998
1999
2000
2001
2002
2003
2004
2005
2006
2007
2008
2009
2010e
Million Metric Tons
Fi
gure
2
.
Oil
pro
d
uc
ti
on an
d
consump
ti
on
Consumption *** Production
INTERNATIONAL ENERGY AGENCY

III.94 - OIL INFORMATION (2011 Edition)
AUSTRIA
Table 1: Oil supply and consumption - summary table
000 metric tons
1973 1978 1980 1990 2007 2008 2009 2010e
Indigenous production
1
2 596 1 815 1 500 1 190 1 145 1 223 1 259 1 193
Crude oil - 1 791 1 448 1 149 853 862 909 874
NGL - 24 52 41 129 118 131 138
Othe
r
- - - - 163 243 219 181
+ Net imports 9 635 10 321 10 894 9 652 12 743 12 439 11 689 11 831
Crude oil, NGL, othe
r
6 633 8 158 8 868 7 898 7 927 8 188 7 594 6 984
Oil products 3 002 2 163 2 026 1 754 4 816 4 251 4 095 4 847
- Intl. marine bunkers - - - - - - - -
+ Stock changes - 95 - 646 - 302 - 234 126 - 128 56 246
TOTAL SUPPLY 12 136 11 490 12 092 10 608 14 014 13 534 13 004 13 270
Refinery intake 9 226 9 989 10 739 9 149 9 199 9 423 8 857 8 273
Refinery output 8 817 9 874 10 252 8 895 9 125 9 408 8 768 8 273
LPG + ethane 92 122 199 47 70 98 92 87
Naphtha 134 4 18 475 937 909 870 892
Kerosenes 120 128 135 322 605 480 319 487
Gasolines 1 558 1 620 1 797 2 631 1 703 1 684 1 739 1 518
Gas/diesel oil 2 362 2 640 2 543 2 770 3 588 4 099 3 699 3 393
Fuel oil 3 806 4 429 4 372 1 913 880 769 852 922
Other products 745 931 1 188 737 1 342 1 369 1 197 974
- Refinery losse
s
409 115 487 254 74 15 89 -
+ Returns - - 18 86 2 3 11 10
- Statistical differences 122 - 164 - 10 - - 15 - 2 9 59
TOTAL CONSUMPTION 11 605 11 539 11 633 10 440 13 957 13 524 12 917 13 221
Transformation and energy 1 487 1 644 1 739 1 447 1 449 1 343 1 118 ..
Crude oil - - ---- - ..
LPG + ethane 36 51 39 9 22 21 40 ..
Gas/diesel oil 7 4 - - 5 6 10 ..
Fuel oil 1 289 1 322 1 324 806 533 477 417 ..
Petroleum coke - - - 57 73 66 67 ..
Othe
r
155 267 376 575 816 773 584 ..
Transport 3 814 4 054 4 014 4 696 8 418 8 006 7 864 ..
Motor gasolin
e
2 218 2 281 2 395 2 551 1 946 1 750 1 844 ..
Gas/diesel oil 1 193 1 424 1 283 1 767 5 690 5 472 5 335 ..
Subtotal 3 411 3 705 3 678 4 318 7 636 7 222 7 179 ..
Aviation fuels 112 106 140 302 726 729 636 ..
Othe
r
291 243 196 76 56 55 49 ..
Industry 3 192 2 737 1 975 1 820 2 184 2 098 2 093 ..
Naphtha 142 16 35 435 813 720 757 ..
LPG + ethane 37 50 44 64 36 36 37 ..
Gas/diesel oil 142 - 30 80 428 426 424 ..
Fuel oil 2 140 1 872 914 517 220 215 256 ..
Othe
r
731 799 952 724 687 701 619 ..
Other 3 112 3 104 3 905 2 477 1 906 2 077 1 842 ..
Gas/diesel oil 1 032 1 391 1 400 1 494 1 641 1 857 1 674 ..
Fuel oil 2 032 1 664 2 415 913 159 123 80 ..
Othe
r
48 49 90 70 106 97 88 ..
Memo: Non-energy use 1 136 1 021 1 140 1 219 1 498 1 414 1 372 ..
Chem/petchem. feedst. 214 208 368 499 872 809 795 ..
Other 922 813 772 720 626 605 577 ..
1. Includes inputs from other sources.
Source: Annual Oil Statistics.
INTERNATIONAL ENERGY AGENCY

OIL INFORMATION (2011 Edition) - III.95
AUSTRIA
Table 2: Supply of crude oil, NGL, feedstocks and other hydrocarbons
000 metric tons
1973 1978 1980 1990 2007 2008 2009 2010e
CRUDE OIL
Indigenous productio
n
- 1 791 1 448 1 149 853 862 909 874
+ Imports - 8 066 8 318 6 797 7 591 7 864 7 424 6 764
- Exports - - ---- - -
- Direct use - - ---- - -
+ Stock change - - 123 - 81 6 104 - 60 - 27 45
- Statistical differences - - 139 - - - - - - 78
Refinery intake - 9 873 9 685 7 952 8 548 8 666 8 306 7 761
Closing stock level - 2 555 412 751 866 926 953 908
NATURAL GAS LIQUIDS
Indigenous productio
n
- 24 52 41 129 118 131 138
+ Imports - - - - 50 - - -
- Exports - - ---- - -
- Direct use - - - - 38 40 38 47
+ Stock change - - ---- - -
- Statistical differences - - - - - - - -
Refinery intake - 24 52 41 141 78 93 91
Closing stock level - - - - - - - -
REFINERY FEEDSTOCKS
Backflows - - ---- - -
+ Transfers - - 18 86 92 46 19 12
+ Imports - 92 550 1 009 305 347 174 255
- Exports - - - - 19 23 4 35
+ Stock change - - 434 - 26 - 31 66 50 8
- Statistical differences - - - - - - - -
Refinery intake - 92 1 002 1 069 347 436 239 240
Closing stock level - - 1 740 996 778 712 662 654
OTHER HYDROCARBONS
Indigenous productio
n
- - - - 163 243 219 181
+ Imports - - - 92 - - - -
- Exports - - ---- - -
- Direct use - - ---- - -
+ Stock change - - - - 5 - - - -
- Statistical differences - - - - - - - -
Refinery intake - - - 87 163 243 219 181
Closing stock level - - - 12 11 11 11 11
CRUDE OIL, NGL, FEEDSTOCKS AND OTHER
Indigenous productio
n
2 596 1 815 1 500 1 190 1 145 1 223 1 259 1 193
+ Backflows - - ---- - -
+ Transfers - - 18 86 92 46 19 12
+ Imports 6 633 8 158 8 868 7 898 7 946 8 211 7 598 7 019
- Exports - - - - 19 23 4 35
- Direct use - - - - 38 40 38 47
+ Stock change 15 - 123 353 - 25 73 6 23 53
- Statistical differences 18 - 139 - - - - - - 78
Refinery intake 9 226 9 989 10 739 9 149 9 199 9 423 8 857 8 273
Closing stock level 2 465 2 555 2 152 1 759 1 655 1 649 1 626 1 573
Source: Annual Oil Statistics.
INTERNATIONAL ENERGY AGENCY

III.96 - OIL INFORMATION (2011 Edition)
AUSTRIA
Table 3: Motor gasoline - supply
000 metric tons
1973 1978 1980 1990 2007 2008 2009 2010e
MOTOR GASOLINE
Refinery output 1 558 1 620 1 797 2 631 1 703 1 684 1 739 1 518
+ Imports 715 680 741 257 891 754 772 859
- Exports - - 6 282 657 697 575 596
+ Transfers - - ---- - -
+ Stock change - - 20 - 73 - 55 9 9 - 92 41
- Statistical differences 55 - 5 2 - - - - -
Total consumption 2 218 2 285 2 457 2 551 1 946 1 750 1 844 1 822
Closing stock level - 311 420 307 241 232 324 283
Table 4: Aviation fuels - supply
000 metric tons
1973 1978 1980 1990 2007 2008 2009 2010e
AVIATION GASOLINE
Refinery output - - - - - - - -
+ Imports - - ---- - -
- Exports - - ---- - -
+ Transfers - - ---- - -
+ Stock change - - ---- - -
- Statistical differences - - - - - - - -
Total consumption - - - - - - - -
Closing stock level - - - - - - - -
GASOLINE TYPE JET FUEL
Refinery output - - - - - - - -
+ Imports 3 3 3 3 5 7 4 2
- Exports - - - - 3 4 2 -
+ Transfers - - ---- - -
+ Stock change - - - - - 1 1 -
- Statistical differences - - - - - - - -
Total consumption 3 3 3 3 2 4 3 2
Closing stock level - - - - 2 1 - -
KEROSENE TYPE JET FUEL
Refinery output 108 102 132 291 604 472 313 479
+ Imports - 1 - 13 159 252 228 193
- Exports - - - 5 1 2 - -
+ Transfers - - ---- - -
+ Stock change - - 5 - - 38 3 92 12
- Statistical differences - 1 - - - - - - -
Total consumption 109 103 137 299 724 725 633 684
Closing stock level - 10 48 7 119 116 24 12
Source: Annual Oil Statistics.
INTERNATIONAL ENERGY AGENCY

OIL INFORMATION (2011 Edition) - III.97
AUSTRIA
Table 5A: Gas/diesel oil - supply and consumption
000 metric tons
1973 1978 1980 1990 2007 2008 2009 2010e
Refinery output 2 362 2 640 2 543 2 770 3 588 4 099 3 699 3 393
+ Recycled products - - - - - - - -
+ Imports 54 182 352 576 5 016 4 916 4 659 5 130
- Exports 1 - - 3 955 1 074 838 874
- Intl. marine bunkers - - - - - - - -
+ Transfers - - - - - - 4 - -
+ Stock changes - - 7 - 182 - 2 115 - 176 - 77 40
- Statistical differences 41 - 4 - - - - - 22
Total consumption 2 374 2 819 2 713 3 341 7 764 7 761 7 443 7 667
Transformation 7 2 - - 5 5 10 ..
Main activity producer electricity - - - - 1 1 1 ..
Autoproducer electricity - 2 - - 1 1 1 ..
Main activity producer CHP - - - - 2 2 1 ..
Autoproducer CHP - - - - - - 5 ..
Main activity producer heat 7 - - - 1 1 2 ..
Autoproducer heat - - - - - - - ..
Petrochemical industry - - - - - - - ..
Other transformation - - - - - - - ..
Energy industry own use - 2 - - - 1 - ..
Refinery fuel - 2 - - - 1 - ..
Other energy industry - - - - - - - ..
Final consumption 2 367 2 815 2 713 3 341 7 759 7 755 7 433 ..
Transport
1 193 1 424 1 283 1 767 5 690 5 472 5 335 ..
Aviation - - - - - - - ..
Road 1 117 1 364 1 216 1 707 5 624 5 407 5 270 ..
Rail 56 60 59 54 54 54 54 ..
Domestic navigation 20 - 8 6 12 11 11 ..
Non-specified - - - - - - - ..
Industry
142 - 30 80 428 426 424 ..
Iron and steel 4 - - - - - - ..
Chemical (incl. pet.-chem.) 13 - - 1 1 1 1 ..
Non-ferrous metals - - - - 1 - - ..
Non-metallic minerals 50 - 1 - 7 8 7 ..
Transport equipment - - 2 - 1 1 1 ..
Machinery - - 1 - 10 7 8 ..
Mining and quarrying - - 2 2 7 6 6 ..
Food and tobacco - - 1 - 24 22 22 ..
Pulp, paper and printing - - - - 2 1 1 ..
Wood and wood products - - - - 7 2 2 ..
Construction - - 21 77 360 373 371 ..
Textiles and leather - - - - 3 2 2 ..
Non-specified 75 - 2 - 5 3 3 ..
Other
1 032 1 391 1 400 1 494 1 641 1 857 1 674 ..
Commerce and public - - 119 36 241 421 218 ..
Residential 1 032 1 391 962 1 216 1 163 1 200 1 220 ..
Agriculture (incl. fishing) - - 319 242 237 236 236 ..
Non-specified - - - - - - - ..
Memo: Non-energy use - - - - - - - ..
Chem/petchem. feedst. - - - - - - - ..
Other - - - - - - - ..
Closing stock level - 240 1 535 623 417 593 670 630
Source: Annual Oil Statistics.
INTERNATIONAL ENERGY AGENCY