IEA Statistics. Oil Information 2011
Подождите немного. Документ загружается.


III.308 - OIL INFORMATION (2011 Edition)
ISRAEL
Table 7A: Imports by country of origin
000 metric tons
2008 2009 2010e 2008 2009 2010e 2008 2009 2010e
Crude oil Natural gas liquids Feedstocks and other
Australia - - - - - - - - -
Bel
g
ium - - - - - - - - -
Canada - - - - - - - - -
Czech Re
p
ubli
c
- - - - - - - - -
Denmark - - - - - - - - -
Finland - - - - - - - - -
France - - - - - - - - -
German
y
- - - - - - - - -
Greece - - - - - - - - -
Hun
g
ar
y
- - - - - - - - -
Ireland - - - - - - - - -
Ital
y
- - - - - - - - -
Ja
p
an - - - - - - - - -
Korea - - - - - - - - -
Mexic
o
- - - - - - - - -
Netherlands - - - - - - - - -
New Zealand - - - - - - - - -
Norwa
y
- - - - - - - - -
Poland - - - - - - - - -
S
p
ain - - - - - - - - -
Sweden - - - - - - - - -
Turke
y
- - - - - - - - -
United Kin
g
dom - - - - - - - - -
United States - - - - - - - - -
Othe
r
- - - - - - - - -
OECD - - - - - - - - -
Ar
g
entina - - - - - - - - -
Brazil - - - - - - - - -
Colombia - - - - - - - - -
Ecuado
r
- - - - - - - - -
Netherlands Antilles - - - - - - - - -
Peru - - - - - - - - -
Trinidad and Toba
go
- - - - - - - - -
Venezuela - - - - - - - - -
Othe
r
- - - - - - - - -
Latin America - - - - - - - - -
Kazakhstan - - - - - - - - -
Russian Federation - - - - - - - - -
Other - - - - - - - - -
Non-OECD Europe/Eurasia
- - - - - - - - -
Iran - - - - - - - - -
Ira
q
- - - - - - - - -
Kuwai
t
- - - - - - - - -
Oman - - - - - - - - -
Qata
r
- - - - - - - - -
Saudi Arabia - - - - - - - - -
United Arab Emirates - - - - - - - - -
Othe
r
- - - - - - - - -
Middle East - - - - - - - - -
India - - - - - - - - -
Indonesi
a
- - - - - - - - -
Sin
g
a
p
ore - - - - - - - - -
Othe
r
- - - - - - - - -
Asia - - - - - - - - -
China - - - - - - - - -
Al
g
eria - - - - - - - - -
An
g
ola - - - - - - - - -
Cameroon - - - - - - - - -
E
gypt
- - - - - - - - -
Gabon - - - - - - - - -
Lib
y
an Arab Jamahiri
y
a - - - - - - - - -
Ni
g
eria - - - - - - - - -
Tunisia - - - - - - - - -
Othe
r
- - - - - - - - -
Africa - - - - - - - - -
Non-spec./other 11 964 11 220 10 965 - - - 832 780 780
Total imports 11 964 11 220 10 965 - - - 832 780 780
Memo: Total OPEC - - - - - - - - -
Source: Annual Oil Statistics.
INTERNATIONAL ENERGY AGENCY

OIL INFORMATION (2011 Edition) - III.309
ISRAEL
Table 7B: Imports by country of origin
000 metric tons
2008 2009 2010e 2008 2009 2010e 2008 2009 2010e
Total products Liquefied petroleum gases Naphtha
Australia - - - - - - - - -
Bel
g
ium - - - - - - - - -
Canada - - - - - - - - -
Czech Re
p
ubli
c
- - - - - - - - -
Denmark - - - - - - - - -
Finland - - - - - - - - -
France - - - - - - - - -
German
y
- - - - - - - - -
Greece - - - - - - - - -
Hun
g
ar
y
- - - - - - - - -
Ireland - - - - - - - - -
Ital
y
- - - - - - - - -
Ja
p
an - - - - - - - - -
Korea - - - - - - - - -
Mexic
o
- - - - - - - - -
Netherlands - - - - - - - - -
New Zealand - - - - - - - - -
Norwa
y
- - - - - - - - -
Poland - - - - - - - - -
S
p
ain - - - - - - - - -
Sweden - - - - - - - - -
Turke
y
- - - - - - - - -
United Kin
g
dom - - - - - - - - -
United States - - - - - - - - -
Othe
r
- - - - - - - - -
OECD - - - - - - - - -
Ar
g
entina - - - - - - - - -
Brazil - - - - - - - - -
Colombia - - - - - - - - -
Ecuado
r
- - - - - - - - -
Netherlands Antilles - - - - - - - - -
Peru - - - - - - - - -
Trinidad and Toba
go
- - - - - - - - -
Venezuela - - - - - - - - -
Othe
r
- - - - - - - - -
Latin America - - - - - - - - -
Kazakhstan - - - - - - - - -
Russian Federation - - - - - - - - -
Other - - - - - - - - -
Non-OECD Europe/Eurasia
- - - - - - - - -
Iran - - - - - - - - -
Ira
q
- - - - - - - - -
Kuwai
t
- - - - - - - - -
Oman - - - - - - - - -
Qata
r
- - - - - - - - -
Saudi Arabia - - - - - - - - -
United Arab Emirates - - - - - - - - -
Othe
r
- - - - - - - - -
Middle East - - - - - - - - -
India - - - - - - - - -
Indonesi
a
- - - - - - - - -
Sin
g
a
p
ore - - - - - - - - -
Othe
r
- - - - - - - - -
Asia - - - - - - - - -
China - - - - - - - - -
Al
g
eria - - - - - - - - -
An
g
ola - - - - - - - - -
Cameroon - - - - - - - - -
E
gypt
- - - - - - - - -
Gabon - - - - - - - - -
Lib
y
an Arab Jamahiri
y
a - - - - - - - - -
Ni
g
eria - - - - - - - - -
Tunisia - - - - - - - - -
Othe
r
- - - - - - - - -
Africa - - - - - - - - -
Non-spec./Other 2 162 2 162 2 162 158 158 158 183 183 183
Total imports 2 162 2 162 2 162 158 158 158 183 183 183
Memo: Total OPEC - - - - - - - - -
Source: Annual Oil Statistics.
INTERNATIONAL ENERGY AGENCY

III.310 - OIL INFORMATION (2011 Edition)
ISRAEL
Table 7C: Imports by country of origin
000 metric tons
2008 2009 2010e 2008 2009 2010e 2008 2009 2010e
Total gasoline Total kerosene Gas/diesel
Australia - - - - - - - - -
Bel
g
ium - - - - - - - - -
Canada - - - - - - - - -
Czech Re
p
ubli
c
- - - - - - - - -
Denmark - - - - - - - - -
Finland - - - - - - - - -
France - - - - - - - - -
German
y
- - - - - - - - -
Greece - - - - - - - - -
Hun
g
ar
y
- - - - - - - - -
Ireland - - - - - - - - -
Ital
y
- - - - - - - - -
Ja
p
an - - - - - - - - -
Korea - - - - - - - - -
Mexic
o
- - - - - - - - -
Netherlands - - - - - - - - -
New Zealand - - - - - - - - -
Norwa
y
- - - - - - - - -
Poland - - - - - - - - -
S
p
ain - - - - - - - - -
Sweden - - - - - - - - -
Turke
y
- - - - - - - - -
United Kin
g
dom - - - - - - - - -
United States - - - - - - - - -
Othe
r
- - - - - - - - -
OECD - - - - - - - - -
Ar
g
entina - - - - - - - - -
Brazil - - - - - - - - -
Colombia - - - - - - - - -
Ecuado
r
- - - - - - - - -
Netherlands Antilles - - - - - - - - -
Peru - - - - - - - - -
Trinidad and Toba
go
- - - - - - - - -
Venezuela - - - - - - - - -
Othe
r
- - - - - - - - -
Latin America - - - - - - - - -
Kazakhstan - - - - - - - - -
Russian Federation - - - - - - - - -
Other - - - - - - - - -
Non-OECD Europe/Eurasia
- - - - - - - - -
Iran - - - - - - - - -
Ira
q
- - - - - - - - -
Kuwai
t
- - - - - - - - -
Oman - - - - - - - - -
Qata
r
- - - - - - - - -
Saudi Arabia - - - - - - - - -
United Arab Emirates - - - - - - - - -
Othe
r
- - - - - - - - -
Middle East - - - - - - - - -
India - - - - - - - - -
Indonesi
a
- - - - - - - - -
Sin
g
a
p
ore - - - - - - - - -
Othe
r
- - - - - - - - -
Asia - - - - - - - - -
China - - - - - - - - -
Al
g
eria - - - - - - - - -
An
g
ola - - - - - - - - -
Cameroon - - - - - - - - -
E
gypt
- - - - - - - - -
Gabon - - - - - - - - -
Lib
y
an Arab Jamahiri
y
a - - - - - - - - -
Ni
g
eria - - - - - - - - -
Tunisia - - - - - - - - -
Othe
r
- - - - - - - - -
Africa - - - - - - - - -
Non-spec./other 600 600 600 202 202 202 510 510 510
Total imports 600 600 600 202 202 202 510 510 510
Memo: Total OPEC - - - - - - - - -
Source: Annual Oil Statistics.
INTERNATIONAL ENERGY AGENCY

OIL INFORMATION (2011 Edition) - III.311
ISRAEL
Table 7D: Imports by country of origin
000 metric tons
2008 2009 2010e 2008 2009 2010e 2008 2009 2010e
Fuel oil (residual) Petroleum coke Other products
Australia - - - - - - - - -
Bel
g
ium - - - - - - - - -
Canada - - - - - - - - -
Czech Re
p
ubli
c
- - - - - - - - -
Denmark - - - - - - - - -
Finland - - - - - - - - -
France - - - - - - - - -
German
y
- - - - - - - - -
Greece - - - - - - - - -
Hun
g
ar
y
- - - - - - - - -
Ireland - - - - - - - - -
Ital
y
- - - - - - - - -
Ja
p
an - - - - - - - - -
Korea - - - - - - - - -
Mexic
o
- - - - - - - - -
Netherlands - - - - - - - - -
New Zealand - - - - - - - - -
Norwa
y
- - - - - - - - -
Poland - - - - - - - - -
S
p
ain - - - - - - - - -
Sweden - - - - - - - - -
Turke
y
- - - - - - - - -
United Kin
g
dom - - - - - - - - -
United States - - - - - - - - -
Othe
r
- - - - - - - - -
OECD - - - - - - - - -
Ar
g
entina - - - - - - - - -
Brazil - - - - - - - - -
Colombia - - - - - - - - -
Ecuado
r
- - - - - - - - -
Netherlands Antilles - - - - - - - - -
Peru - - - - - - - - -
Trinidad and Toba
go
- - - - - - - - -
Venezuela - - - - - - - - -
Othe
r
- - - - - - - - -
Latin America - - - - - - - - -
Kazakhstan - - - - - - - - -
Russian Federation - - - - - - - - -
Other - - - - - - - - -
Non-OECD Europe/Eurasia
- - - - - - - - -
Iran - - - - - - - - -
Ira
q
- - - - - - - - -
Kuwai
t
- - - - - - - - -
Oman - - - - - - - - -
Qata
r
- - - - - - - - -
Saudi Arabia - - - - - - - - -
United Arab Emirates - - - - - - - - -
Othe
r
- - - - - - - - -
Middle East - - - - - - - - -
India - - - - - - - - -
Indonesi
a
- - - - - - - - -
Sin
g
a
p
ore - - - - - - - - -
Othe
r
- - - - - - - - -
Asia - - - - - - - - -
China - - - - - - - - -
Al
g
eria - - - - - - - - -
An
g
ola - - - - - - - - -
Cameroon - - - - - - - - -
E
gypt
- - - - - - - - -
Gabon - - - - - - - - -
Lib
y
an Arab Jamahiri
y
a - - - - - - - - -
Ni
g
eria - - - - - - - - -
Tunisia - - - - - - - - -
Othe
r
- - - - - - - - -
Africa - - - - - - - - -
Non-spec./other 509 509 509 - - - - - -
Total imports 509 509 509 - - - - - -
Memo: Total OPEC - - - - - - - - -
Source: Annual Oil Statistics.
INTERNATIONAL ENERGY AGENCY

III.312 - OIL INFORMATION (2011 Edition)
ISRAEL
Table 8A: Exports by country of destination
000 metric tons
2008 2009 2010e 2008 2009 2010e 2008 2009 2010e
Crude oil Natural gas liquids Feedstocks and other
Australia - - - - - - - - -
Austria - - - - - - - - -
Bel
g
ium - - - - - - - - -
Canada - - - - - - - - -
Denmark - - - - - - - - -
Finland - - - - - - - - -
France - - - - - - - - -
German
y
- - - - - - - - -
Greece - - - - - - - - -
Ireland - - - - - - - - -
Ital
y
- - - - - - - - -
Ja
p
an - - - - - - - - -
Luxembour
g
- - - - - - - - -
Mexic
o
- - - - - - - - -
Netherlands - - - - - - - - -
Norwa
y
- - - - - - - - -
Portu
g
al - - - - - - - - -
S
p
ain - - - - - - - - -
Sweden - - - - - - - - -
Switzerland - - - - - - - - -
Turke
y
- - - - - - - - -
United Kin
g
dom - - - - - - - - -
United States - - - - - - - - -
Other OECD - - - - - - - - -
OECD - - - - - - - - -
Africa - - - - - - - - -
Latin America - - - - - - - - -
Asia - - - - - - - - -
China - - - - - - - - -
Non-OECD Euro
p
e/Eurasi
a
- - - - - - - - -
Russian Federation - - - - - - - - -
Middle Eas
t
- - - - - - - - -
Non-s
p
ecified/Othe
r
- - - - - - - - -
Non-OECD - - - - - - - - -
Total exports - - - - - - - - -
Total products Liquefied petroleum gas Naphtha
Australia - - - - - - - - -
Austria - - - - - - - - -
Bel
g
ium - - - - - - - - -
Canada - - - - - - - - -
Denmark - - - - - - - - -
Finland - - - - - - - - -
France - - - - - - - - -
German
y
- - - - - - - - -
Greece - - - - - - - - -
Ireland - - - - - - - - -
Ital
y
- - - - - - - - -
Ja
p
an - - - - - - - - -
Luxembour
g
- - - - - - - - -
Mexic
o
- - - - - - - - -
Netherlands - - - - - - - - -
Norwa
y
- - - - - - - - -
Portu
g
al - - - - - - - - -
S
p
ain - - - - - - - - -
Sweden - - - - - - - - -
Switzerland - - - - - - - - -
Turke
y
- - - - - - - - -
United Kin
g
dom - - - - - - - - -
United States - - - - - - - - -
Other OECD - - - - - - - - -
OECD - - - - - - - - -
Africa - - - - - - - - -
Latin America - - - - - - - - -
Asia - - - - - - - - -
China - - - - - - - - -
Non-OECD Euro
p
e/Eurasi
a
- - - - - - - - -
Russian Federation - - - - - - - - -
Middle Eas
t
- - - - - - - - -
Non-s
p
ecified/othe
r
3 273 3 273 3 273 121 121 121 209 209 209
Non-OECD 3 273 3 273 3 273 121 121 121 209 209 209
Total exports 3 273 3 273 3 273 121 121 121 209 209 209
Source: Annual Oil Statistics.
INTERNATIONAL ENERGY AGENCY

OIL INFORMATION (2011 Edition) - III.313
ISRAEL
Table 8B: Exports by country of destination
000 metric tons
2008 2009 2010e 2008 2009 2010e 2008 2009 2010e
Total gasoline Total kerosene Gas/diesel oil
Australia - - - - - - - - -
Austria - - - - - - - - -
Bel
g
ium -- - --- - - -
Canada - - - - - - - - -
Denmark - - - - - - - - -
Finland - - - - - - - - -
France - - - - - - - - -
German
y
-- - --- - - -
Greece - - - - - - - - -
Ireland - - - - - - - - -
Ital
y
-- - --- - - -
Ja
p
an -- - --- - - -
Luxembour
g
-- - --- - - -
Mexic
o
-- - --- - - -
Netherlands - - - - - - - - -
Norwa
y
-- - --- - - -
Portu
g
al -- - --- - - -
S
p
ain -- - --- - - -
Sweden - - - - - - - - -
Switzerland - - - - - - - - -
Turke
y
-- - --- - - -
United Kin
g
dom -- - --- - - -
United States - - - - - - - - -
Other OECD - - - - - - - - -
OECD - - - - - - - - -
Africa - - - - - - - - -
Latin America - - - - - - - - -
Asia - - - - - - - - -
China - - - - - - - - -
Non-OECD Euro
p
e/Eurasi
a
-- - --- - - -
Russian Federation - - - - - - - - -
Middle Eas
t
-- - --- - - -
Non-s
p
ecified/Othe
r
771 771 771 420 420 420 860 860 860
Non-OECD 771 771 771 420 420 420 860 860 860
Total exports 771 771 771 420 420 420 860 860 860
Fuel oil (residual) Petroleum coke Other products
Australia - - - - - - - - -
Austria - - - - - - - - -
Bel
g
ium -- - --- - - -
Canada - - - - - - - - -
Denmark - - - - - - - - -
Finland - - - - - - - - -
France - - - - - - - - -
German
y
-- - --- - - -
Greece - - - - - - - - -
Ireland - - - - - - - - -
Ital
y
-- - --- - - -
Ja
p
an -- - --- - - -
Luxembour
g
-- - --- - - -
Mexic
o
-- - --- - - -
Netherlands - - - - - - - - -
Norwa
y
-- - --- - - -
Portu
g
al -- - --- - - -
S
p
ain -- - --- - - -
Sweden - - - - - - - - -
Switzerland - - - - - - - - -
Turke
y
-- - --- - - -
United Kin
g
dom -- - --- - - -
United States - - - - - - - - -
Other OECD - - - - - - - - -
OECD - - - - - - - - -
Africa - - - - - - - - -
Latin America - - - - - - - - -
Asia - - - - - - - - -
China - - - - - - - - -
Non-OECD Euro
p
e/Eurasi
a
-- - --- - - -
Russian Federation - - - - - - - - -
Middle Eas
t
-- - --- - - -
Non-s
p
ecified/othe
r
892 892 892 - - - - - -
Non-OECD 892 892 892 - - - - - -
Total exports 892 892 892 - - - - - -
Source: Annual Oil Statistics.
INTERNATIONAL ENERGY AGENCY
III.314 - OIL INFORMATION (2011 Edition)
ITAL
Y
* Excluding electricity trade.
** Includes hydro, geothermal, solar, wind, combustible renewables and waste, etc.
Source: Annual Energy Balances.
0
10
20
30
40
50
60
70
80
Coal Oil Gas Nuclear Other **
Percentage
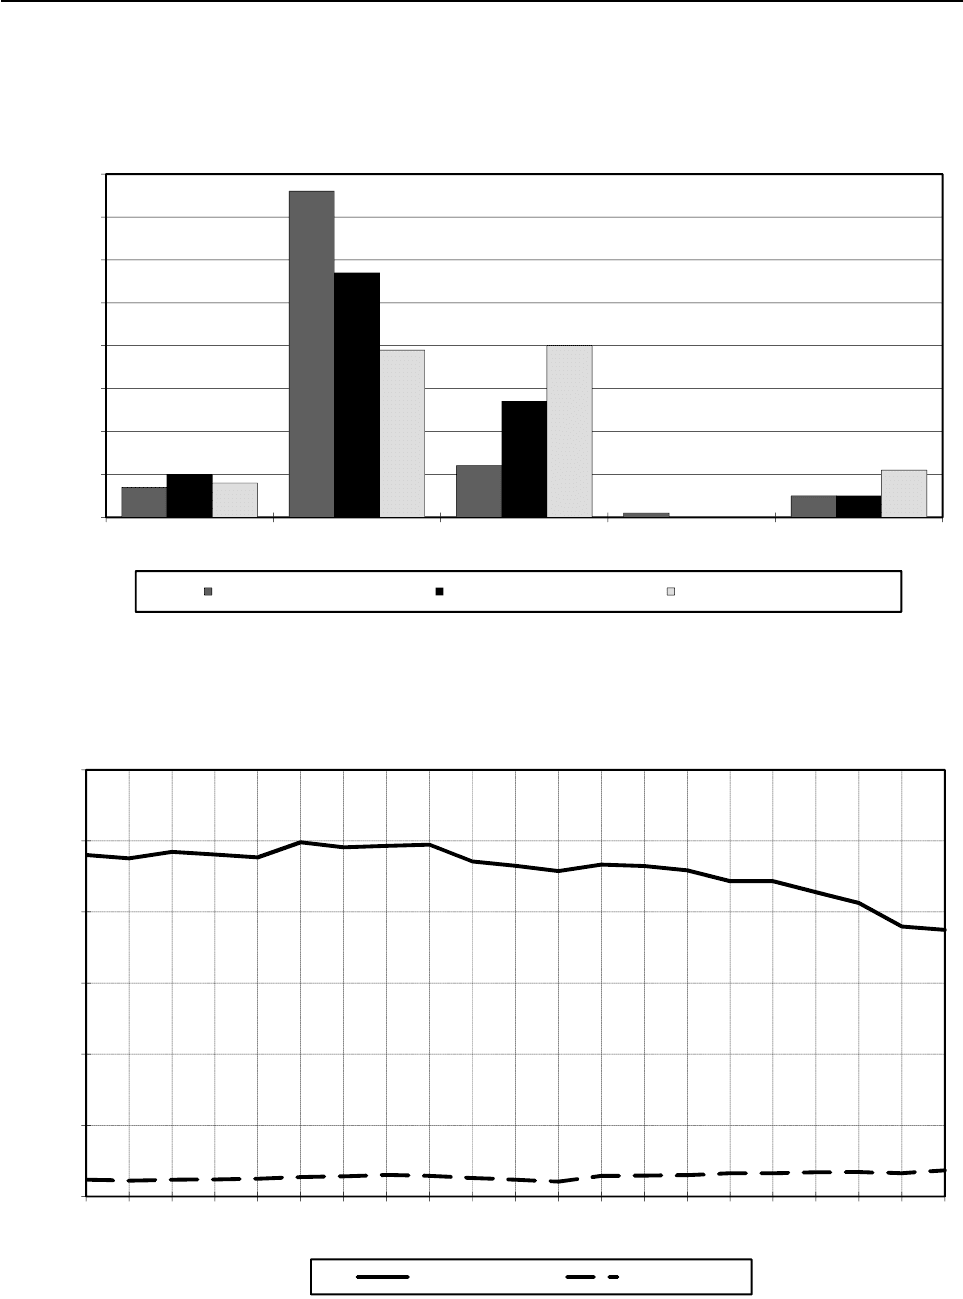
Figure 1. Fuel shares of TPES *
1973 TPES = 119 Mtoe 1990 TPES = 147 Mtoe 2010e TPES = 170 Mtoe
120
Figure 2. Oil production and consumption
*** Includes refinery fuel and international marine bunkers.
Source: Annual Oil Statistics.
0
20
40
60
80
100
120
1990
1991
1992
1993
1994
1995
1996
1997
1998
1999
2000
2001
2002
2003
2004
2005
2006
2007
2008
2009
2010e
Million Metric Tons
Fi
gure
2
.
Oil
pro
d
uc
ti
on an
d
consump
ti
on
Consumption *** Production
INTERNATIONAL ENERGY AGENCY

OIL INFORMATION (2011 Edition) - III.315
ITALY
Table 1: Oil supply and consumption - summary table
000 metric tons
1973 1978 1980 1990 2007 2008 2009 2010e
Indigenous production
1
1 105 1 489 1 825 4 723 6 811 6 880 6 535 7 340
Crude oil - 1 422 1 800 4 641 5 860 5 220 4 551 5 134
NGL - 67 25 27 - - - -
Othe
r
- - - 55 951 1 660 1 984 2 206
+ Net imports 105 030 96 147 98 051 90 361 77 116 73 103 67 886 67 418
Crude oil, NGL, othe
r
128 944 111 490 94 322 83 713 94 006 87 629 80 337 83 927
Oil products -23 914 -15 343 3 729 6 648 -16 890 -14 526 -12 451 -16 509
- Intl. marine bunkers 7 353 5 663 4 283 2 743 2 507 2 628 2 445 2 503
+ Stock changes - 770 1 645 - 620 -2 180 - 579 669 803 - 286
TOTAL SUPPLY 98 012 93 618 94 973 90 161 80 841 78 024 72 779 71 969
Refinery intake 132 723 116 227 99 247 90 955 102 245 95 971 87 952 92 354
Refinery output 130 307 113 861 97 992 90 564 100 714 95 247 87 327 91 249
LPG + ethane 2 329 2 525 2 084 2 131 2 349 2 257 2 113 2 172
Naphtha 11 192 5 958 4 184 4 129 2 545 3 016 2 725 3 717
Kerosenes 6 907 5 058 4 263 5 161 4 224 3 561 3 312 3 441
Gasolines 15 096 16 062 15 050 18 536 21 432 20 069 18 921 19 154
Gas/diesel oil 28 975 29 599 26 815 29 133 41 079 40 031 36 726 38 816
Fuel oil 60 238 49 317 39 468 23 653 15 220 12 763 11 236 9 432
Other products 5 570 5 342 6 128 7 821 13 865 13 550 12 294 14 517
- Refinery losse
s
2 416 2 366 1 255 391 1 531 724 625 1 105
+ Returns 3 506 2 445 2 632 3 728 1 742 1 534 1 572 1 808
- Statistical differences 100 - 150 - 89 204 -2 023 -1 072 241 215
TOTAL CONSUMPTION 99 002 93 847 96 439 93 294 83 075 79 906 73 485 72 457
Transformation and energy 28 030 29 533 31 255 31 122 17 844 16 174 14 143 ..
Crude oil 15 30 300 205 - - - ..
LPG + ethane 70 146 193 117 48 61 77 ..
Gas/diesel oil 445 630 613 775 359 310 325 ..
Fuel oil 21 834 24 683 25 856 23 866 7 375 6 228 5 416 ..
Petroleum coke 417 296 368 920 1 606 1 391 1 309 ..
Othe
r
5 249 3 748 3 925 5 239 8 456 8 184 7 016 ..
Transport 18 824 21 704 24 217 32 579 43 572 41 712 39 872 ..
Motor gasolin
e
11 036 10 730 11 780 13 073 11 822 10 973 10 534 ..
Gas/diesel oil 5 133 7 948 9 405 15 819 25 565 24 790 23 802 ..
Subtotal 16 169 18 678 21 185 28 892 37 387 35 763 34 336 ..
Aviation fuels 1 896 1 817 1 842 1 834 4 116 3 967 3 589 ..
Othe
r
759 1 209 1 190 1 853 2 069 1 982 1 947 ..
Industry 30 092 22 678 22 940 17 148 14 405 14 827 12 588 ..
Naphtha 6 008 3 593 3 068 3 522 2 921 2 990 2 933 ..
LPG + ethane 379 474 474 298 374 283 279 ..
Gas/diesel oil 612 1 388 1 133 1 135 1 094 1 328 1 167 ..
Fuel oil 19 314 13 545 13 697 4 607 2 366 2 569 1 856 ..
Othe
r
3 779 3 678 4 568 7 586 7 650 7 657 6 353 ..
Other 22 056 19 932 18 027 12 445 7 254 7 193 6 882 ..
Gas/diesel oil 12 455 13 825 13 168 9 630 5 199 5 084 4 798 ..
Fuel oil 6 200 3 950 2 810 550 88 90 88 ..
Othe
r
3 401 2 157 2 049 2 265 1 967 2 019 1 996 ..
Memo: Non-energy use 11 564 8 839 9 260 12 408 9 577 9 390 9 412 ..
Chem/petchem. feedst. 4 970 3 312 3 183 4 760 4 475 4 925 4 473 ..
Other 6 594 5 527 6 077 7 648 5 102 4 465 4 939 ..
1. Includes inputs from other sources.
Source: Annual Oil Statistics.
INTERNATIONAL ENERGY AGENCY

III.316 - OIL INFORMATION (2011 Edition)
ITALY
Table 2: Supply of crude oil, NGL, feedstocks and other hydrocarbons
000 metric tons
1973 1978 1980 1990 2007 2008 2009 2010e
CRUDE OIL
Indigenous productio
n
- 1 422 1 800 4 641 5 860 5 220 4 551 5 134
+ Imports - 108 699 89 058 74 725 88 158 82 432 76 297 78 490
- Exports - - - 859 1 213 978 375 312
- Direct use - 30 300 205 - - - -
+ Stock change - 1 192 817 - 911 - 35 270 - 125 - 398
- Statistical differences - - - - 68 - - - - 602
Refinery intake - 111 283 91 375 77 459 92 770 86 944 80 348 83 516
Closing stock level - 5 259 4 834 5 500 4 966 4 696 4 821 5 219
NATURAL GAS LIQUIDS
Indigenous productio
n
- 67 25 27 - - - -
+ Imports - - ---- - -
- Exports - - ---- - -
- Direct use - - ---- - -
+ Stock change - - ---- - -
- Statistical differences - - - - - - - -
Refinery intake - 67 25 27 - - - -
Closing stock level - - - - - - - -
REFINERY FEEDSTOCKS
Backflows - 2 329 2 522 3 678 1 624 1 418 1 572 1 788
+ Transfers - - ---- - -
+ Imports - 2 791 5 264 11 553 7 560 7 064 6 078 6 853
- Exports - - - 1 706 804 1 167 1 925 1 348
+ Stock change - - 243 61 - 111 59 68 - 50 - 145
- Statistical differences - - - - 10 105 - 115 233
Refinery intake - 4 877 7 847 13 414 8 429 7 278 5 790 6 915
Closing stock level - 243 422 542 1 460 1 392 1 442 1 587
OTHER HYDROCARBONS
Indigenous productio
n
- - - 55 951 1 660 1 984 2 206
+ Imports - - - - 305 278 262 244
- Exports - - ---- - -
- Direct use - - - - 202 300 449 540
+ Stock change - - - - - 8 111 17 13
- Statistical differences - - - - - - - -
Refinery intake - - - 55 1 046 1 749 1 814 1 923
Closing stock level - - - 39 159 48 31 18
CRUDE OIL, NGL, FEEDSTOCKS AND OTHER
Indigenous productio
n
1 105 1 489 1 825 4 723 6 811 6 880 6 535 7 340
+ Backflows 3 313 2 329 2 522 3 678 1 624 1 418 1 572 1 788
+ Transfers - - ---- - -
+ Imports 128 944 111 490 94 322 86 278 96 023 89 774 82 637 85 587
- Exports - - - 2 565 2 017 2 145 2 300 1 660
- Direct use 15 30 300 205 202 300 449 540
+ Stock change - 638 949 878 -1 022 16 449 - 158 - 530
- Statistical differences - 14 - - - 68 10 105 - 115 - 369
Refinery intake 132 723 116 227 99 247 90 955 102 245 95 971 87 952 92 354
Closing stock level 5 974 5 502 5 256 6 081 6 585 6 136 6 294 6 824
Source: Annual Oil Statistics.
INTERNATIONAL ENERGY AGENCY

OIL INFORMATION (2011 Edition) - III.317
ITALY
Table 3: Motor gasoline - supply
000 metric tons
1973 1978 1980 1990 2007 2008 2009 2010e
MOTOR GASOLINE
Refinery output 14 810 15 593 14 284 18 488 21 417 20 060 18 904 19 137
+ Imports - 281 229 628 258 157 181 132
- Exports 3 367 5 083 2 806 4 468 9 444 9 161 7 727 8 918
+ Transfers - 56 691 - 249 - - - -
+ Stock change - 271 - 146 - 292 114 110 175 - 161 117
- Statistical differences - 85 - 307 - 380 - - 138 320 - 9
Total consumption 11 257 11 008 12 106 14 133 12 341 11 369 10 877 10 477
Closing stock level - 2 007 2 109 2 049 1 895 1 720 1 881 1 764
Table 4: Aviation fuels - supply
000 metric tons
1973 1978 1980 1990 2007 2008 2009 2010e
AVIATION GASOLINE
Refinery output 86 34 192 48 15 9 17 17
+ Imports - - ---- - -
- Exports 60 19 180 37 - - - -
+ Transfers - - ---- - -
+ Stock change - 4 - ---- - -
- Statistical differences - - - - - - - -
Total consumption 22 15 12 11 15 9 17 17
Closing stock level - - - - - - - -
GASOLINE TYPE JET FUEL
Refinery output 200 435 574 - - - - -
+ Imports - - ---- - -
- Exports - 258 350 - - - - -
+ Transfers - - 30 - - - - -
+ Stock change - - 5 ---- - -
- Statistical differences - - - - - - - -
Total consumption 200 172 254 - - - - -
Closing stock level - 29 29 - - - - -
KEROSENE TYPE JET FUEL
Refinery output 2 171 2 028 1 840 2 703 4 034 3 219 3 050 3 175
+ Imports - - - 53 479 730 788 892
- Exports 1 520 383 229 721 367 144 188 134
+ Transfers 1 044 - 5 - 249 - - - -
+ Stock change - 20 - - 23 85 - 103 42 - 37
- Statistical differences - 5 - 249 - - 367 - 19
Total consumption 1 695 1 655 1 611 2 012 4 231 4 069 3 692 3 877
Closing stock level - 195 195 214 326 429 387 424
Source: Annual Oil Statistics.
INTERNATIONAL ENERGY AGENCY