IEA Statistics. Oil Information 2011
Подождите немного. Документ загружается.


III.518 - OIL INFORMATION (2011 Edition)
SWEDEN
Table 7D: Imports by country of origin
000 metric tons
2008 2009 2010e 2008 2009 2010e 2008 2009 2010e
Fuel oil (residual) Petroleum coke Other products
Australia - - - - - - - - -
Bel
g
ium 15 - 2 - - - 40 24 21
Canada - - - - - - - - -
Czech Re
p
ubli
c
- - - - - - - - -
Denmark 363 465 404 - - - 1 - -
Finland - - - - - - 28 62 73
France - - 55 - - - 11 1 -
German
y
19 63 28 - - - 5 1 -
Greece - - 7 - - - - - -
Hun
g
ar
y
- - - - - - - - -
Ireland - 3 - - - - - - -
Ital
y
- - - - - - 1 1 -
Ja
p
an - - - - - - - - -
Korea - - - - - - - - -
Mexic
o
- - - - - - - - -
Netherlands 12 20 14 - - - 20 19 14
New Zealand - - - - - - - - -
Norwa
y
8 5 - - - - - 3 2
Poland - - - - - - 2 2 5
S
p
ain - - - - - - - - -
Sweden - - - - - - - - -
Turke
y
- - - - - - - - -
United Kin
g
dom 268 168 312 - - - - 12 20
United States - - - 51 - - - - -
Othe
r
20 - 14 - - - - - -
OECD 705 724 836 51 - - 108 125 135
Ar
g
entina - - - - - - - - -
Brazil - - - - - - - - -
Colombia - - - - - - - - -
Ecuado
r
- - - - - - - - -
Netherlands Antilles - - - - - - - - -
Peru - - - - - - - - -
Trinidad and Toba
go
- - - - - - - - -
Venezuela - - - - - - - 8 -
Othe
r
- - - - - - - - -
Latin America - - - - - - - 8 -
Kazakhstan 74 9 - - - - - - -
Russian Federation 6 216 2 - - - - - -
Other 229 178 117 - - - 31 - -
Non-OECD Europe/Eurasia
309 403 119 - - - 31 - -
Iran - - - - - - - - -
Ira
q
- - - - - - - - -
Kuwai
t
- - - - - - - - -
Oman - - - - - - - - -
Qata
r
- - - - - - - - -
Saudi Arabia - - - - - - - - -
United Arab Emirates - - - - - - - - -
Othe
r
- - - - - - - - -
Middle East - - - - - - - - -
India - - - - - - - - -
Indonesi
a
- - - - - - - - -
Sin
g
a
p
ore - - - - - - - - -
Othe
r
- - - - - - - - -
Asia - - - - - - - - -
China - - - - - - - - -
Al
g
eria - 43 2 - - - - - -
An
g
ola - - - - - - - - -
Cameroon - - - - - - - - -
E
gypt
- - - - - - - - -
Gabon - - - - - - - - -
Lib
y
an Arab Jamahiri
y
a 41 70 88 - - - - - -
Ni
g
eria - - - - - - - - -
Tunisia - - - - - - - - -
Othe
r
- - 5 - - - - - -
Africa 41 113 95 - - - - - -
Non-spec./other 7 - 28 - - 11 6 25 16
Total imports 1 062 1 240 1 078 51 - 11 145 158 151
Memo: Total OPEC 41 113 90 - - - - 8 -
Source: Annual Oil Statistics.
INTERNATIONAL ENERGY AGENCY

OIL INFORMATION (2011 Edition) - III.519
SWEDEN
Table 8A: Exports by country of destination
000 metric tons
2008 2009 2010e 2008 2009 2010e 2008 2009 2010e
Crude oil Natural gas liquids Feedstocks and other
Australia - - - - - - - - -
Austria - - - - - - - - -
Bel
g
ium - - - - - - - 5 58
Canada - - - - - - 11 - 4
Denmark - - - - - - - 3 7
Finland - - - - - - - 18 18
France - - - - - - 5 - -
German
y
- - - - - - 17 14 99
Greece - - - - - - - - -
Ireland - - - - - - - - -
Ital
y
- - - - - - - - -
Ja
p
an - - - - - - - - -
Luxembour
g
- - - - - - - - -
Mexic
o
- - - - - - - - -
Netherlands - - - - - - 200 184 474
Norwa
y
- - - - - - - - -
Portu
g
al - - - - - - - - 2
S
p
ain - - - - - - - - 6
Sweden - - - - - - - - -
Switzerland - - - - - - - - -
Turke
y
- - - - - - - - -
United Kin
g
dom - - - - - - 128 97 60
United States - - - - - - 22 - 51
Other OECD - - - - - - 28 18 -
OECD - - - - - - 411 339 779
Africa - - - - - - 12 13 22
Latin America - - - - - - - - -
Asia - - - - - - - - -
China - - - - - - - - -
Non-OECD Euro
p
e/Eurasi
a
-- ---- - 6 -
Russian Federation - - - - - - - - -
Middle Eas
t
- - - - - - 18 - 1
Non-s
p
ecified/Othe
r
- - - - - - - - -
Non-OECD - - - - - - 30 19 23
Total exports - - - - - - 441 358 802
Total products Liquefied petroleum gas Naphtha
Australia - - - - - - - - -
Austria - - - - - - - - -
Bel
g
ium 178 343 451 9 21 124 - - -
Canada 95 35 68 - - - - - -
Denmark 1 862 1 643 1 548 3 2 1 - - -
Finland 186 235 303 - - 7 - - -
France 552 483 572 49 63 10 - - -
German
y
543 455 434 22 50 4 - - -
Greece - 33 - - - - - - -
Ireland 69 276 275 - 1 1 - - -
Ital
y
61 25 - - - - - - -
Ja
p
an - - - - - - - - -
Luxembour
g
- - - - - - - - -
Mexic
o
74 213 73 - - - - - -
Netherlands 532 883 956 30 60 54 - 251 225
Norwa
y
1 796 2 130 2 022 130 143 180 - - -
Portu
g
al 15 32 8 2 - 2 - - -
S
p
ain 21 243 248 - - - - - -
Sweden - - - - - - - - -
Switzerland 6 5 2 - - 2 - - -
Turke
y
- 91 - - - - - - -
United Kin
g
dom 3 605 2 498 2 770 5 10 11 263 24 5
United States 871 665 723 44 - 4 - - -
Other OECD 781 636 192 82 29 10 - - -
OECD 11 247 10 92
4
10 645 376 379 410 263 275 230
Africa 136 170 292 - - 13 - - -
Latin America - - 97 - - 2 - - -
Asia - - 91 - - - - - -
China - - - - - - - - -
Non-OECD Euro
p
e/Eurasi
a
310 264 645 2 20 - - - -
Russian Federation 4 22 13 - - - - - -
Middle Eas
t
78 111 - - - - - - -
Non-s
p
ecified/othe
r
39 67 72 - 5 5 - - -
Non-OECD 567 634 1 210 2 25 20 - - -
Total exports 11 814 11 558 11 855 378 404 430 263 275 230
Source: Annual Oil Statistics.
INTERNATIONAL ENERGY AGENCY

III.520 - OIL INFORMATION (2011 Edition)
SWEDEN
Table 8B: Exports by country of destination
000 metric tons
2008 2009 2010e 2008 2009 2010e 2008 2009 2010e
Total gasoline Total kerosene Gas/diesel oil
Australia - - - - - - - - -
Austria - - - - - - - - -
Bel
g
ium 12 - - - - - 67 31 -
Canada 95 35 11 - - - - - -
Denmark 473 467 396 15 17 12 821 743 855
Finland - 8 - - - 1 20 - -
France 1 2 - - - - 394 377 491
German
y
5 5 13 - - - 454 345 309
Greece - - - - - - - - -
Ireland - - - - - - 69 275 274
Ital
y
- 1 - - - - - - -
Ja
p
an -- - --- - - -
Luxembour
g
-- - --- - - -
Mexic
o
74 213 73 - - - - - -
Netherlands 204 229 84 - - - 198 183 153
Norwa
y
333 236 100 34 3 21 448 652 511
Portu
g
al - - 6 - - - 13 18 -
S
p
ain - 9 - - - - 21 107 83
Sweden - - - - - - - - -
Switzerland 3 3 - - - - - - -
Turke
y
-- - --- - 76 -
United Kin
g
dom 490 399 470 - 4 - 2 075 1 702 1 840
United States 630 605 490 - - - 16 - -
Other OECD 165 61 12 - - - 419 404 49
OECD 2 485 2 273 1 655 49 24 34 5 015 4 913 4 565
Africa 136 136 279 - - - - - -
Latin America - - - - - - - - -
Asia - - - - - - - - -
China - - - - - - - - -
Non-OECD Euro
p
e/Eurasi
a
7 39 156 - - - 13 11 6
Russian Federation 4 4 - - - - - 18 13
Middle Eas
t
78 111 - - - - - - -
Non-s
p
ecified/Othe
r
-- 43 --6 - - 6
Non-OECD 225 290 478 - - 6 13 29 25
Total exports 2 710 2 563 2 133 49 24 40 5 028 4 942 4 590
Fuel oil (residual) Petroleum coke Other products
Australia - - - - - - - - -
Austria - - - - - - - - -
Bel
g
ium 79 - - - - - 11 291 327
Canada - - 57 - - - - - -
Denmark 474 277 163 - - - 76 137 121
Finland 166 227 293 - - - - - 2
France 108 41 71 - - - - - -
German
y
61 54 108 - - - 1 1 -
Greece - 33 - - - - - - -
Ireland - - - - - - - - -
Ital
y
61 24 - - - - - - -
Ja
p
an -- - --- - - -
Luxembour
g
-- - --- - - -
Mexic
o
-- - --- - - -
Netherlands 100 159 433 - - - - 1 7
Norwa
y
704 890 1 028 - - - 147 206 182
Portu
g
al - 14 - - - - - - -
S
p
ain - 127 165 - - - - - -
Sweden - - - - - - - - -
Switzerland - - - - - - 3 2 -
Turke
y
- 15 - - - - - - -
United Kin
g
dom 763 347 396 - - - 9 12 48
United States 181 60 229 - - - - - -
Other OECD 3 5 - - - - 112 137 121
OECD 2 700 2 273 2 943 - - - 359 787 808
Africa - 34 - - - - - - -
Latin America - - 95 - - - - - -
Asia - - 91 - - - - - -
China - - - - - - - - -
Non-OECD Euro
p
e/Eurasi
a
268 194 483 - - - 20 - -
Russian Federation - - - - - - - - -
Middle Eas
t
-- - --- - - -
Non-s
p
ecified/othe
r
23 37 1 - - - 16 25 11
Non-OECD 291 265 670 - - - 36 25 11
Total exports 2 991 2 538 3 613 - - - 395 812 819
Source: Annual Oil Statistics.
INTERNATIONAL ENERGY AGENCY
OIL INFORMATION (2011 Edition) - III.521
SWITZERLAND
* Excluding electricity trade.
** Includes hydro, geothermal, solar, wind, combustible renewables and waste, etc.
Source: Annual Energy Balances.
0
10
20
30
40
50
60
70
80
Coal Oil Gas Nuclear Other **
Percentage
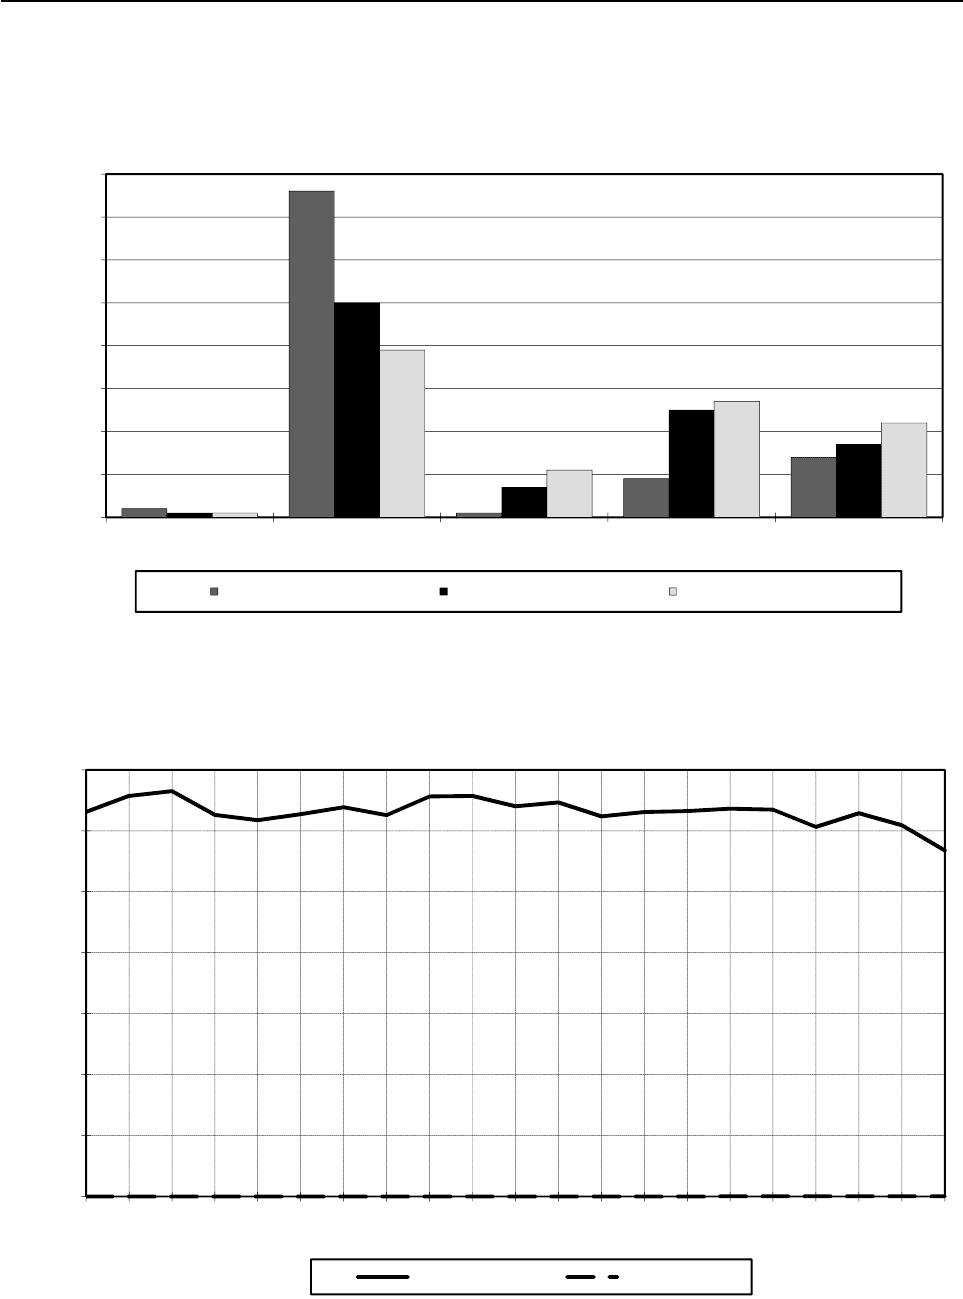
Figure 1. Fuel shares of TPES *
1973 TPES = 19 Mtoe 1990 TPES = 24 Mtoe 2010e TPES = 26 Mtoe
14
Figure 2. Oil production and consumption
*** Includes refinery fuel and international marine bunkers.
Source: Annual Oil Statistics.
0
2
4
6
8
10
12
14
1990
1991
1992
1993
1994
1995
1996
1997
1998
1999
2000
2001
2002
2003
2004
2005
2006
2007
2008
2009
2010e
Million Metric Tons
Fi
gure
2
.
Oil
pro
d
uc
ti
on an
d
consump
ti
on
Consumption *** Production
INTERNATIONAL ENERGY AGENCY

III.522 - OIL INFORMATION (2011 Edition)
SWITZERLAND
Table 1: Oil supply and consumption - summary table
000 metric tons
1973 1978 1980 1990 2007 2008 2009 2010e
Indigenous production
1
- - - - 14 14 9 13
Crude oil - - ---- - -
NGL - - ---- - -
Othe
r
- - - - 14 14 9 13
+ Net imports 14 664 13 666 13 109 12 845 11 137 12 214 12 607 11 446
Crude oil, NGL, othe
r
6 180 4 246 4 604 3 128 4 722 5 133 4 828 4 543
Oil products 8 484 9 420 8 505 9 717 6 415 7 081 7 779 6 903
- Intl. marine bunkers - - - 18 9 10 8 10
+ Stock changes 104 - 188 - 204 100 299 - 64 - 83 14
TOTAL SUPPLY 14 768 13 478 12 905 12 927 11 441 12 154 12 525 11 463
Refinery intake 6 181 4 277 4 590 3 071 4 765 5 113 4 861 4 549
Refinery output 6 126 4 236 4 550 3 047 4 740 5 095 4 816 4 518
LPG + ethane 68 86 94 139 202 239 204 170
Naphtha 131 22 20 13 7 22 - -
Kerosenes 128 207 227 233 183 190 96 65
Gasolines 924 886 1 096 752 1 280 1 370 1 427 1 321
Gas/diesel oil 2 376 1 815 2 018 1 167 2 172 2 326 2 381 2 269
Fuel oil 2 125 921 802 504 587 596 383 375
Other products 374 299 293 239 309 352 325 318
- Refinery losse
s
55 41 40 24 25 18 45 31
+ Returns - - ---- - -
- Statistical differences - 15 - - 316 - 697 - 426 312 91
TOTAL CONSUMPTION 14 728 13 437 12 865 12 587 12 113 12 562 12 168 11 341
Transformation and energy 810 552 339 266 337 360 341 ..
Crude oil - - ---- - ..
LPG + ethane 32 10 11 7 3 2 1 ..
Gas/diesel oil 19 20 2 43 28 19 19 ..
Fuel oil 489 351 157 121 35 21 21 ..
Petroleum coke - - - - 49 77 64 ..
Othe
r
270 171 169 95 222 241 236 ..
Transport 3 930 3 892 4 075 5 750 6 800 7 018 6 897 ..
Motor gasolin
e
2 462 2 573 2 709 3 701 3 453 3 377 3 284 ..
Gas/diesel oil 756 511 556 879 1 988 2 192 2 221 ..
Subtotal 3 218 3 084 3 265 4 580 5 441 5 569 5 505 ..
Aviation fuels 658 765 767 1 120 1 326 1 418 1 360 ..
Othe
r
54 43 43 50 33 31 32 ..
Industry 3 707 2 897 2 771 1 299 1 329 1 301 1 198 ..
Naphtha 104 81 79 43 13 15 9 ..
LPG + ethane 33 36 45 73 90 95 82 ..
Gas/diesel oil 1 075 1 250 1 120 310 659 655 629 ..
Fuel oil 1 887 1 046 964 403 91 95 66 ..
Othe
r
608 484 563 470 476 441 412 ..
Other 6 281 6 096 5 680 5 272 3 647 3 883 3 732 ..
Gas/diesel oil 5 951 5 793 5 460 5 164 3 558 3 777 3 631 ..
Fuel oil 265 240 150 - - - - ..
Othe
r
65 63 70 108 89 106 101 ..
Memo: Non-energy use 781 623 644 577 603 575 528 ..
Chem/petchem. feedst. 149 122 135 127 107 116 93 ..
Other 632 501 509 450 496 459 435 ..
1. Includes inputs from other sources.
Source: Annual Oil Statistics.
INTERNATIONAL ENERGY AGENCY

OIL INFORMATION (2011 Edition) - III.523
SWITZERLAND
Table 2: Supply of crude oil, NGL, feedstocks and other hydrocarbons
000 metric tons
1973 1978 1980 1990 2007 2008 2009 2010e
CRUDE OIL
Indigenous productio
n
- - ---- - -
+ Imports - 3 873 3 832 3 055 4 633 5 044 4 711 4 489
- Exports - - ---- - -
- Direct use - - ---- - -
+ Stock change - 33 - 18 - 56 41 - 23 34 -
- Statistical differences - - - - - - - 3 -
Refinery intake - 3 906 3 814 2 999 4 674 5 021 4 748 4 489
Closing stock level - 89 109 92 59 82 48 48
NATURAL GAS LIQUIDS
Indigenous productio
n
- - ---- - -
+ Imports - - ---- - -
- Exports - - ---- - -
- Direct use - - ---- - -
+ Stock change - - ---- - -
- Statistical differences - - - - - - - -
Refinery intake - - - - - - - -
Closing stock level - - - - - - - -
REFINERY FEEDSTOCKS
Backflows - - ---- - -
+ Transfers - - ---- - -
+ Imports - 373 772 - - - 53 3
- Exports - - ---- - -
+ Stock change - - 2 4 5 - - - 1 1
- Statistical differences - - - - - - - - 2
Refinery intake - 371 776 5 - - 52 6
Closing stock level - 18 25 - - - 1 -
OTHER HYDROCARBONS
Indigenous productio
n
- - - - 14 14 9 13
+ Imports - - - 73 89 89 64 51
- Exports - - ---- - -
- Direct use - - - - 14 14 9 12
+ Stock change - - - - 6 4 2 - 4 - 1
- Statistical differences - - - - 2 - 1 - 1 - 3
Refinery intake - - - 67 91 92 61 54
Closing stock level - - - 8 5 3 7 8
CRUDE OIL, NGL, FEEDSTOCKS AND OTHER
Indigenous productio
n
- - - - 14 14 9 13
+ Backflows - - ---- - -
+ Transfers - - ---- - -
+ Imports 6 180 4 246 4 604 3 128 4 722 5 133 4 828 4 543
- Exports - - ---- - -
- Direct use - - - - 14 14 9 12
+ Stock change 1 31 - 14 - 57 45 - 21 29 -
- Statistical differences - - - - 2 - 1 - 4 - 5
Refinery intake 6 181 4 277 4 590 3 071 4 765 5 113 4 861 4 549
Closing stock level 125 107 134 100 64 85 56 56
Source: Annual Oil Statistics.
INTERNATIONAL ENERGY AGENCY

III.524 - OIL INFORMATION (2011 Edition)
SWITZERLAND
Table 3: Motor gasoline - supply
000 metric tons
1973 1978 1980 1990 2007 2008 2009 2010e
MOTOR GASOLINE
Refinery output 924 886 1 096 752 1 280 1 370 1 427 1 321
+ Imports 1 598 1 759 1 676 2 985 2 135 1 947 1 873 1 852
- Exports 1 6 11 - - - - -
+ Transfers - - - 18 3 3 2 2
+ Stock change - 11 - 31 - 17 - 31 37 53 13 - 10
- Statistical differences - - - - 2 - 4 31 - 3
Total consumption 2 510 2 608 2 744 3 724 3 453 3 377 3 284 3 168
Closing stock level - 916 966 953 1 456 1 403 1 390 1 400
Table 4: Aviation fuels - supply
000 metric tons
1973 1978 1980 1990 2007 2008 2009 2010e
AVIATION GASOLINE
Refinery output - - - - - - - -
+ Imports 5 8 8 6 4 4 3 5
- Exports - - ---- - -
+ Transfers - - ---- - -
+ Stock change 1 - - 1 - 1 - - 1 - 2
- Statistical differences - - - - - 1 - - 1
Total consumption 6 8 7 5 5 4 4 2
Closing stock level - 1 2 2 1 1 - 2
GASOLINE TYPE JET FUEL
Refinery output - - - - - - - -
+ Imports - - ---- - -
- Exports - - ---- - -
+ Transfers - - ---- - -
+ Stock change - - ---- - -
- Statistical differences - - - - - - - -
Total consumption - - - - - - - -
Closing stock level - - - - - - - -
KEROSENE TYPE JET FUEL
Refinery output 124 202 222 231 183 190 96 65
+ Imports 525 535 562 891 1 144 1 256 1 298 1 352
- Exports - - ---- - -
+ Transfers - - ---- - -
+ Stock change 3 20 - 24 - 7 - 6 - 32 - 28 -
- Statistical differences - - - - - - 10 - 7
Total consumption 652 757 760 1 115 1 321 1 414 1 356 1 424
Closing stock level - 33 76 142 303 335 363 363
Source: Annual Oil Statistics.
INTERNATIONAL ENERGY AGENCY

OIL INFORMATION (2011 Edition) - III.525
SWITZERLAND
Table 5A: Gas/diesel oil - supply and consumption
000 metric tons
1973 1978 1980 1990 2007 2008 2009 2010e
Refinery output 2 376 1 815 2 018 1 167 2 172 2 326 2 381 2 269
+ Recycled products - - - - - - - -
+ Imports 5 312 5 798 5 295 5 471 3 156 3 975 4 556 3 508
- Exports 3 1 6 8 17 7 6 20
- Intl. marine bunkers - - - 18 9 10 8 10
+ Transfers - - - - 9 11 11 7 10
+ Stock changes 102 - 38 - 169 85 232 - 58 - 154 38
- Statistical differences - 14 - - 292 - 688 - 406 276 110
Total consumption 7 801 7 574 7 138 6 396 6 233 6 643 6 500 5 685
Transformation 19 20 2 43 27 19 19 ..
Main activity producer electricity - - - - - - - ..
Autoproducer electricity - - - 4 10 4 4 ..
Main activity producer CHP 19 20 2 23 1 1 1 ..
Autoproducer CHP - - - 8 9 8 6 ..
Main activity producer heat - - - 8 7 6 8 ..
Autoproducer heat - - - - - - - ..
Petrochemical industry - - - - - - - ..
Other transformation - - - - - - - ..
Energy industry own use - - - - 1 - - ..
Refinery fuel - - - - 1 - - ..
Other energy industry - - - - - - - ..
Final consumption 7 782 7 554 7 136 6 353 6 205 6 624 6 481 ..
Transport
756 511 556 879 1 988 2 192 2 221 ..
Aviation - - - - - - - ..
Road 691 493 536 862 1 968 2 172 2 201 ..
Rail 20 10 11 9 12 12 12 ..
Domestic navigation 45 8 9 8 8 8 8 ..
Non-specified - - - - - - - ..
Industry
1 075 1 250 1 120 310 659 655 629 ..
Iron and steel - - - - 9 9 8 ..
Chemical (incl. pet.-chem.) - - - 67 88 74 70 ..
Non-ferrous metals - - - 13 2 4 4 ..
Non-metallic minerals - - - 19 38 36 42 ..
Transport equipment - - - - - - - ..
Machinery - - - 122 150 192 175 ..
Mining and quarrying - - - - - - - ..
Food and tobacco - - - 33 105 102 104 ..
Pulp, paper and printing - - - 8 32 28 28 ..
Wood and wood products - - - - - - - ..
Construction - - - 23 92 97 99 ..
Textiles and leather - - - 8 24 18 20 ..
Non-specified 1 075 1 250 1 120 17 e 119 95 79 ..
Other
5 951 5 793 5 460 5 164 3 558 3 777 3 631 ..
Commerce and public - 1 746 1 521 1 812 981 1 039 999 ..
Residential - 3 982 3 872 3 267 2 533 2 687 2 583 ..
Agriculture (incl. fishing) 55 65 67 85 - - - ..
Non-specified 5 896 - - - 44 51 49 ..
Memo: Non-energy use - - - - - - - ..
Chem/petchem. feedst. - - - - - - - ..
Other - - - - - - - ..
Closing stock level - 3 377 3 883 3 598 2 599 2 657 2 811 2 773
Source: Annual Oil Statistics.
INTERNATIONAL ENERGY AGENCY

III.526 - OIL INFORMATION (2011 Edition)
SWITZERLAND
Table 5B: Fuel oil (residual) - supply and consumption
000 metric tons
1973 1978 1980 1990 2007 2008 2009 2010e
Refinery output 2 125 921 802 504 587 596 383 375
+ Recycled products - - - - - - - -
+ Imports 730 915 470 70 - 7 63 33
- Exports 225 21 19 130 447 494 411 322
- Intl. marine bunkers - - - - - - - -
+ Transfers - - - - - - - -
+ Stock changes 10 - 178 18 104 - 12 2 45 - 17
- Statistical differences - 1 - - 24 2 - 5 - 7 - 7
Total consumption 2 641 1 637 1 271 524 126 116 87 76
Transformation 413 316 110 90 6 4 3 ..
Main activity producer electricity - - - 68 - - - ..
Autoproducer electricity - - - - - - - ..
Main activity producer CHP 413 316 110 9 - - - ..
Autoproducer CHP - - - 13 6 4 3 ..
Main activity producer heat - - - - - - - ..
Autoproducer heat - - - - - - - ..
Petrochemical industry - - - - - - - ..
Other transformation - - - - - - - ..
Energy industry own use 76 35 47 31 29 17 18 ..
Refinery fuel 76 35 47 31 29 17 18 ..
Other energy industry - - - - - - - ..
Final consumption 2 152 1 286 1 114 403 91 95 66 ..
Transport
- - - - - - - ..
Aviation - - - - - - - ..
Road - - - - - - - ..
Rail - - - - - - - ..
Domestic navigation - - - - - - - ..
Non-specified - - - - - - - ..
Industry
1 887 1 046 964 403 91 95 66 ..
Iron and steel - - - - 1 1 1 ..
Chemical (incl. pet.-chem.) - - - 50 - 2 2 ..
Non-ferrous metals - - - - - - - ..
Non-metallic minerals - - - 124 35 41 30 ..
Transport equipment - - - - - - - ..
Machinery - - - 49 - - - ..
Mining and quarrying - - - - - - - ..
Food and tobacco - - - 27 - - - ..
Pulp, paper and printing - - - 126 53 48 30 ..
Wood and wood products - - - - - - - ..
Construction - - - - - - - ..
Textiles and leather - - - 26 - - - ..
Non-specified 1 887 1 046 964 1 2 3 3 ..
Other
265 240 150 - - - - ..
Commerce and public - - - - - - - ..
Residential - - - - - - - ..
Agriculture (incl. fishing) - - - - - - - ..
Non-specified 265 240 150 - - - - ..
Memo: Non-energy use - - - - - - - ..
Chem/petchem. feedst. - - - - - - - ..
Other - - - - - - - ..
Closing stock level - 530 512 191 123 121 76 93
Source: Annual Oil Statistics.
INTERNATIONAL ENERGY AGENCY

OIL INFORMATION (2011 Edition) - III.527
SWITZERLAND
Table 5C: Total products - supply and consumption
000 metric tons
1973 1978 1980 1990 2007 2008 2009 2010e
Refinery output 6 126 4 236 4 550 3 047 4 740 5 095 4 816 4 518
+ Recycled products - - - - - - - -
+ Imports 8 720 9 471 8 553 9 880 6 964 7 719 8 291 7 302
- Exports 236 51 48 163 549 638 512 399
- Intl. marine bunkers - - - 18 9 10 8 10
+ Transfers - - - - 14 14 9 12
+ Stock changes 103 - 219 - 190 157 254 - 43 - 112 14
- Statistical differences - 15 - - 316 - 699 - 425 316 96
Total consumption 14 728 13 437 12 865 12 587 12 113 12 562 12 168 11 341
Transformation 549 366 142 140 36 25 23 ..
Main activity producer electricity 19 - - 68 - - - ..
Autoproducer electricity - - - 4 10 4 4 ..
Main activity producer CHP 432 336 112 32 1 1 1 ..
Autoproducer CHP - 7 10 21 16 13 10 ..
Main activity producer heat - - - 8 7 6 8 ..
Autoproducer heat - - - - - - - ..
Petrochemical industry - - - - - - - ..
Other transformation 98 23 20 7 2 1 - ..
Energy industry own use 261 186 197 126 301 335 318 ..
Refinery fuel 261 186 197 126 301 335 318 ..
Other energy industry - - - - - - - ..
Final consumption 13 918 12 885 12 526 12 321 11 776 12 202 11 827 ..
Transport
3 930 3 892 4 075 5 750 6 800 7 018 6 897 ..
Aviation 658 765 767 1 120 1 326 1 418 1 360 ..
Road 3 207 3 109 3 288 4 613 5 453 5 579 5 516 ..
Rail 20 10 11 9 12 12 12 ..
Domestic navigation 45 8 9 8 9 9 9 ..
Non-specified - - - - - - - ..
Industry
3 707 2 897 2 771 1 299 1 329 1 301 1 198 ..
Iron and steel - - - - 10 10 9 ..
Chemical (incl. pet.-chem.) 149 122 135 247 197 192 165 ..
Non-ferrous metals - - - 39 2 4 4 ..
Non-metallic minerals - - - 160 73 77 72 ..
Transport equipment - - - - - - - ..
Machinery - - - 171 150 192 175 ..
Mining and quarrying - - - - - - - ..
Food and tobacco - - - 60 105 102 104 ..
Pulp, paper and printing - - - 134 85 76 58 ..
Wood and wood products - - - - - - - ..
Construction 461 345 351 337 406 399 394 ..
Textiles and leather - - - 34 24 18 20 ..
Non-specified 3 097 2 430 2 285 117 277 231 197 ..
Other
6 281 6 096 5 680 5 272 3 647 3 883 3 732 ..
Commerce and public - 1 746 1 521 1 812 981 1 039 999 ..
Residential - 3 982 3 872 3 270 2 533 2 687 2 583 ..
Agriculture (incl. fishing) 92 90 91 104 - - - ..
Non-specified 6 189 278 196 86 133 157 150 ..
Memo: Non-energy use 781 623 644 577 603 575 528 ..
Chem/petchem. feedst. 149 122 135 127 107 116 93 ..
Other 632 501 509 450 496 459 435 ..
Closing stock level - 4 954 5 544 5 005 4 544 4 587 4 699 4 685
Source: Annual Oil Statistics.
INTERNATIONAL ENERGY AGENCY