Kortum P. (ed.) HCI Beyond the GUI. Design for Haptic, Speech, Olfactory, and Other Nontraditional Interfaces
Подождите немного. Документ загружается.


in a narrow range of frequencies and has a bandwidth that varies with frequency.
For frequencies below 200 Hz, the bandwidth is constant at around 90 Hz, while
for higher frequencies it is approximately 20 percent of the center frequency.
The width of these filters, or “critical bands,” determines the minimum frequency
spacing between two sounds required to perceive them separately. Sounds that
fall within the same “critical band” will generally be difficult to separate
perceptually.
Pitch
is the subjective attribute of periodic sound that allows it to be ordered
on a musical scale or to contribute to a melody. For pure sinusoids, the pitch is
monotonically related to the frequency, with higher frequencies giving rise to
higher pitches. For complex periodic sounds, pitch is monotonically related to
the fundamental frequency. Most musical instruments produce periodic sounds
that have a strong pitch. Periodic sounds without a strong pitch can nonetheless
be told apart (discriminated) based on their spectral content.
Loudness
The subjective experience of loudness is related to its physical correlate, the inten-
sity of a sound waveform (or square of the pressure amplitude) (Figure 5.1), and has
been described using several different scales (such as the sone scale) (Stevens,
1957). Human listeners are sensitive to a large range of intensities, with sensitivity
that is roughly logarithmic so that the smallest detectable change in loudness for
wideband sounds is approximately a constant fraction of the reference loudness.
Listeners can detect intensity changes of just a few decibels (dB)—defined as
10 times the logarithm of the ratio of the intensities—for many types of stimuli.
Timbre
For a complex sound, energy can be distributed in different ways across frequency
and time, giving the sound its quality or timbre. For example, two complex tones
of the same pitch and loudness may differ in their timbre due to the detailed struc-
ture of the waveform (e.g., differences in the relative magnitudes of the various
frequency components). In intuitive terms, these differences are what distinguish
instruments (e.g., the bowed violin from the percussive piano) playing the same
note or chord from the same location with the same loudness.
Temporal Structure
Most sounds are not stationary, but turn on and off or fluctuate across time.
Human listeners are exquisitely sensitive to such temporal changes. Temporal
resolution is often quantified as the smallest detectable silent gap in a stimulus,
and is on the order of a few milliseconds for human listeners (Plomp, 1964).
Temporal resolution can also be described in terms of how well listeners can
detect fluctuations in the intensity of a sound over time (amplitude modulation).
Modulation detection thresholds are constant for rates up to about 16 Hz, but
5 Auditory Interfaces
152

sensitivity decreases for rates from 16 to 1,000 Hz, where modulation can no lon-
ger be detected. For human listeners, relatively slow temporal modulations
are particularly important, as they contribute significantly to the intelligibility of
naturally spoken speech (Shannon, Zeng, Kamath, Wygonski, & Ekelid, 1995).
Spatial Location
Sounds can arise from different locations relative to the listener. Localization of
sound sources is possible due to a number of physical cues available at the two
ears (see Carlile, 1996, for a review). Differences in the arrival time and intensity
of a sound at the two ears (caused by the head acting as an acoustic obstacle) allow
an estimation of location in the horizontal plane. For example, a sound originating
from the left side of a listener will arrive at the left ear slightly earlier than the
right (by tens to hundreds of milliseconds) and will be more intense in the left
ear than in the right (by up to tens of decibels).
In addition, the physical structure of the outer ear alters incoming signals and
changes the relative amount of energy reaching the ear at each frequency. This
spectral filtering depends on the direction of the source relative to the listener,
and thus provides directional information to complement that provided by the
interaural cues (e.g., allowing elevation and front–back discrimination). For esti-
mating the distance of sound sources, listeners use a number of cues, including
loudness, frequency content, and (when listening in an enclosed space) the ratio
of the direct sound to the energy reflected from nearby surfaces such as walls and
floors (Bronkhorst & Houtgast, 1999).
The spatial resolution of the human auditory system is poor compared to that
of the visual system. For pairs of sound sources presented in succession, human
listeners are just able to detect changes in angular location of around 1 degree
for sources located in the front, but require changes of 10 degrees or more for
discrimination of sources to the side (Mills, 1958). For the case of simulta-
neous sources, localization is well preserved as long as the sources have different
acoustic structures and form clearly distinct objects (Best, Gallun, Carlile, &
Shinn-Cunningham, 2007).
5.1.3 Using Auditory Dimensions
When using sound to display information, the available auditory dimensions and
human sensitivity to these dimensions are critical factors. However, there are also
a number of design questions related to how to map data to these dimensions in
an effective way.
As an example, it is not always clear how data polarity should be mapped.
Intuitively, increases in the value of a data dimension seem as though they should
be represented by increases in an acoustic dimension. Indeed, many sonification
examples have taken this approach. For example, in the sonification of historical
5.1 Nature of the Interface
153

weather data, daily temperature has been mapped to pitch using this “positive
polarity,” where high pitches represent high temperatures and low pitches repre-
sent low temperatures (Flowers, Whitwer, Grafel, & Kotan, 2001). On the other
hand, a “negative polarity” is most natural when sonifying size, whereby decreas-
ing size is best represented by
increasing
pitch (Walker, 2002). To add to the
complexity of decisions regarding polarity, in some cases individual listeners vary
considerably in their preferred polarities (Walker & Lane, 2001).
As another example, redundant mappings can sometimes increase the
effectiveness with which information is conveyed. Recent work (Peres & L ane,
2005) has shown that the use of pitch and loudness in conjunction when soni-
fying a simple data set can lead to better pe rformance, but other conjunctions
may not.
5.1.4 Perceptual Considerations with Complex
Displays
Multiple Mappings
With multidimensional data sets, it may be desirable to map different data dimen-
sions to different perceptual dimensions. As an example, the pitch and loudness of
a tone can be manipulated to simultaneously represent two different parameters
in the information space (see Pollack & Ficks, 1954). However, recent work has
shown that perceptual dimensions (such as pitch and loudness) can interact such
that changes in one dimension influence the perception of changes in the other
(Neuhoff, 2004).
In many cases, the most effective way of presenting multiple data sets
may be to map them to auditory objects with distinct identities and distinct
spatial locations. These objects can be defined on the basis of their identity
(e.g., a high tone and a low tone) or their location (e.g., a source to the left and
a source to the right). This approach theoretically allows an unlimited number
of sources to be presented, and offers the listener a natural, intuitive way of
listening to the data.
Masking
Masking describes a reduction in audibility of one sound caused by the presence
of another. A classic example of this is the reduction in intelligibility when speech
is presented against a background of noise.
In auditory displays with spatial capabilities, separating sources of interest
from sources of noise can reduce masking. For example, speech presented against
a background of noise is easier to understand when the speech and the noise are
located in different places (e.g., one on the left and one on the right). In such a
situation, the auditory system is able to use differences between the signals at
the ears to enhance the perception of a selected source. In particular, it is able
5 Auditory Interfaces
154

to make use of the fact that one of the two ears (the one nearest the speech target)
is biased acoustically in favor of the target sound due to the shadowing of the
noise by the head (Bronkhorst, 2000).
Auditory Scene Analysis and Attention
Another crucial consideration when delivering multiple signals to a listener is how
the auditory system organizes information into perceptual “streams” or “objects.”
A basic principle of auditory scene analysis (Bregman, 1990) is that the auditory
system uses simple rules to group acoustic elements into streams, where the ele-
ments in a stream are likely to have come from the same object. For example,
sounds that have the same frequency content or are related harmonically are
likely to be grouped into the same perceptual stream.
Similarly, sounds that have synchronous onsets and offsets and common
amplitude and frequency modulations are likely to be grouped together into a sin-
gle perceptual object. In addition, sounds that are perceived as evolving over time
from the same spatial location tend to be perceived as a related stream of events.
Grouping rules can be used in auditory display design when it is desirable that
different signals be perceived as a coherent stream, but unwanted groupings can
lead to disruptions in the processing of individual signals.
Confusion about which pieces of the acoustic mixture belong to which sound
source are q uite common in auditory scenes containing sounds that are similar
along any of these dimensions (Kidd, Mason, & Ar bogast, 20 02). Re lat ed to this
issue, sources in a mixture can compete for attention i f each source is particu-
larly sal ient or contains features that may be relevant to the listener’s behavioral
goals. By making a target source distinct along one of the perceptual dimensions
discussedpreviously(e.g.,bygivingitadistinctpitchorspatiallocation),confu-
sion can be reduced because the listener’s attention will be selectively directed
along that dimension. For example, when a listener must attend to one voice
in a mixture of competing voices, the task is much easier (and less confusion
occurs) when the target voice differs in gender from its competitors (Darwin &
Hukin, 2000).
Auditory Memory
In complex auditory displays, the capabilities and limitations of auditory memory
are important considerations. The auditory system contains a brief auditory store
(“immediate” or “echoic” memory) where a crude representation of the sensory
stimulus is maintained, normally for no longer than two seconds (Neisser,
1967). This store makes it possible to retain a sound temporarily in order to make
comparisons with later-arriving sounds, as well as to process simultaneous stimuli
in a serial fashion (Broadbent, 1958). When stimuli are processed in more detail
(such as the semantic processing of speech or the learning of a sound pattern in
the environment), there is the possibility for more permanent, categorical repre-
sentations and long-term storage.
5.1 Nature of the Interface
155
5.2
TECHNOLOGY OF THE INTERFACE
This section provides a brief overview of the technology required to create audi-
tory displays. A typical auditory display system encompasses the various compo-
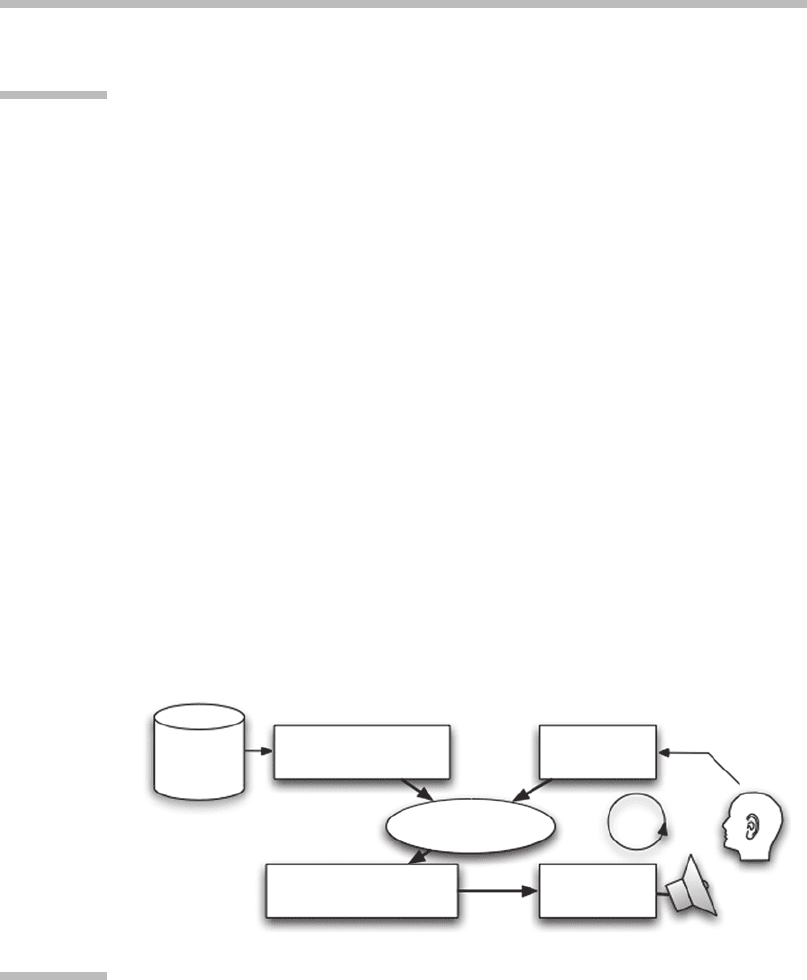
nents sketched in Figure 5.2. These components establish a closed-loop system
that integrates the user and can be recreated in almost any auditory interface.
It is often possible for the user to interact with the system—this can be a very sim-
ple interaction like starting the sonification playback, or it can involve more com-
plex continuous interactions, which are the particular focus of interactive
sonification (described later).
5.2.1 Auditory Display Systems
The loudspeakers or “physical” displays are the only visible (and audible) part
in this chain and are often referred to as the “front end” of the auditory display
system (ADS). Most of the technology for the ADS is hidden behind the curtain
of computation, algorithms, and signal processing. The current section focuses
mostly on these “back-end” or invisible parts. (For further reading on the sound
engineering and hardware of ADSs, the reader should consult specialized literature
such as Miranda, 1998.)
Concerning the sound hardware (or front end of the ADS), the choice of
whether to use headphones or speakers is determined basically by issues such
as privacy, mobility, practicality, isolation, and/or user goals. Loudspeakers, for
instance, do not require the listener to wear any electronic equipment and thus
Data
A: Representation and
preprocessing
Interactions
B: Application,
processing loop
C: Sonification
techniques (rendering)
D: Technical
sound display
FIGURE
5.2
Sketch of the information flow in a typical auditory display system.
A: Data representation. B: Main application (processing loop), which uses the data
to determine when sounds should be created. C: Auditory display techniques to
render an acoustic signal (digital audio signal) based on the data. D: Technical
sound display systems such as sound cards, mixers, amplifiers, headphones,
or loudspeakers to convert the digital audio signals to audible vibrations at the
user’s eardrums.
5 Auditory Interfaces
156

increase the user’s mobility, yet their sounds are audible to everyone in the room.
Headphones, in contrast, allow a personal auditory display yet may be impractical
since they may interfere with auditory perception of the natural surroundings and
thus isolate the user from his or her environment.
Loudspeaker and headphone systems also differ in their ability to commu-
nicate the source location of sound. This aspect of auditory interfaces is highly
relevant for applications where the goal is to direct the user’s focus of attention.
Multispeaker systems (Pulkki, 1997) are well suited if the user can be assumed
to be stationary and located in a “sweet spot.” Typically, headphones lead to the
user perceiving the source within his or her head; however, three-dimensional
(3D) spatialization with headphones can be achieved by modeling the filter effect
of the outer ear (see Spatial Location in Section 5.1.2). This is done mathemati-
cally with an adjustment of the source sound using head-related transfer functions
(HRTFs) (Carlile, 1996). To be convincing, however, the head position and orien-
tation of the listener have to be tracked so that the perceived sound source
position can be kept constant while the user moves his or her head.
The technology for the front end of the ADS (D in Figure 5.2) is well devel-
oped and continues to advance due to the work of sound and product engineers.
However, the larger back end of the ADS, consisting of the technologies to
compute sound signals for auditory displays (A through C in Figure 5.2), is much
younger and thus not as well developed. This back end will be the focus of
Sections 5.2.2 through 5.2.4. A note for the human factors/usability practitioner:
In order to describe the technology of the auditory interface, the information that
will be displayed to the user must often be described in terms of programming
code or computer science. Thus, for the benefit of readers wanting to create auditory
displays, in these technology-oriented sections we will use mathematical descrip-
tions and program code examples. However, readers less familiar with programming
may want to skip the mathematics/programming details.
5.2.2 Data Representation and Processing
Let us start the discussion of technologies from the point in the information circle
where information is created, measured, or becomes available within a computer
system (depicted in Figure 5.2 as A). Information may have a highly different appear-
ance, from a symbolic (textual) level (e.g., an alarm condition that a cooling system
failed) to a more analogic level of raw measurements (e.g., temperature values). Data
are frequently organized as a table of numbers, each column representing a different
feature variable, each row representing measurements for a single record. In a cen-
sus data set, for instance, columns could be features such as income, weight, and
gender, while rows could represent different persons. We call such a representation
data set
X
, and in most cases data or information can be recoded into such a form.
We will refer to rows of
X
as
~
x
, and to the
i
-th feature as
x
i
.
Many auditory displays—ranging from applications in process monitoring and
exploratory data analysis sonifications to table viewers for blind users—operate
5.2 Technology of the Interface
157

using this type of data representation. Communication of single events (e.g., to
signal that an e-mail arrived) is also common. The message can be characterized
by a set of feature values (e.g., sender, e-mail length, urgency, existing e-mail
attachments, etc.). These values form a row vector
~
x
following the previous rep-
resentation. An auditory display technique should be able to represent all possible
feature vectors using the systematic transformation of event data to sound.
Statistics and data mining (Fayyad, Piatetsky-Shapiro, Smyth, & Uthurusamy,
1996) are the disciplines concerned with explaining all peculiarities of how data
are structured and summarized, and a thorough introduction would exceed the
scope of this chapter. Central aspects of data, though, are the range (minimum/
maximum values), whether the data are discrete or continuous, and whether a
variable is nominal or ordinal. It is important to identify these aspects of data
because certain auditory variables are often considered better suited to represent
certain data types; for example, timbre is a better match for nominal variables
whereas frequency fits well with ordinal variables. Data features with a zero value
(e.g., velocity of a car) match with acoustic variables that have a zero value (e.g.,
loudness, vibrato frequency, pulsing rate, etc.).
5.2.3 Sound Synthesis
Sound synthesis is the technological basis for controlling sound characteristics
with data. In rare cases, it might be possible to simply record sounds for every pos-
sible condition or event. But whenever full control over all sound characteristics is
wished or needed, sound synthesis is essential.
Digital sound signals are vectors of numbers that describe the sound pressure
at every moment. Real-time sound computing is thus computationally quite
demanding and scales with the number of independent audio channels. Powerful
programming systems for sound synthesis are available. The following code exam-
ples derive from SuperCollider (McCartney, 1996), a versatile, compact, powerful,
and open-source textual programming system. Pure Data is another graphical
engine (also cross-platform and open-source) (Puckette, 1997).
Additive/Subtractive Synthesis
Additive synthesis is the creation of complex sounds from simple ingredients.
These ingredients are the building blocks in a bottom-up approach. The building
blocks are simple signals (such as sine waves
b
o
(t) ¼ sin(ot þ j)
), and their super-
position represents the result of additive sound synthesis
sðtÞ¼wðtÞ
X
N
i ¼1
a
k
b
o
k
ðtÞ¼wðtÞ
X
N
i¼1
a
k
sinðo
k
t þ j
k
Þ
To obtain harmonic timbres, frequencies
o
k
are chosen as integer multiples of
a fundamental frequency
o
1
. The coefficients
a
i
determine how strongly each
5 Auditory Interfaces
158

component contributes to the sound. An example of achieving additive synthesis
in SuperCollider follows: For only two partial tones of 440 Hz, the designer would use
{SinOsc.ar(440, mul: 0.4) þ SinOsc.ar(880, mul: 0.2)}.play
Sound example S1 (at
http://sonification.de/publications/BeyondGUI
) provides
one second of the sound. Sound examples S2 to S4 demonstrate some typical addi-
tive synthesis sounds.
Subtractive synthesis
takes the opposite (top-down) approach and creates
complex timbres by removing material from a spectrally rich source such as
sawtooth-shaped signals (refer to Section 5.1 for more on signal shapes), pulse
trains, or spectrally rich noise signals. A good introduction to subtractive synthesis
can be found in Moore (1990). Sound examples S5 to S8 demonstrate some typical
sounds of subtractive synthesis, and sound examples S9 to S12 demonstrate
different filters.
Wavetable Synthesis
One of the most practically relevant synthesis techniques is wavetable synthesis,
in which a recorded version of a real-world sound is used to generate the synthe-
sized output. Mixing and manipulating the synthesis algorithm allows the audio
designer to create novel sounds or to play a sample at different musical notes.
Many commercial sound synthesizers rely on this technique, and most of the
auditory icons (discussed later) are produced using wavetable synthesis.
In SuperCollider, a wavetable is represented by a
Buffer, and a PlayBuf unit
generator can be used to play the buffer at arbitrary speed, as demonstrated in the
following code example (sound example S13), where the playback rate is slowly
modulated by the sine oscillator:
b ¼ Buffer.read(s,“soundsample.wav”) ;
{PlayBuf.ar(1, b.bufnum, SinOsc.kr(0.2, mul: 0.4, add: 1)*
BufRateScale.kr(b.bufnum), loop: 1)}.play
Other Synthesis Techniques
Other synthesis techniques include granular synthesis, physical modeling sound
synthesis, FM-synthesis, and nonlinear synthesis. Discussion of these techniques
easily fills books, and the interested reader should look to Moore (1990), Roads
(2001), and Cook (2002) for more information.
5.2.4 Auditory Display Techniques in a Nutshell
This section focuses on various auditory display techniques. In general, these
techniques are algorithms that connect the data to be displayed to sound synthesis
techniques (described in Section 5.2.3). As mentioned previously, auditory display
5.2 Technology of the Interface
159

techniques can roughly be characterized as symbolic or analogic. We start here
with symbolic sonification techniques.
Auditory icons:
Auditory icons, as mentioned earlier, represent specific messages
via an acoustic event that should enable the quick and effortless identification
and interpretation of the signal with respect to the underlying information.
These sounds need to be selected from a database of recordings, or synthesized
according to the data features, which is practically achieved by adapting appro-
priate sound synthesis algorithms (see Section 5.2.3).
Earcons:
Different from auditory icons, earcons use musical motifs to represent
messages and require the user to learn the meaning for each earcon. As a
benefit, earcons can inherit structural properties from language as a more
abstract and highly symbolic form of communication (Blattner, Papp, & Glinert,
1994). These sounds can be built using concatenation, which allows the designer
to compose more complex messages from simple building blocks.
Audification:
In audification, the data “speak for themselves” by using every data
value as a sound sample in a sound signal
s(t)
. Since only variations above 50 Hz
are acoustically perceptible (see Section 5.1), audifications often consume
thousands of samples per second. Thus, the technique is suitable only if (1) enough
data are available, (2) data can be organized in a canonical fashion (e.g., time-
indexed measurements), and (3) data values exhibit variations in the selected
feature variable. Mathematically, audification can be formalized as the creation
of a smooth interpolation function going through a sample of (time, value) pairs
(t
a
,
x
a
)
for all data items
a
. The simplest implementation of audification, however,
is just to use the measurements directly as values in the digital sound signal by
setting
s[n] ¼ x
n
. Some sound examples for audifications demonstrate the typical
acoustic result (S14, S15). S14 is an audification of EEG measurements—one elec-
trode measures the brain activity of a beginning epileptic attack (roughly in the
middle of the sound example). S15 plays the same data at lower time compression.
Clearly the pitch drops below the well-audible frequency range and the epileptic
rhythm is perceived as an audible rhythm of events.
Parameter mapping sonification (PMS):
This is the most widely used sonification
technique for generating an auditory representation of data. Conceptually, the
technique is related to scatter plotting, where features of a data set determine
graphical features of symbols (such as
x
-position,
y
-position, color, size, etc.)
and the overall display is a result of the superposition of these graphical ele-
ments. For example, imagine a data set of measurements for 150 irises. For each
flower, measurements of the petal length, sepal length, petal width, and sepal
width are listed. A parameter mapping sonification (S16) could, for instance,
map the petal length to the onset time of sonic events, the sepal length to the
pitch of sonic events, the petal width to brilliance, and the sepal width to dura-
tion. The resulting sonification would allow the listener to perceive how the data
5 Auditory Interfaces
160

are organized in time or change with time. Each sound event represents a sin-
gle flower, while the PMS displays the entire data set of measurements of all
150 flowers!
Model-based sonification (MBS):
This is a structurally very different approach from
PMS (Hermann, 2002). In PMS, data directly control acoustic attributes, whereas
in MBS the data are used to create a sound-capable dynamic model. The result of
this is that a sonification model will not sound at all unless excited by the user and
thus puts interaction into the fore. The set of rules regarding how to create a vir-
tual sound object from data is called a sonification model, and the rules can be
designed in a task-oriented way. For example, imagine that every text message
in a mobile phone is like a marble in a box. By shaking the phone, the marbles
move, interact, and thereby create an acoustic response from which you can
infer how many text messages, size, and so on, have arrived (Williamson, Mur-
ray-Smith, & Hughes, 2007). The excitation here is “shaking,” the dynamics are
the physical laws that describe the marble motion and interactions, and so forth.
The sonification model simulates the entire physical process, and thus creates an
interactive and informative sonification.
Interactive sonification:
This is a special focus in auditory interfaces and can be
used with many types of sonification techniques. Often a particular benefit
results from tightly closed interaction loops between the user and a sonification
system (Hunt & Hermann, 2004). All sonification techniques can be modified to
be more interactive; for instance, for audification, interactive sonification can
enable the user to actively navigate the data while generating the sound and
so on. The rationale behind interactive sonification is that people typically get
latency-free acoustic responses as by-products of their interaction activity, and
they use the acoustic feedback continuously to refine their activity, be it within
a search, scan, discovery, or any other task.
5.3
CURRENT INTERFACE IMPLEMENTATIONS
The following section provides descriptions of when and why auditory interfaces
are currently utilized, both for sighted and visually impaired users.
5.3.1 A Bit of History
Sound often helps direct our focus and describes what is going on. Listening to a
car engine or the spinning of a hard drive can offer vital clues about whether
the car is in good mechanical condition or the computer is finished saving a file.
In early computing, such incidental sounds were often used—for example, beeps
were introduced to indicate errors in the program or the beginning of a new itera-
tion of a program loop. There is a long tradition of audio indicating warnings and
5.3 Current Interface Implementations
161