Lallart M. Ferroelectrics: Applications
Подождите немного. Документ загружается.


Giant k
31
Relaxor Single-Crystal Plate and Their Applications
19
0 100200300 400500
F requency (kH z)
10
1
10
2
10
3
10
4
10
5
01
0
Impedance (Ω)
10
1
10
2
10
3
10
4
10
5
(a)
k31 fundamenta l
3
rd
overtone
5
th
k
32
fundamental + 7
th
9
th 11
th
13
th
(b )
k
31
fundamental
3
rd
overtone
5
th
7
th
9
th
11
th
k32 fundamental
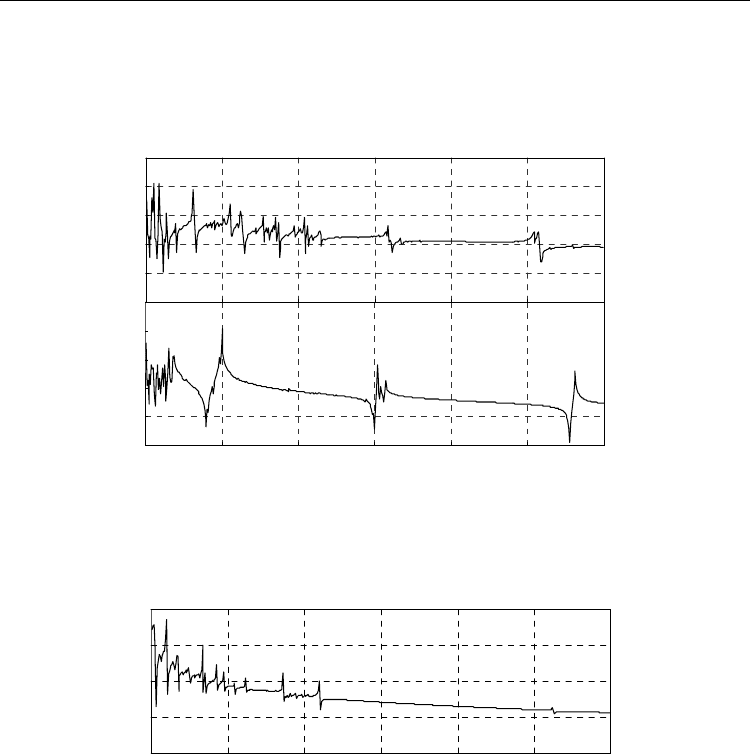
Fig. 16. Frequency responses of impedance on k
31
and k
32
modes in PZNT91/09 single-
crystal plates; (a) measured and (b) simulated data.
0 100 200 300 400 500
F requency (kH z)
(b )
10
1
10
2
10
3
10
4
10
-1
01
0
Impedance (Ω)
10
1
10
2
10
3
10
4
10
5
(a)
k
31 fund amenta l
3
rd
overtone
5
th
k
32
fundamental + 7
th
9
th
k31 fundamental
3
rd
overtone
5
th
7
th
9
th
k
32
fundamental
Fig. 17. Frequency responses of impedance on k
31
and k
32
modes in PMNT74/26 single-
crystal plates; (a) measured and (b) simulated data.
4.1.3 Simulation of k
t
mode by FEM
The impedance responses up to 30 MHz in Fig. 18 were calculated in the PZNT91/09 single-
crystal plates at σ
W
E
/σ
L
E
=3.2, σ
L
E
=0.045-0.13, and σ
W
E
=0.15-0.41. The k
t
fundamental
vibration and the 3rd and 5th overtones of the k
t
fundamental vibration were observed
between σ
L
E
=0.063-0.11 and σ
W
E
=0.20-0.35. In particular, sharp responses of the k
t
fundamental vibration and the 3rd overtone were obtained between σ
L
E
=0.080-0.098 and
σ
W
E
=0.26-0.32. The simulated coupling factor of k
t
=64% was higher than that of k
t
=57%
calculated from the measured response. It was clarified that the large difference in
σ
W
E
/σ
L
E
=3.2 and the suitable values of the elastic compliance, particularly -s
12
E
=9-11 (10
-12
m
2
/N), were key factors for the appearance of the k
t
fundamental vibration and overtones.
Ferroelectrics - Applications
20
The simulated response of the PMNT74/26 single-crystal plates is shown in Fig. 19 at
σ
W
E
/σ
L
E
=4.9 (σ
L
E
=0.041, σ
W
E
=0.20) and s
12
E
=-3 (10
-12
m
2
/N). The fundamental k
t
mode
(k
t
=65%) and the 3rd overtone were observed independent of -s
12
E
values between 1~7 (10
-12
m
2
/N). In the calculations, the values of -s
12
E
were chosen at a Poisson ratio (σ
W
E
) within
0~0.5.
0 5 10 15 20 25 30
Frequency (MHz)
k
t
fundamental
Impedance (Ω)
(a)
(b)
10
1
10
2
10
3
10
4
01
0
10
5
3
rd
overtone
5
th
overtone
k
t
=64%
Fig. 18. Frequency responses of impedance on k
t
mode in PZNT91/09 single-crystal plates;
calculation for (a) σ
W
E
/σ
L
E
=3.2 (σ
L
E
=0.13, σ
W
E
=0.41)/ s
12
E
=-14 (10
-12
m
2
/N) and (b)
σ
W
E
/σ
L
E
=3.2 (σ
L
E
=0.089, σ
W
E
=0.29)/ s
12
E
=-10 (10
-12
m
2
/N).
0 5 10 15 20 25 30
Frequency (MHz)
10
1
10
2
10
3
01
0
10
-1
k
t
fundamental
3
rd
overtone
Impedance (Ω)
k
t
=65%
Fig. 19. Frequency responses of impedance on k
t
mode in PMNT74/26 single-crystal plates;
calculation for σ
W
E
/σ
L
E
=4.9 (σ
L
E
=0.041, σ
W
E
=0.20) and s
12
E
=-3 (10
-12
m
2
/N).
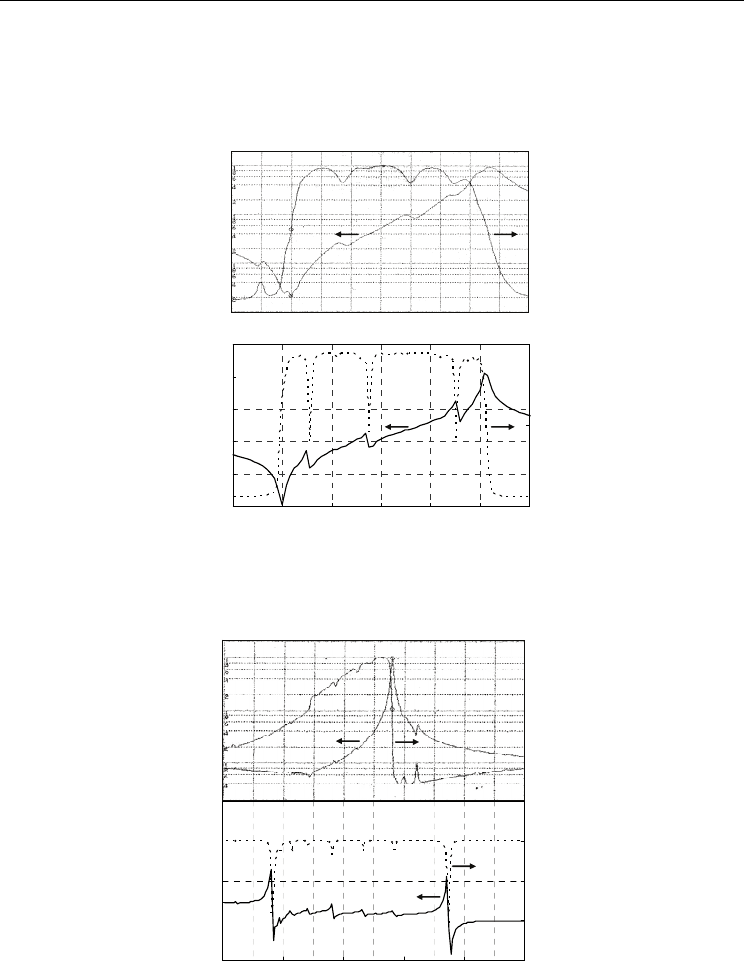
Figure 20 shows the impedance and phase responses of k
t
fundamental vibration in the
PZNT91/09 single-crystal plates. The impedance response consisted of four peaks split into
①-④ in the cases of the simulated and the measured responses. Herein, the PZNT91/09 plate
resonator with a giant k
31
of 84% was prepared under the poling conditions of a DC poling
field (E) of 1200 V/mm. Although the simulation for the splitting was calculated from the
values of σ
W
E
/σ
L
E
=3.2 (σ
L
E
=0.089, σ
W
E
=0.29) and s
12
E
=-10 (10
-12
m
2
/N), the splitting of the four
peaks occurred in the case of a giant k
31
in the PZNT91/09 single-crystal plates. Therefore, it
was confirmed that the simulation data were exactly fitted to the measured data in both the
Giant k
31
Relaxor Single-Crystal Plate and Their Applications
21
cases of the generation of the k
t
mode and the impedance and phase responses of the k
t
fundamental vibration. The impedance and phase responses of the k
t
fundamental vibration of
PMNT74/26 single-crystal plates are shown in Fig. 21 [σ
W
E
/σ
L
E
=4.9 (σ
L
E
=0.041, σ
W
E
=0.20) and
s
12
E
=-3 (10
-12
m
2
/N)] in comparison with the measured responses. The simulated impedance
and phase responses were well fitted to the measured responses.
Impedance (Ω)
01
1
10
2
10
2
10
3
(a)
E=1200 V/mm (k
31
=84.4%)
k
t
=57
Phase (deg)
-90
-90
0
4.5 4.7 5.0
5.2 5.5
5.8
Phase (deg)
3.75 4.00 4.25 4.50 4.75 5.00 5.25
Frequency (M Hz)
(b)
Impedance (Ω)
10
1
10
2
10
3
01
0
10
4
10
5
k
t
=64%
○
1
○
2
○
3
○
4
-90
-90
0
Fig. 20. Frequency responses of impedance and phase on k
t
fundamental vibration in
PZNT91/09 single-crystal plates; (a) measured and (b) simulated data.
8.0 8.8 9.6 10.4 11.2 12.0
Frequency (M Hz)
10
1
10
2
01
0
Impedance (Ω)
Phase (deg)
k
t
=65%
-90
-90
0
10
2
10
3
10
1
k
t
=49%
-90
-90
0
(a)
(b)
E=1000 V/mm (k
31
=80.8%)
Fig. 21. Frequency responses of impedance and phase on k
t
fundamental vibration in
PMNT74/26 single-crystal plates; (a) measured and (b) simulated data.
Ferroelectrics - Applications
22
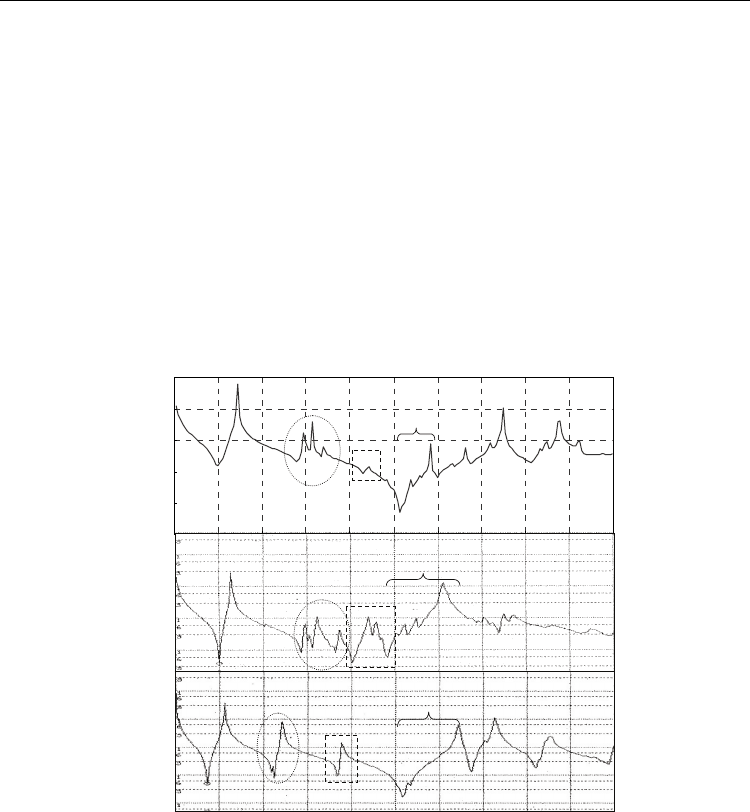
4.1.4 Domain behavior evaluation by FEM
The 3rd overtone in the k
31
mode was calculated to synthesize one-third of the simulated
responses each in the cases of (i) σ
W
E
/σ
L
E
=2.5 (σ
L
E
=0.13, σ
W
E
=0.32), (ii) σ
W
E
/σ
L
E
=2.4
(σ
L
E
=0.13, σ
W
E
=0.31), and (iii) σ
W
E
/σ
L
E
=1.8 (σ
L
E
=0.17, σ
W
E
=0.31). The simulated 3rd overtone
response consisted of three peaks splitting in PZNT91/09 [shown in the circle of Fig. 22(a)].
On the other hand, the plate resonator DC poled at E=400 V/mm, the poling field of which
is just below that required to obtain a giant k
31
, also possesses the 3rd overtone with three
peaks splitting [shown in the circle of Fig. 22(b)]. Therefore, it was thought that the
PZNT91/09 single-crystal plate was composed of three vibration bodies, namely, three large
domains with σ
W
E
/σ
L
E
values of 2.5, 2.4, and 1.8. Since the splitting of the three peaks of the
3rd overtone response formed one peak at E= 1200 V/mm obtaining a giant k
31
of 84.4%
(shown in the circle of Fig. 22(c)), it was proved that a mono-domain plate with a giant k
31
was achieved. From our study, it was confirmed that frequency response analysis of
impedance is an effective tool for the evaluation of domain structures in single-crystal
plates.
(b)
k
32
fundamental
5
th
Impedance (Ω)
10
2
10
3
10
4
10
5
k
31
fundamental
3
rd
overtone
E=400 V/mm
k
31
=70.2%
10
1
10
2
10
3
10
4
01
0
10
5
(a)
k
31
fundamental
3
rd
overtone
k
31
=77.2%
10
1
10
2
10
3
10
4
10
5
Frequency (kHz)
5
th
k
32
fundamental
k
32
fundamental
(c)
0 100
200 300
400 500
3
rd
overtone
k
31
fundamental
k
31
=84.4%
5
th
E=1200 V/mm
Fig. 22. Frequency responses of impedance on 3rd overtone on k
31
mode in PZNT91/09
single-crystal plates; (a) simulated data, (b) measured data of plate resonator DC poled at
E=400 V/mm, and (c) measured data of plate resonator DC poled at E=1200 V/mm.
4.1.5 Origin of giant k
31
from viewpoints of material constants
The most significant factors for realizing giant piezoelectricity in the k
31
mode in the relaxor
single-crystal plates were thought as follows: Firstly, large s
11
E
values of 110 (10
-12
m
2
/N) in
the PZNT91/09 single-crystal plates and 67 (10
-12
m
2
/N) in the PMNT74/26 single-crystal
plates in the direction of length were required (Table 3). These s
11
E
values are relatively
Giant k
31
Relaxor Single-Crystal Plate and Their Applications
23
larger than that of 11-17 (10
-12
m
2
/N) in PZT ceramics. This means that the single-crystal
plates with a giant k
31
of more than 80% became markedly soft and showed a low Poisson
ratio, particularly σ
L
E
<0.1 after DC poling. Secondly, a large anisotropy of bulk wave
velocity (twofold the frequency constant) accompanied by a large σ
W
E
/σ
L
E
=3.2-3.4 in
PZNT91/09 single-crystal plates and a large σ
W
E
/σ
L
E
=4.5-4.9 in PMNT74/26 single-crystal
plates was essential. Therefore, it was thought that the physical meaning of the above-
mentioned large s
11
E
, low σ
L
E
, and large σ
W
E
/σ
L
E
originated from a field-induced phase such
as the orthorhombic phase by DC poling because the combination of the directions of
spontaneous polarization and poling field in the orthorhombic phase could only move
domains in the plates.
In conclusion of this part, impedance response analysis by FEM was performed using the
k
31
, k
32
, and k
t
modes in relaxor single-crystal plates with a giant k
31
. It was found that a
large anisotropy on the k
31
and k
32
modes was generated in the plate resonators with a giant
k
31
. As the Poisson ratios of the length and width directions in the plates were changed, the
simulation results were well fitted to the measured impedance responses. These results
could be explained by the material constants in a field-induced phase induced by the DC
poling field. Furthermore, the domain behavior in the single-crystal plates was evaluated
from the synthesized impedance response of three vibration bodies, i.e., three domains with
different Poisson ratios.
4.2 Giant k
31
and d
31
in relaxor single-crystal plates evaluated using P-E hysteresis
loops and strain
The longitudinal-mode electromechanical coupling factor k
33
of over 90% was easy to obtain
because the vibration direction of the k
33
mode is the same as that of the poling field.
However, the relationship between the giant k
31
and k
33
modes is not clarified. In this part,
we could explain the relationship using P-E hysteresis loops and electric field (E) vs strain
measurement from the viewpoint of giant k
31
.
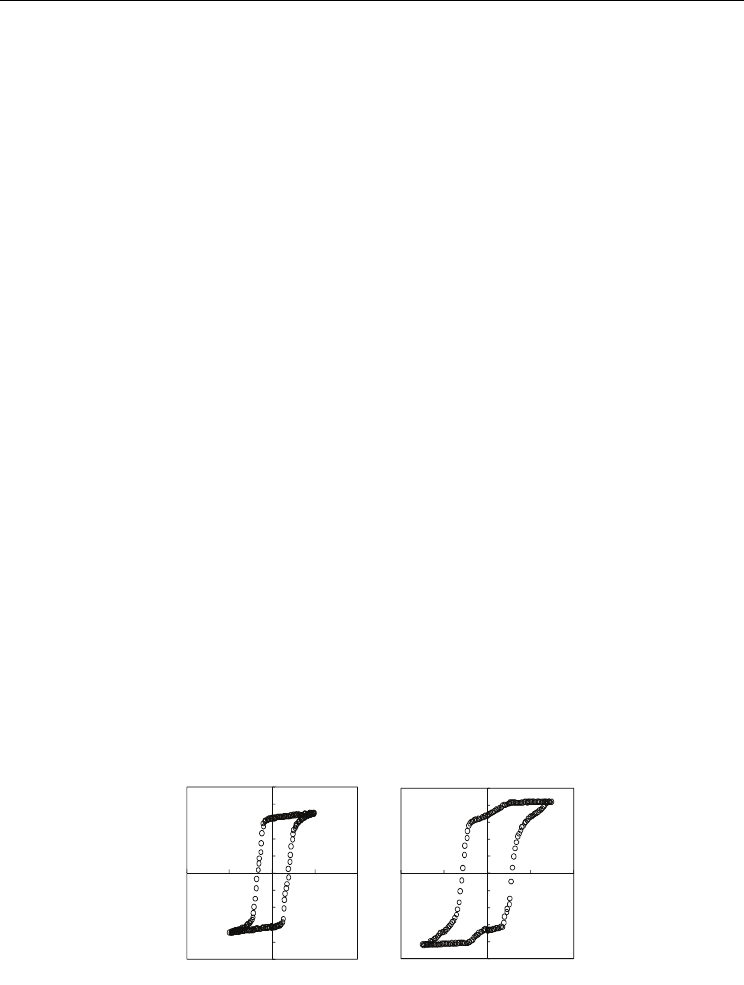
4.2.1 P-E hysteresis loops
Figure 23 shows the electric field (E) dependence of P-E hysteresis loops in (100) PZNT91/09
single-crystal plate measured at 40℃ by a high voltage test system. While a symmetrical P-E
loop was observed at E = 1000 V/mm, a triple loop was generated as E ≧ 1500 V/mm in the
case of the crystal plate with giant k
31
.
-50
-40
-30
-20
-10
0
10
20
30
40
50
-2 -1 0 1 2
P (μC/cm
2
)
E (kV/mm)
-50
-40
-30
-20
-10
0
10
20
30
40
50
-2 -1 0 1 2
P (μC/cm
2
)
E (kV/mm)
(a)
(b)
Fig. 23. P-E hysteresis loops in PZNT91/09 single-crystal plates (a) before (E=1000 V/mm)
and (b) after (E=1500 V/mm) the appearance of giant k
31
over 80%.
Ferroelectrics - Applications
24
Therefore, it was considered that the E of 1500 V/mm is a coercive field to obtain giant k
31
.
In addition, the triple loops were realized at 20-60 ºC, in the rhombohedral phase of
PZNT91/09.
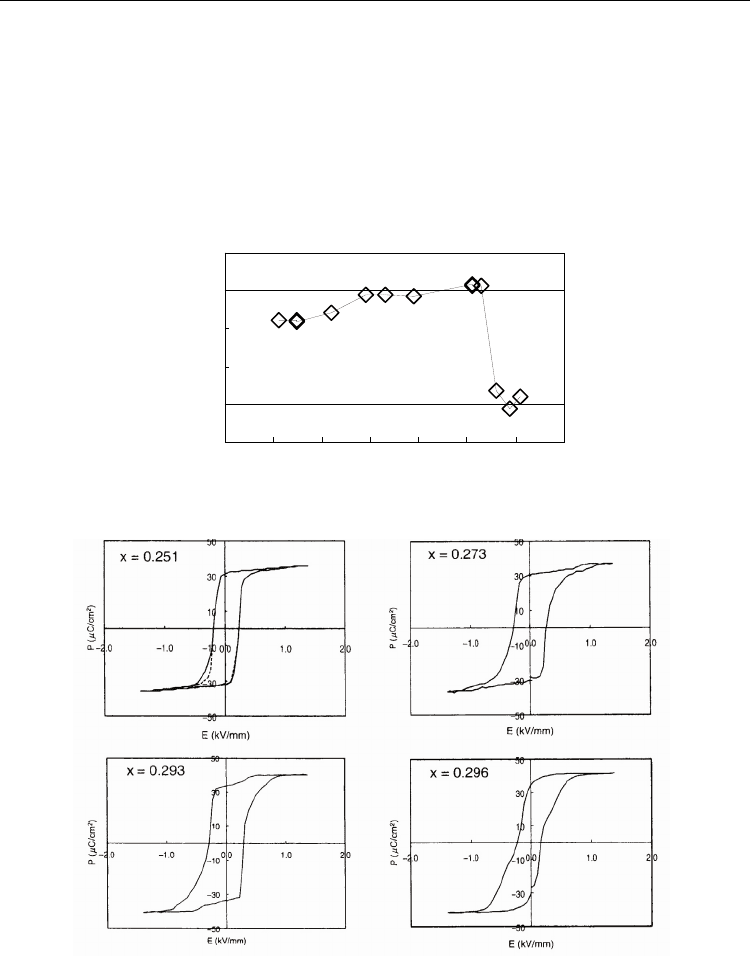
Figure 24 shows the Ti composition (x) dependence of k
31
[Fig. 24(a)] and P-E loops [Fig. 24(b)]
in PMNT(1-x)/x single-crystal plate measured at 40 ºC (pseudo-cubic phase) under E =1500
V/mm. Although a symmetrical P-E hysteresis loop was obtained at x = 0.296-0.301 in the
plate with k
31
=60%, triple loops were observed at x=0.273-0.293, and asymmetrical loops were
observed at x=0.251-0.262 in the plates with giant k
31
(>80%). The E=800 V/mm to generate the
triple and asymmetrical loops corresponds to a coercive field to realize giant k
31
.
50
60
70
80
90
100
24 25 26 27 28 29 30 31
T i (m o l% )
k
31
(% )
(a)
(b)
Fig. 24. Ti composition (x) vs (a) k
31
and (b) P-E hysteresis loops in PMNT(1-x)/x single-
crystal plates; x=0.251 (asymmetrical part near dotted lines), x=0.273/ 0.293 (triple loop at
high E), and x=0.296 (symmetrical loop).

Giant k
31
Relaxor Single-Crystal Plate and Their Applications
25
4.2.2 Shrinkage strain characteristics
Figure 25 shows the dependence of the shrinkage strain measured at room temperature
(rhombohedral phase of PZNT91/09) on the electric field (E) applied in the same direction
as the DC poling field using a photonic sensor. A large hysteresis regarding E vs strain
appeared between 400 and 1500 V/mm, the E of which (1500 V/mm) is the coercive field to
obtain giant k
31
in PZNT91/09. The large hysteresis for E vs shrinkage strain corresponds to
the large hysteresis for E vs expansion strain in PZNT91/09 single crystal. Therefore, it was
found that the large hysteresis for E vs strain (shrinkage and expansion) is due to the
generation of giant k
31
.
0
50
100
0 1000 2000 3000
E (V/mm)
Strain (μm )
0
50
100
0 1000 2000 3000
E (V/mm)
Strain (μm)
0
50
100
0 1000 2000 3000
E (V/mm)
Strain (μm )
0
50
100
0 1000 2000 3000
E (V/mm)
Strain (μm )
0
50
100
0 1000 2000 3000
E (V/mm)
Strain (μm)
0
50
100
0 1000 2000 3000
E (V/mm)
Strain (μm )
Fig. 25. Applied field (E) dependence of shrinkage strain in the length (13 mm) direction in
PZNT91/09 single-crystal plate with giant k
31
.
Figure 26 shows the Ti composition (x) dependence of E vs strain in PMNT(1-x)/x single-
crystal plates measured at room temperature (pseudo-cubic phase) and under E=1500
V/mm. By increasing x from 0.251 to 0.299, the linear relationship between E and strain
changed into a line with a brake, and finally reached to a typical E vs strain similarly to the
case of PZT ceramics. Furthermore, the E of 800 V/mm to generate the triple and
asymmetric loops corresponded to the E of a break in the line for E vs strain.

Ferroelectrics - Applications
26
0.0
0.1
0.2
0.3
0.4
0.0 0.5 1.0 1.5 2.0 2.5 3.0
Strain (%)
E (kV/mm)
x = 0.251
0.0
0.1
0.2
0.3
0.4
0.0 0.5 1.0 1.5 2.0
Strain (%)
E (kV/mm)
x = 0.279
0.0
0.1
0.2
0.3
0.4
0.0 0.5 1.0 1.5
Strain (%)
E (kV/mm)
x = 0.291
0.0
0.1
0.2
0.3
0.4
0.0 0.5 1.0 1.5
Strain (%)
E
(
kV/mm
)
x = 0.299
Fig. 26. Ti composition dependence (x) of E vs strain in PMNT(1-x)/x single-crystal plates;
x=0.251(linear line and small hysteresis), x=0.279/ 0.291 (line with break and intermediate
hysteresis) and x=0.299 (large hysteresis like PZT ceramics).
4.2.3 Field-induced phase transition
A mechanism to realize giant k
31
can be explained using the crystal plane, which closely
affects the direction of the spontaneous polarization, and poling direction. Giant k
31
in
relaxor single-crystal plates can be achieved when the poling field generates strain to move
the ferroelectric domains in the plates (13
L
×4.0
W
mm) and not to only expand the
spontaneous polarization axes in the direction of the poling field. Figure 27 shows the
relationships between crystal planes, spontaneous polarization axes, and poling direction in
(110) PMNT(1-x)/x single-crystal plates (x=0.251-0.301) in comparison with the case of (100)
and (110) PZNT91/09 single-crystal plates. The crystal phases after poling can be estimated
using the values of k
31
and the combination between the directions of the spontaneous
polarization axes and the poling field, which generates the strain to move the domains in the
plates. Therefore, it was considered that the crystal phase of the PMNT(1-x)/x single-crystal
plates after poling changed from pseudo-cubic to pseudo-cubic (x=0.251-0.262) from
pseudo-cubic to orthorhombic (x=0.273-0.293), and from pseudo-cubic to rhombohedral
(x=0.296-0.301), because of the combination to move the domains in the plates. These results
were supported by the fact that the shapes of the P-E loops are triple or asymmetrical.
Furthermore, it was considered that the E for such types of loops to appear was a coercive
field to generate the DC-field-induced phase transition with giant k
31
.
In conclusion of this part, the relationships between giant k
31
(>80%) and k
33
(>90%) in (100)
PZNT91/09 and (110) PMNT(1-x)/x single-crystal plates were clarified to investigate the P-E
hysteresis loops and the strain measurement. Triple and asymmetrical loops appeared in
PMNT(1-x)/x single-crystal plates with giant k
31
as well as in PZNT91/09 single-crystal plates
with giant k
31
. The typical relaxor-type hysteresis was observed for the electric-field-induced
strain and their break points correspond to the coercive field to generate giant k
31
. The crystal
Giant k
31
Relaxor Single-Crystal Plate and Their Applications
27
phases after DC poling could be estimated using the relationships between the crystal plane,
which closely affects the direction of the spontaneous polarization, and poling direction.
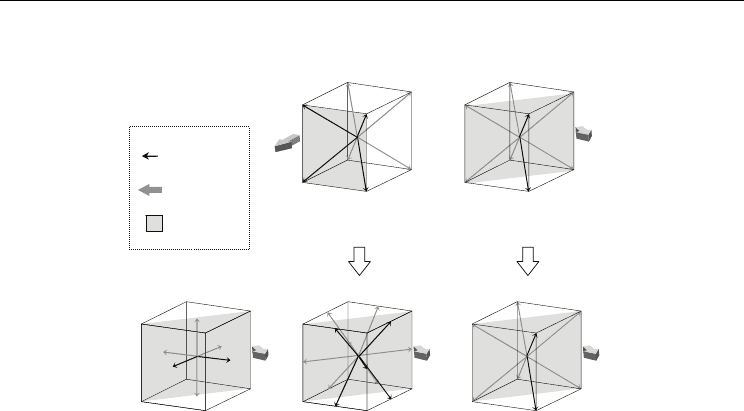
Rhombohedral (100) PZNT
Rhombohedral (110) PMNT Orthorhombic (110) PMNT Pseudo-cubic (110) PMNT
k
31
<60%
k
31
<60%
k
31
>80%
k
31
>80%
k
31
>88%
triple P-E hysteresis loop
triple P-E hysteresis loop symmetrical P-E hysteresis loop
symmetrical P-E hysteresis loop
asymmetrical P-E hysteresis loop
<110>
Rhombohedral (110) PZNT
x = 0.251-0.262 x = 0.273-0.293 x = 0.296-0.301
<110>
<110>
<110>
<100>
Crystal plane
Poling direction
Spontaneous
polarization axes
Fig. 27. Schematic diagrams of relationships between crystal plane, which affects direction of
spontaneous polarization, and poling direction for realizing giant k
31
(>80%) in (110)
PMNT(1-x)/x (pseudo-cubic phase before poling) and PZNT91/09 (rhombohedral phase
before poling) single-crystal plates at poling temperature of 40 ºC.
5. Applications
Utilizing the giant k
31
and d
31
in PZNT91/09 single crystals, devices such as piezoelectric
unimorphs and bimorphs were fabricated in comparison with the devices consisting of PZT
ceramics.
5.1 Applications of Pb[(Zn
1/3
Nb
2/3
)
0.91
Ti
0.09
]O
3
single-crystal plates with giant k
31
to
piezoelectric unimorphs and bimorphs
In this part, the piezoelectric and displacement properties on various kinds of unimorphs
and bimorphs were reported. Piezoelectric unimorphs were prepared by sticking the
PZNT91/09 single-crystal plates with giant k
31
on center shim plates (15
L
x4
W
x0.10
T
/ 0.20
T
mm) composed of 42 nickel alloy. These were compared with unimorphs fabricated by
ordinary PZT ceramic plates (k
31
=37%, d
31
=-330 pC/N) with the same dimensions.
Furthermore, series-type bimorphs were made from the unimorphs by sticking other
PZNT91/09 single-crystal plates and also PZT ceramic plates. The coupling factors on the
bending mode (k
b
) of the unimorphs and bimorphs were evaluated. The displacement of the
devices was measured by laser displacement equipment at room temperature.
5.1.1 Realization of giant k
31
over 80% in single-crystal plates
Table 4 shows the poling and annealing processes to obtain the giant k
31
over 80%. When we
poled three plate samples (13
L
x4
W
x0.36
T
mm) of Nos. 1~3, only the one sample of No. 3-1
had a giant k
31
of 85.6%. The others were 42.2% (No. 1-1) and 40.4% (No. 2-1). Therefore, the
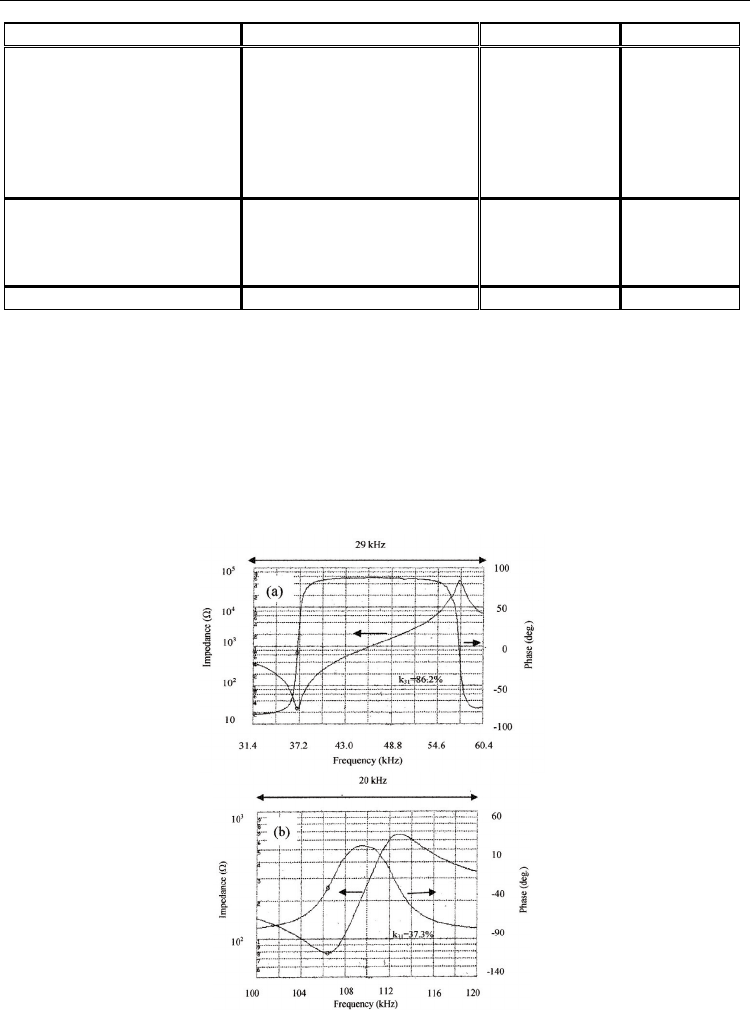
Ferroelectrics - Applications
28
Sample No. E (kV/mm) k
31
(%)
k
t
(%)
1-1 1.0 42.2 55.1
Annealing 0.0 0.0
1-2 1.0 49.6 59.0
1-3 1.5 39.6 55.8
1-4 2.0 79.5 56.2
1-5 2.5 55.7 59.6
1-6 3.0 39.8 55.7
2-1 1.0 40.4 54.9
Annealing 0.0 0.0
2-2 1.0 45.4 54.2
2-3 1.5 86.2 56.2
3-1 1.0 85.6 56.8
Table 4. Process combination of poling and annealing to obtain Giant k
31
.
annealing at 200 ºC for 30 min was carried out to de-polarize the samples. On the following
processes, the poling fields increased from 1.0 kV/mm to 3.0 kV/mm. As a result, the giant
k
31
was realized in the cases of No. 1-4 and No. 2-3 while the electromechanical coupling
factors of the thickness mode (k
t
) were almost the same of 54~60%. This means that the
domain reorientation in thickness had been saturated; on the other hand, the one in the plate
is changeable by the poling field. Furthermore, there was an optimum DC poling field for
appearing the giant k
31
on each individual plate sample. As mentioned above, the giant k
31
can be obtained by the process combination of the DC poling and the annealing. Figure 28
Fig. 28. Frequency responses of impedance on k
31
mode in (a) PZNT91/09 single-crystal
plate and (b) PZT ceramic plate.