Lazinica A. (ed.) Particle Swarm Optimization
Подождите немного. Документ загружается.

Path Planning for Formations of Mobile Robots using PSO Technique
331
genetic algorithms. Nevertheless, the chapter shows some comparison of PSO with limited
maximum velocity and constricted PSO that can improve the result in case of small swarm
and number of iterations.
2. Formation Control
The formation driving method described in this section is based on a leader-follower
approach, in which the followers should follow a leader's trajectory. The method was
developed by Barfoot and Clark (Barfoot et al., 2002; Barfoot & Clark, 2004) and later
improved for following of trajectories with arbitrary shape within our team (Saska et al.,
2006; Hess et al., 2007). In this chapter there will be published only the parts of formation
control necessary for understanding of restrictions applied in the path planning while a
detailed description of control inputs for each vehicle can be found in (Saska et al., 2006;
Hess et al., 2007).
In the description of the method as well as in the final experiments, known map of
environment and utilization of car-like robots with limits for maximum velocity
r
v and
minimum turning radius
r
R will be assumed. Furthermore, around each vehicle will be
considered distance
r
d from its center in which the obstacles have to be avoided (
r
d is
usually a function of robot’s width).
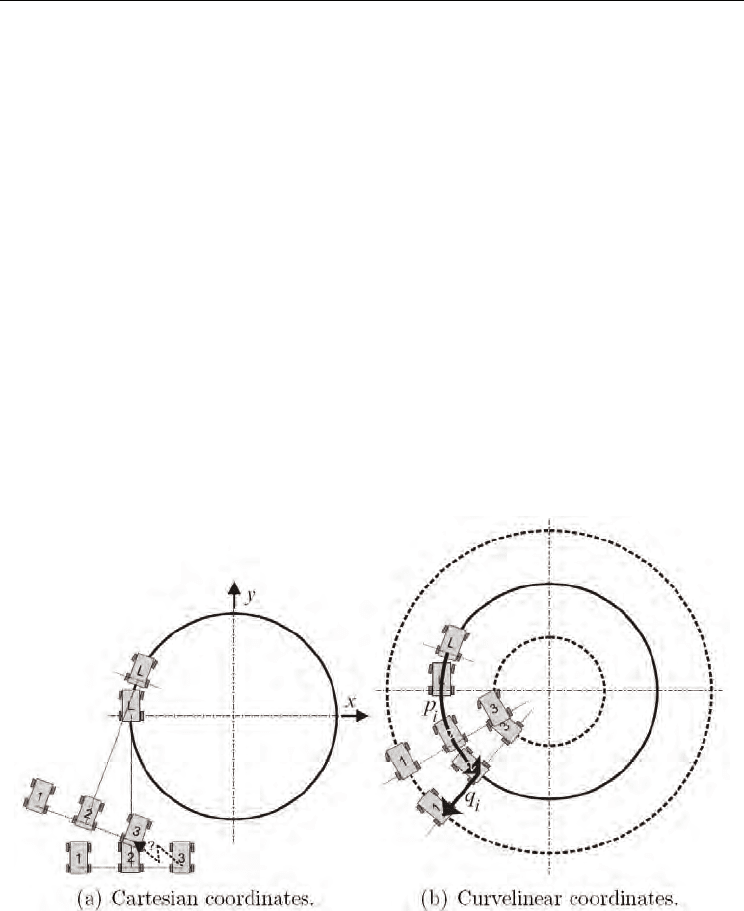
Figure 1. Two subsequence snapshots of formation driving using fixed position of followers
in Cartesian (a) and Curvelinear (b) coordinates. Solid lines denote path of leader while
paths of followers are denoted by dashed lines
Important fact of the formation driving of car-like robots that needs to be considered is
caused by impossibility to change heading of the robot on spot. Due to this feature
formations with fixed relative distance in Cartesian coordinates cannot be used, because
Particle Swarm Optimization
332
such structure makes smooth movement of the followers impossible (simple example is
shown in Fig. 1. Therefore we utilized an approach in which the followers are maintained in
relative distance to the leader in curvelinear coordinates with two axes p and q, where p
traces movement of leader and q is perpendicular to p as is demonstrated in Fig. 1b. The
positive direction of p is defined from actual position of the leader back to the origin of its
movement and the positive direction of q is defined in the left half plane in direction of
forward movement.
The shape of formation is then uniquely determined by states
)(
)(tpL
i
t
ψ
in travelled distance
p
i
(t) from actual position of the leader along its trajectory and by offset distance )(
)(tpi
i
tq
between positions of the leader and the ith follower in perpendicular direction from the
leaders' trajectory. The parameters
)(tp
i
and )(tq
i
defined for each follower i can be
varying during the mission and
)(tp
i
t
is time when the leader was at the travelled distance
)(tp
i
behind the actual position. )}(),(),({)( ttytxt
LLLL
Θ=
ψ
denotes the
configuration of a leader robot at time t , and similarly )}(),(),({ ttytx
iiii
Θ=
ψ
, with
},,1{
r
ni …∈ , denote the configuration for each of the
r
n follower robots at time t. The
Cartesian coordinates
tt
yx , for an arbitrary configuration
)(t
ψ
define the position of a
robot and
)(tΘ denotes its heading.
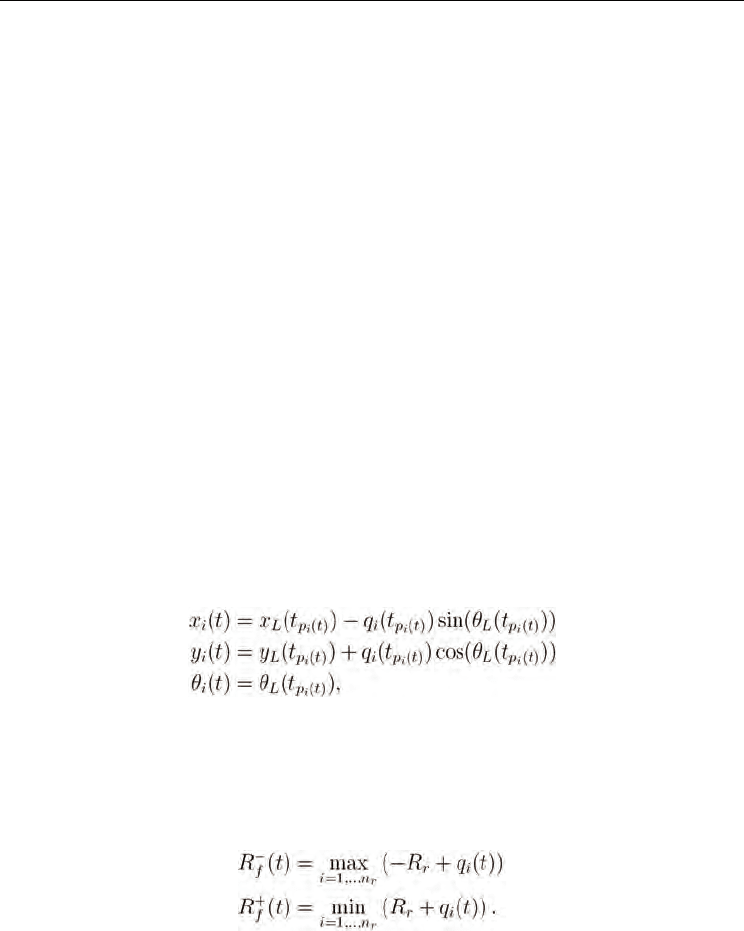
To convert the state of the followers in curvelinear coordinates to the state in rectangular
coordinates
)(t
i
ψ
the following equations can be applied:
(1)
where
)}(),(),({)(
)()()()( tpLtpLtpLtpL
iiii
ttytxt Θ=
ψ
is state of the leader in time
)(tp
i
t .
Applying the leader following approach using
q
p
,
coordinates we can easily determine
inadmissible interval of turning radius for the leader of formation as
)();( tRtR
ff
+−
, where
(2)
These restrictions must be applied due to the different turning radius of the robots on the
different position in the formation during turning. It is obvious that the robot following
inner track should go slower and with smaller turning radius than the robot further from
the centre of turning.
Path Planning for Formations of Mobile Robots using PSO Technique
333
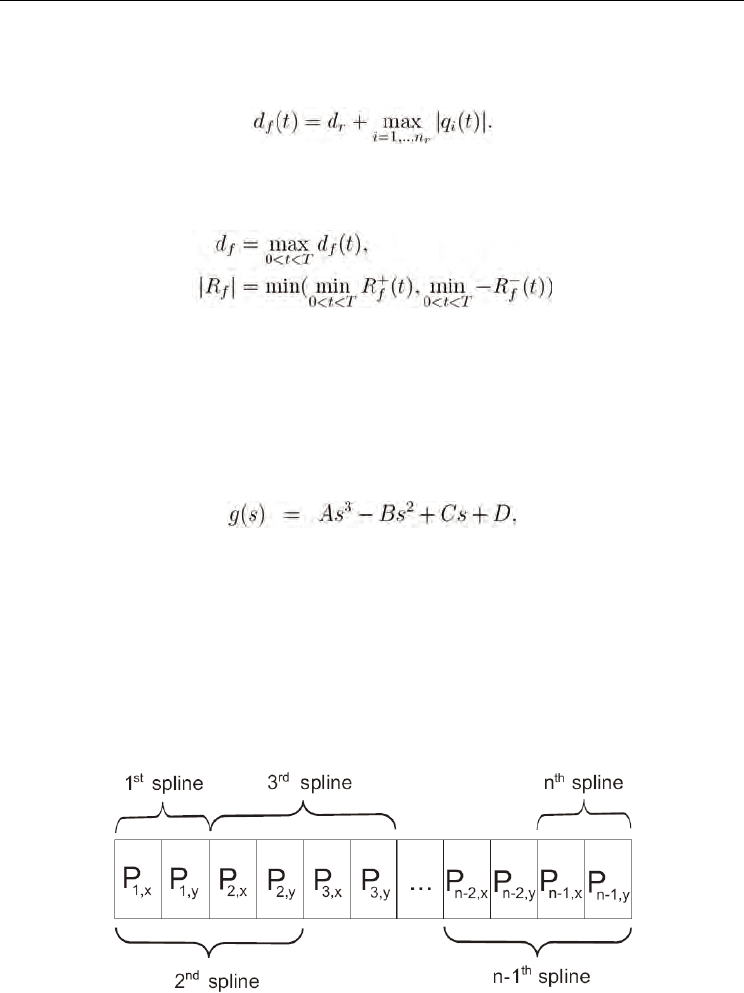
Since the leader trajectory has to be collision free for the leader but also for the followers, the
shape of the formation should be included to the avoidance behaviour. The extended
obstacle free distance for the leaders' planning can be then expressed as
(3)
Remark 2.1 Time dependence and asymmetry of the formation will be for simplification of
the algorithm description omitted and the variables will be considered as constants:
(4)
where T is total time of the formation movement.
3. Path Description and Evaluation
The path planning for the leader of formation can be realized by a search in the space of
functions. In this approach the space is reduced to a sub-space which only contains strings
of cubic splines. The mathematic notation of a cubic spline (Ye & Qu, 1999) is
(5)
where s is within the interval >< 1;0 and DCBA ,,, are constants. The whole string of
the splines is then in 2D case uniquely determined by n8 variables ( n denotes the amount
of splines in the string). The initial and desired state (position and orientation) of the
formation is specified by 8 equations, while continuity of first and second derivative in the
whole path, which is important for the formation driving as is shown in (Saska et al., 2006),
is guaranteed by
)1(6 −n equations.
Figure 2. Path representation
Particle Swarm Optimization
334
Therefore, only )1(2 −n degree of freedom define the whole path, which conforms to
positions of the points in the spline connections. The whole path representation used in our
method is shown in Fig. 2.
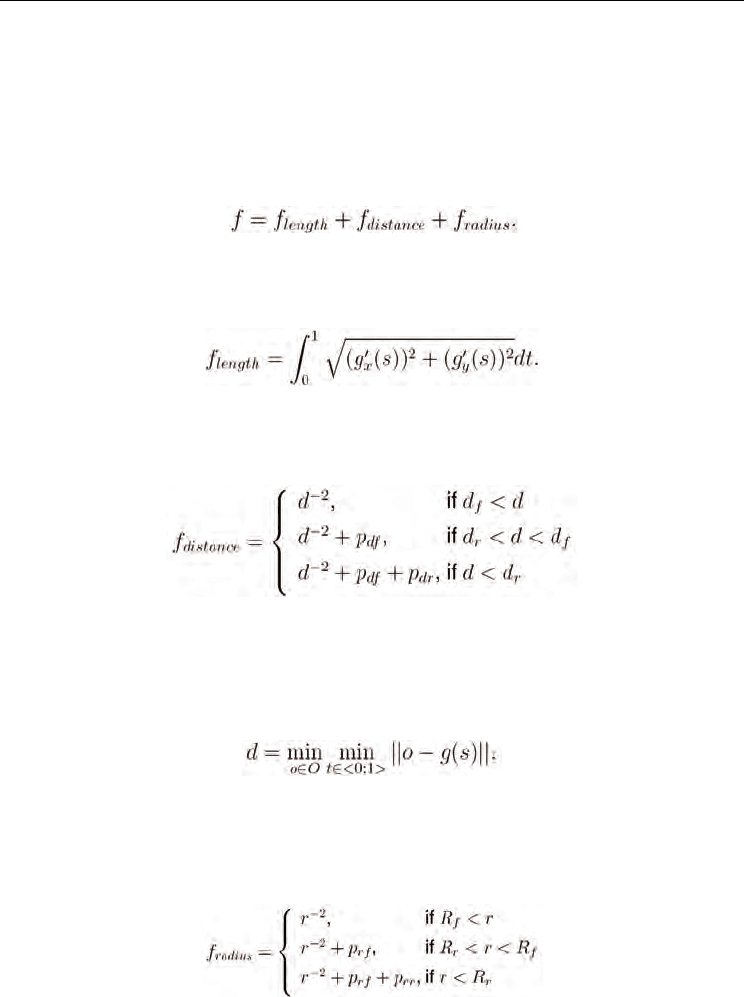
Each solution achieved by the global optimization method is evaluated by a cost function.
The global minimum of this function corresponds to a smooth and short path that is safe
(there is sufficient distance to obstacles). The cost function was in introduced method used
in the form
(6)
where part
length
f corresponds to the length of the path which in 2D case can be computed
by
(7)
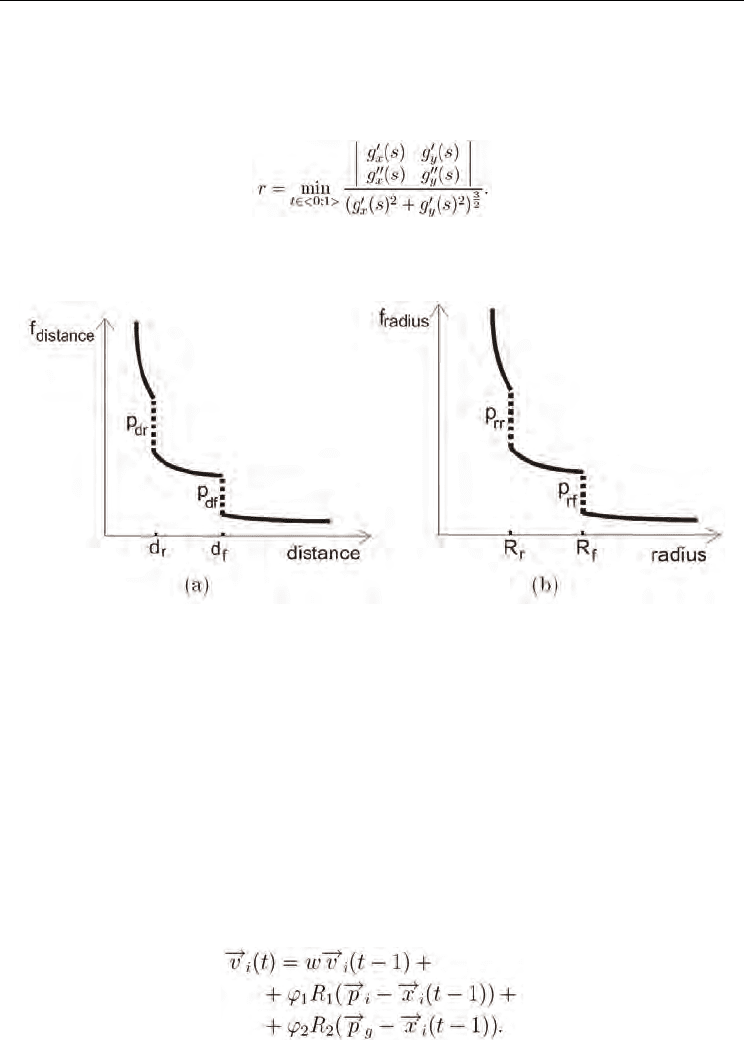
The component
cedis
f
tan
(Fig. 3a) penalizes the paths close to an obstacle and it is defined
by equation
(8)
where
df
p penalizes solutions with a collision that can be avoided by a change in the
formation and
dr
p penalizes paths with a collision of the leader. Parameter d denotes
minimal distance of the path to the closest obstacle and can be expressed as
(9)
where O is set of all obstacles in the workspace of the robots.
The part of the cost function
radius
f (Fig. 3b), that is necessary because of using the car-like
robots as well as due to presented formation driving approach, is computed according
(10)
Path Planning for Formations of Mobile Robots using PSO Technique
335
where solutions penalized only by
rf
p
can be repaired by a formation changing, while
paths with radius smaller than
r
R do not meet even requirements for a single robot.
Parameter r is minimal radius along the whole path and it is defined by
(11)
Figure 3. (a)
cedis
f
tan
, (b)
radius
f - components of cost function with denoted penalizations
4. Particle Swarm Optimization
Each particle i is represented as aD-dimensional position vector )(tx
i
and has a
corresponding instantaneous velocity vector )(tv
i
. The position vector encodes robot path
according to the schema depicted in Fig. 2. In our simple case of three splines (two spline
connections), the position vector is 4-dimensional and },,,{)(
,2,2,1,1 yxyxi
PPPPtx =
.
Furthermore, each particle remembers its individual best value of fitness function and
position
)(tp
i
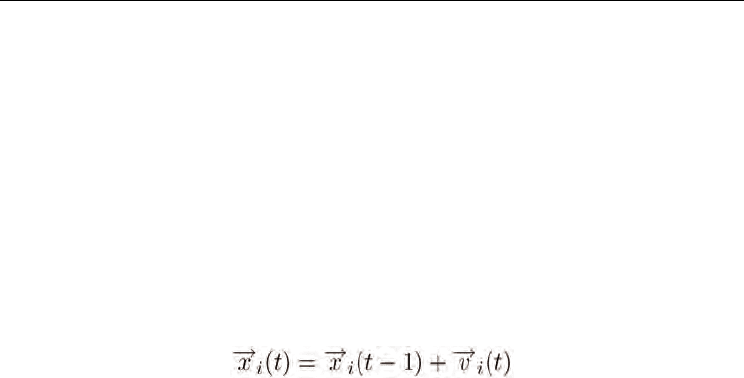
that has resulted in that value. During each iteration t, the velocity update
rule (12) is applied on each particle in the swarm:
(12)
Particle Swarm Optimization
336
The
)(tp
g
is the best position of the entire swarm and represents the social knowledge.
Another alternative can be "local best PSO", where the best position from a local
neighborhood is used instead of
)(tp
g
. We chose the "global-best PSO" because of faster
convergence that is consistent with our requirement on low time complexity. The parameter
w is called inertia weight and during all iterations decreases linearly from w
start
=0.8 to
w
end
=0. The symbols R
1
and R
2
represent the diagonal matrices with random diagonal
elements drawn from a uniform distribution between 0 and 1. The parameters
1
ϕ
and
2
ϕ
are scalar constants that weight influence of particles' own experience and the social
knowledge. The parameters were set
2
21
==
ϕ
ϕ
in compliance with literature
recommendation.
Next, the position update rule (13) is applied:
(13)
If any component of
)(tv
i
is less than
max
V− or greater than
max
V+ , the corresponding
value is replaced by
max
V− or
max
V+ , respectively. The
max
V is maximum velocity
parameter. This parameter (as well as the velocity and position vectors) is related to the
spatial dimensions of the planning area. For the area with
4000080000× pixels, some
preliminary tests showed that
3000
max
=V was suitable setting.
The update formulas (12) and (13) are applied during each iteration and the )(tp
i
and
)(tp
g
values are updated simultaneously. The algorithm stops if maximum number of
iterations is achieved.
There are some specific moments in our application. The swarm initialization is the most
important one. The particular components of the particle positions have the direct
interpretations. They are coordinates of 2-D points in the robot workspace. Therefore, it is
suitable to initialize the position vectors into a rectangle with one corner in the start position
and the opposite corner in the goal position. However, there can be some different
initialization strategies (e.g. initializing the spline connection points over the whole
workspace or on the line connecting the start and the goal position.
For our particular scenarios, we choose the initial position to be uniform random numbers
from <30000;40000>. The same initialization was used for genetic algorithm described
below.
5. Genetic Algorithm
The PSO has been compared to the most commonly used nature-inspired method - genetic
algorithm (GA). In all experiments, the same GA scheme with stochastic uniform selection,
scattered crossover and gaussian mutation was used (Vose, 1999). The particular settings
have been chosen experimentally.
Path Planning for Formations of Mobile Robots using PSO Technique
337
In the stochastic uniform selection a line is laid out in which each parent corresponds to a
section of the line of length proportional to its scaled value. The algorithm moves along the
line in equal sized steps and allocates a parent from the section it lands on. The "scattered"
crossover selects randomly the genes to be recombined. The Gaussian mutation adds a
random number drawn from Gaussian distribution with zero mean and variance linearly
decreasing from
0
5.0 r to
0
125.0 r , where
0
r is the the initial range (for our experiments,
100003000040000
0
=−=r ). Moreover, elitism has been used that copies two best
individuals from the previous generation into the new generation if a better individual was
not created in the new generation. This prevents the loss of best solution and accelerates the
convergence.
6. Implementation Details
Great number of evaluations is required by available optimization methods and therefore
computational complexity of the cost function is key factor for real time applications. The
most calculation-intensive part of the equation (6) is
cedis
f
tan
. It is done by big amount and
complexity of obstacles from which the distance needs to be computed. In the presented
method a distance grid map of the environment is pre-computed. Each cell in such matrix
denotes minimum distance of relevant place to the closest obstacle according to equation (8).
The regions outside the polygon denoting walls of the building or inside the obstacles could
be signed by infinite value, because they are infeasible for the formation movement.
Nevertheless due to the simple initialization used in this chapter all particles in the initial
swarm can be intersecting an obstacle and therefore evaluated by the same value
∞=
cedis
f
tan
.
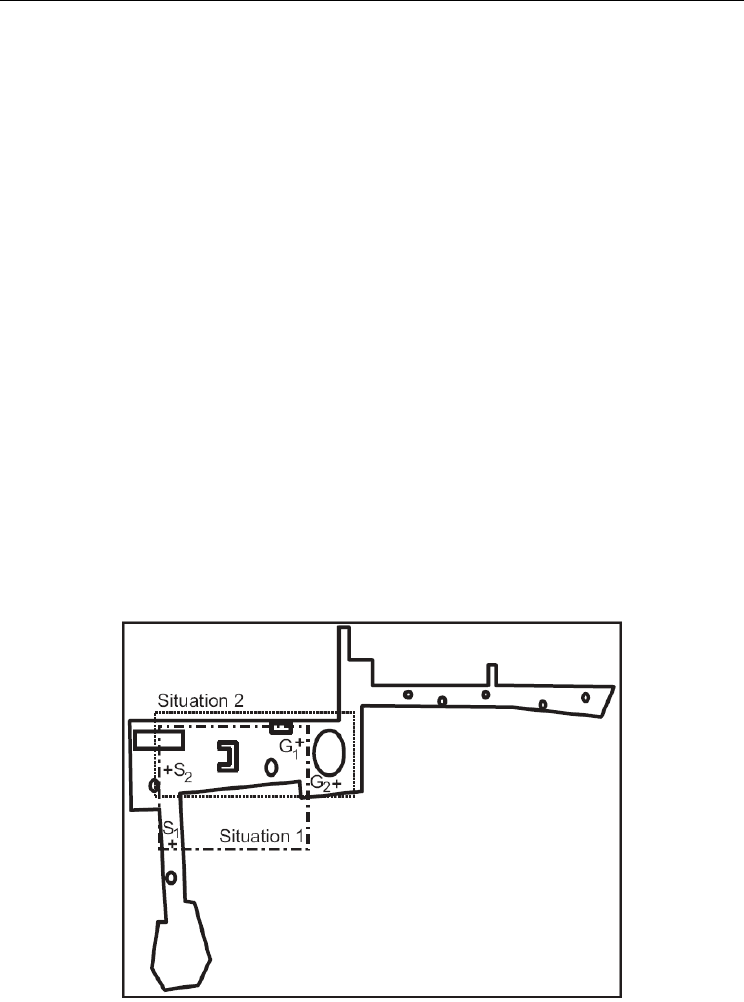
Figure 4. Map of utilized workspace with denoted zoomed areas of the scenarios: Situation 1
and Situation 2
Particle Swarm Optimization
338
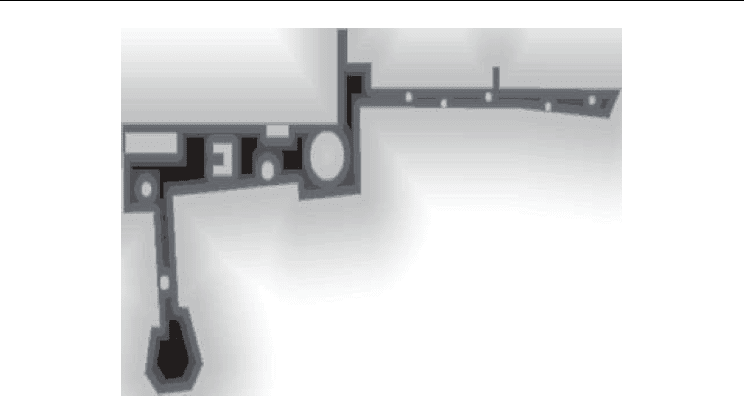
Figure 5. Distance map used for computing of the cost function. Black color denotes the
regions where
0
tan
=
cedis
f and white color denotes the region with maximum values of
cedis
f
tan
In such case even the smartest optimization method degrades to a random search. A
solution could be to artificially add a rising of
cedis
f
tan
outside the polygon from the walls
of building (similarly inside the circular obstacles the increase will be from the borders to
the center of obstacle) which enables the optimization method to reach the feasible space.
Big advantage of such grid-map approach is possibility to use obstacles with arbitrarily
complicated shape, that is usually done be autonomous mapping technique. An occupancy
grid that is obtained by a range finder can be used as well. An example of the robot
workspace with obstacles that was used for experiments is depicted on the Fig. 4 and the
appropriate distance map is drawn in the Fig. 5.
7. Experiments
This section summarizes various types of experiments in static environment for two scenarios
(Situation 1 and Situation 2) depicted in Fig. 4. First, the results obtained by PSO are discussed
and further, the PSO is compared to genetic algorithm. The presented tests have been realized
in the environment of computer science building in Wuerzburg (map is depicted in Fig. 4)
which is frequently used for hardware experiments of indoor mobile robots.
7.1 PSO Results
Parameters of the PSO method were adjusted in agreement with (Saska et al., 2006), where
the algorithm was used in similar application. As the test scenario were chosen situations
with several local extremes corresponding to feasible as well as unfeasible paths for the
leader. In Fig. 6 are presented two solutions of the Situation 1 designed by PSO method. The
path evaluated by cost f=13.02 is close to the global optimal solution and is feasible for the
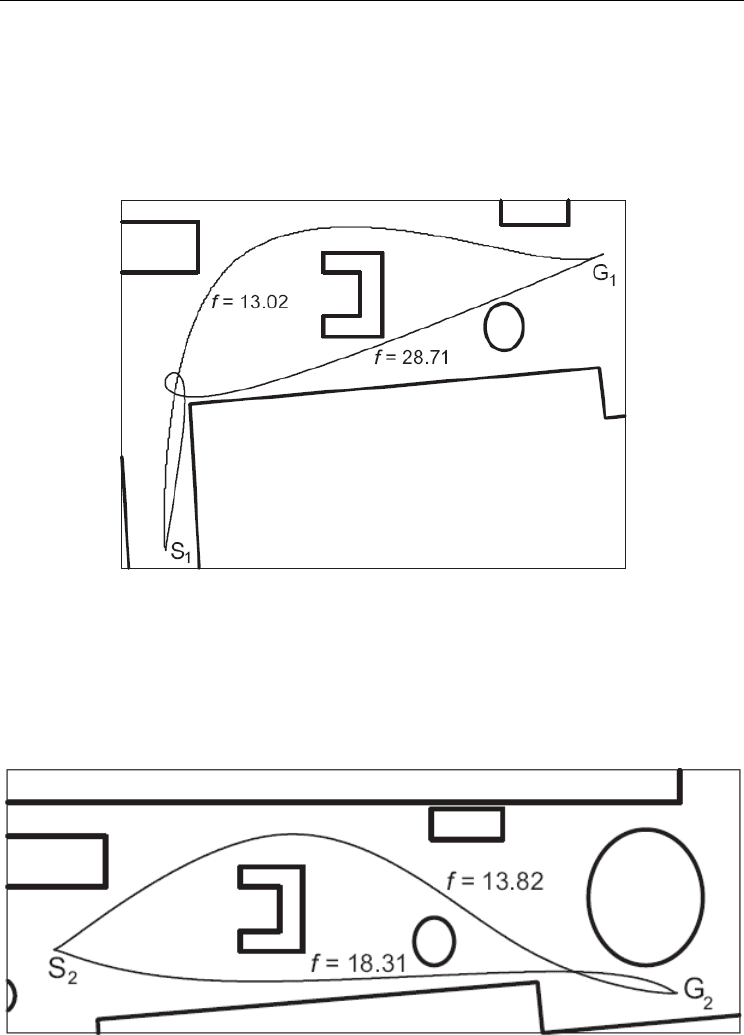
Path Planning for Formations of Mobile Robots using PSO Technique
339
formation maintaining fixed shape. Contrariwise the second path (f=28.71) is close to one of
the local optimal solutions and it is feasible only for a single robot. For the formation driving
it means that the shape of the formation must be temporarily changed during the passage
around the obstacles as well as in the loop replacing sharp unfeasible curve next to the
corner of the room. We should note that the loop was created automatically by the path
planning method. Such manoeuvres could be useful e.g. in crossroads of narrow corridors
where straightforward movement is impossible due to the restriction of turning radius.
Figure 6. Two different solutions of Situation 1 obtained by PSO
Results of the second scenario, Situation 2, are shown in Fig. 7 where the solution with
f=13.82 is feasible for the complete formation whereas the second solution (f=18.31) requires
small changes of the positions of outer followers. The second path is shorter than the first
solution, which is close to the global minimum of the cost function (6). Therefore the second
solution could be preferred in the application where the shape of formation can be easily
modified.
Figure 7. Two different solutions of Situation 2 obtained by PSO
Particle Swarm Optimization
340
7.2 Comparison with GA
The two scenarios described above were used for the comparison of PSO and GA. For both
methods, the swarm (population) size was 30 and the number of iterations (generations)
was 300. Such an excessive number of cost function evaluations enables better evaluation of
results and the chance of the algorithm to converge into an optimum.
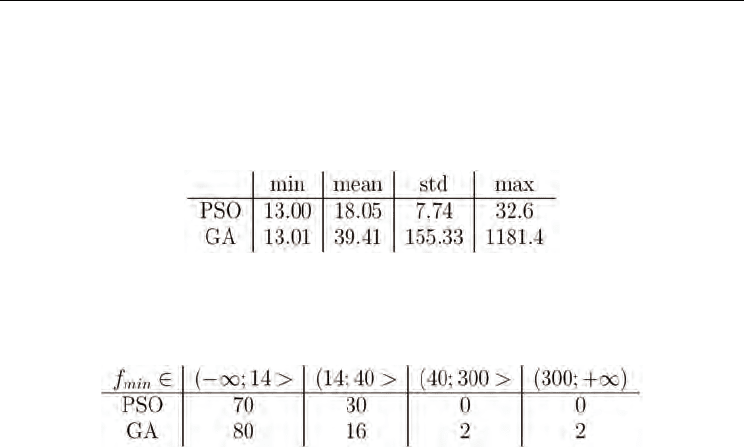
Table 1. The minimum, mean, standard deviation and maximum of the set of minimum cost
values found by particular runs for Situation 1. Set of results from 100 repeated runs was
used
Table 2. Situation 1 - absolute occurrences of different values of final
min
f in the set of 100
results of independent runs
Because of statistical purposes, 100 runs of each method (with different random
initialization) has been launched. The main quality criterion used is the minimum cost
function
min
f found at a particular moment. First, we took final values of the minimum
cost value found in particular runs. Basic statistical properties computed from the 100 runs
are depicted in Table 1. Although the mean best PSO solutions is lower than the mean best
GA solution, the difference is not statistically significant (two-sample t-test with significance
level 0.05 was used to investigate the significance of difference between the methods).
However, high standard deviation and high maximum (worst result) obtained for GA
results shows that in some runs, the genetic algorithm found extremely poor result that do
not belong to any of the two optima shown in Fig. 6. This is especially evident from the
Table 2, where the histogram of best solutions is depicted. The second column corresponds
to the global minimum of cost function that lies under the value f=14. The numbers are
absolute occurrences (of totally 100 runs) of the final minimum fitness values that are lower
than 14. The third column describes hits to the local optima (that lies somewhere around 28).
The other two columns correspond to quite poor (probably unusable) solutions. One can
observe that for the Situation 1 the GA finds these bad solutions in 4 of totally 100 cases. On
the other hand the PSO always finds at least the local minimum and is more susceptible to
getting stuck in the local optimum. This fact is probably a tax on the faster convergence. The
higher convergence rate of PSO can be observed from Fig. 8b, where the mean temporal
evolution of
min
f is depicted. One can see that the curve for PSO decreases and reaches
minimum much more rapidly than the curve measured for GA.
The results for Situation 2 are similar. This time, the mean result for GA is significantly
worse (Table 3). In histogram (Table 4 and Fig. 9a), one can observe that GA again was