Lazinica A. (ed.) Particle Swarm Optimization
Подождите немного. Документ загружается.

Swarm Intelligence Applications in Electric Machines
31
3.2 Definition of Operating Strategies
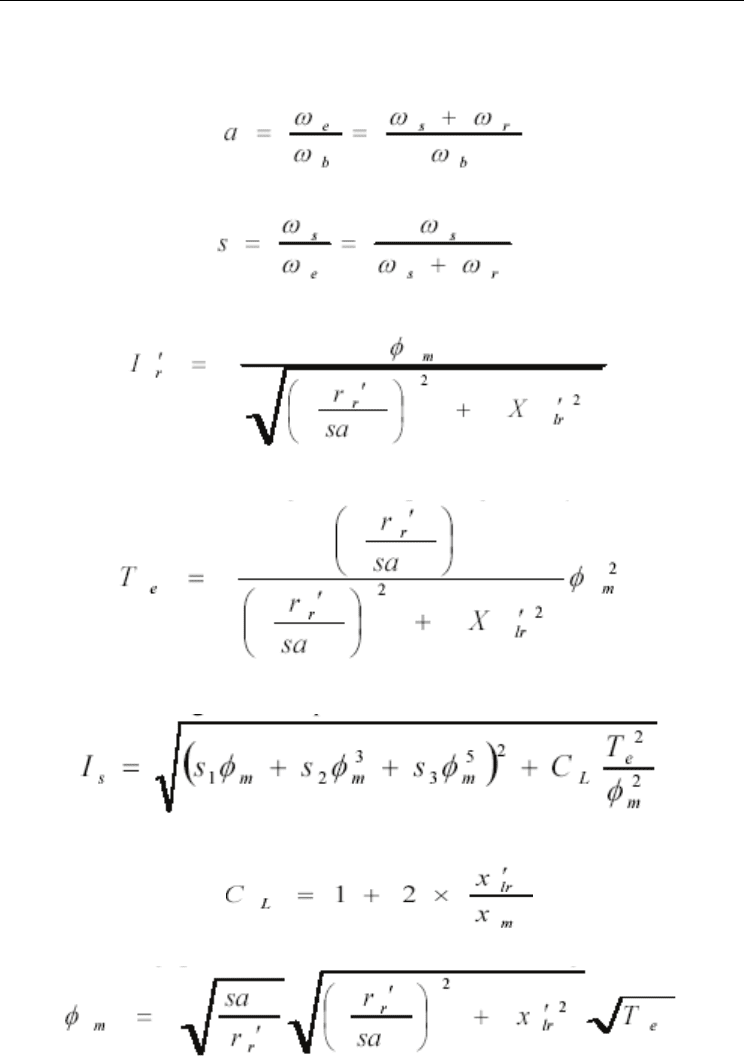
The following definitions are useful in subsequent analyses. Referring to the analysis of the
induction motor presented in [3], the per-unit frequency is
(34)
The slip is defined by
(35)
The rotor current is given by
(36)
The electromagnetic torque is given by
(37)
The stator current is related to the air gap flux and the electromagnetic torque as:
(38)
Where
The air gap flux is related to the electromagnetic torque as:
(
39)
Particle Swarm Optimization
32
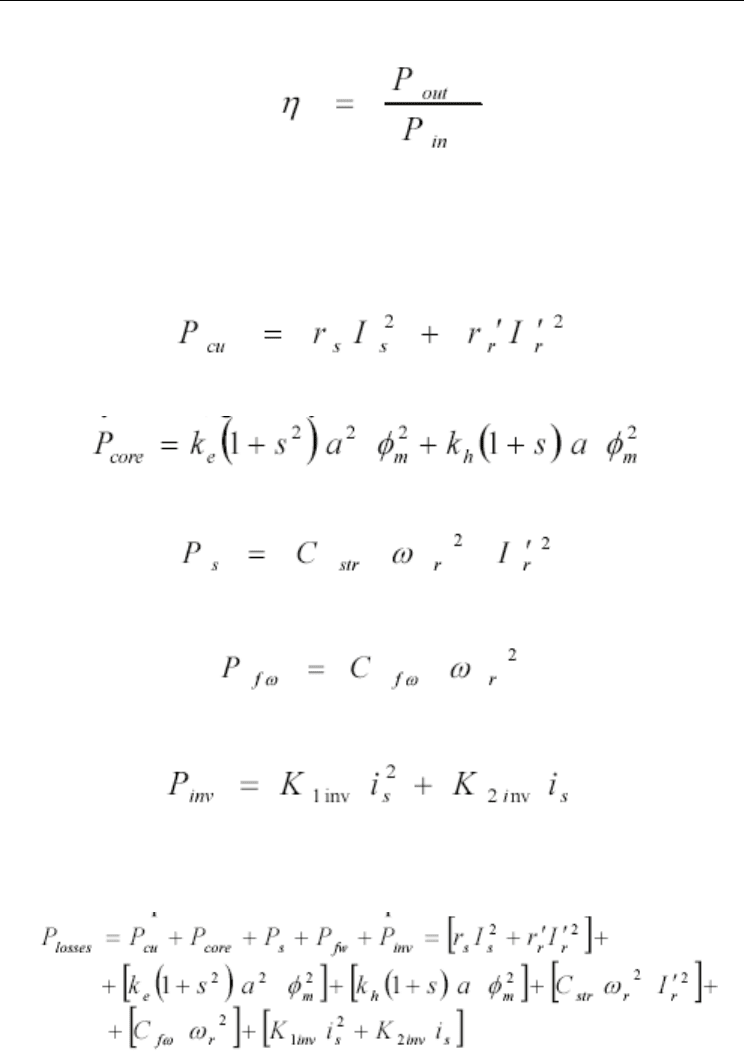
The efficiency is defined as the output power divided by the electric power supplied to the
stator (inverter losses are included):
(40)
3.1.1 Maximum Efficiency Strategy
In MES (Maximum Efficiency Strategy), the slip frequency is adjusted so that the efficiency
of the induction motor drive system is maximized.
The induction motor losses are the following:
1. Copper losses: these are due to flow of the electric current through the stator and rotor
windings and are given by:
(41)
2. Iron losses: these are the losses due to eddy current and hysteresis, given by
(42)
3. Stray losses: these arise on the copper and iron of the motor and are given by:
(43)
4. Mechanical losses
: these are due to the friction of the machine rotor with the bearings
and are given by
(44)
5. Inverter losses : The approximate inverter loss as a function of stator current is given
by:
(45)
Where: K
1inv
, K
2inv
are coefficients determined by the electrical characteristics of a switching
element where: K
1inv
= 3.1307e-005, K
2inv
=0.0250.
The total power losses are expressed as:
(46)
Swarm Intelligence Applications in Electric Machines
33
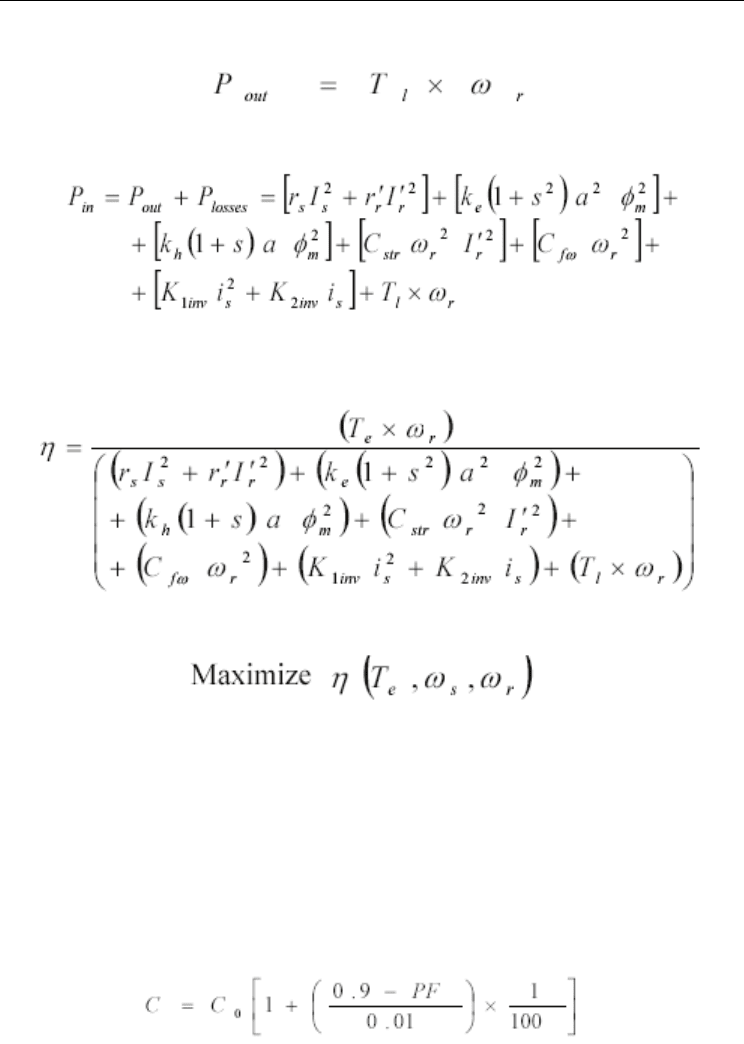
The output power is given by:
(47)
The input power is given by:
(48)
The efficiency is expressed as:
(49)
The efficiency maximization of the induction motor problem can be formulated as follows
:
(50)
The maximization should observe the fact that the amplitude of the stator current and flux
cannot exceed their specified maximum point.
3.2.2 Minimum Operating Cost Strategy
In Minimum Operating cost Strategy (MOCS), the slip frequency is adjusted so that the
operating cost of the induction motor is minimized. The operating cost of the induction
machine should be calculated over the whole life cycle of the machine. That calculation can
be made to evaluate the cost of the consumed electrical energy. The value of average energy
cost considering the power factor penalties can be determined by the following stages:
1. If 0 ≤ PF < 0.7
(51)
Particle Swarm Optimization
34
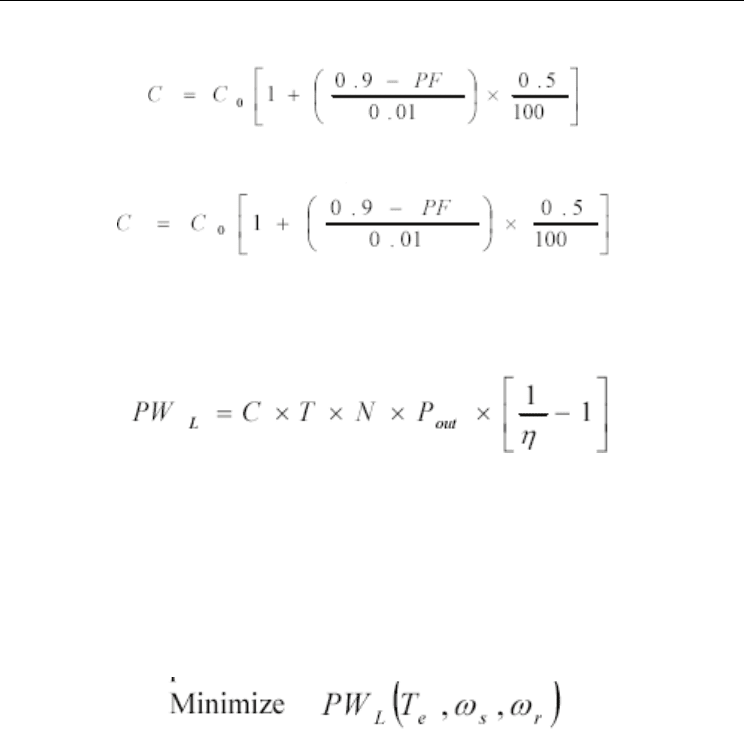
2. If 0.7 ≤ PF ≤ 0.92, If PF ≥ 0.9, PF = 0.9
(52)
3. If 0.9 ≤ PF ≤ 1, If 0.95 ≤ PF ≤ 1, PF = 0.95
(53)
If the average energy cost C is calculated, it can be used to establish the present value of
losses. The total cost of the machine is the sum of its initial cost plus the present worth value
of losses and maintenance costs.
(54)
Where:
PW
L
= present worth value of losses
C
0
= energy cost (L.E/KwH), L.E is the Egyptian Pound
C = modified energy cost (L.E/KwH)
T = running time per year (Hrs / year)
N = evaluation life (years)
P
out
= the output power (Kwatt)
η = the efficiency
The operating cost minimization of the induction motor problem can be formulated as follows:
(55)
The optimization in each case should observe the fact that the amplitude of the stator
current and flux cannot exceed their specified maximum.
3.3 Simulation Results
The simulation is carried out on a three-phase, 380 V, 1-HP, 50 Hz, and 4-pole, squirrel cage
induction motor. The motor parameters are R
s
=0.0598, X
ls
=0.0364, X
m
=0.8564, X
lr
=0.0546,
R
r
=0.0403, K
e
=0.0380, K
h
=0.0380, C
str
=0.0150, Cfw=0.0093, S1=1.07, S
2
=-0.69, S
3
=0.77. For
cost analysis, the following values were assumed: C
0
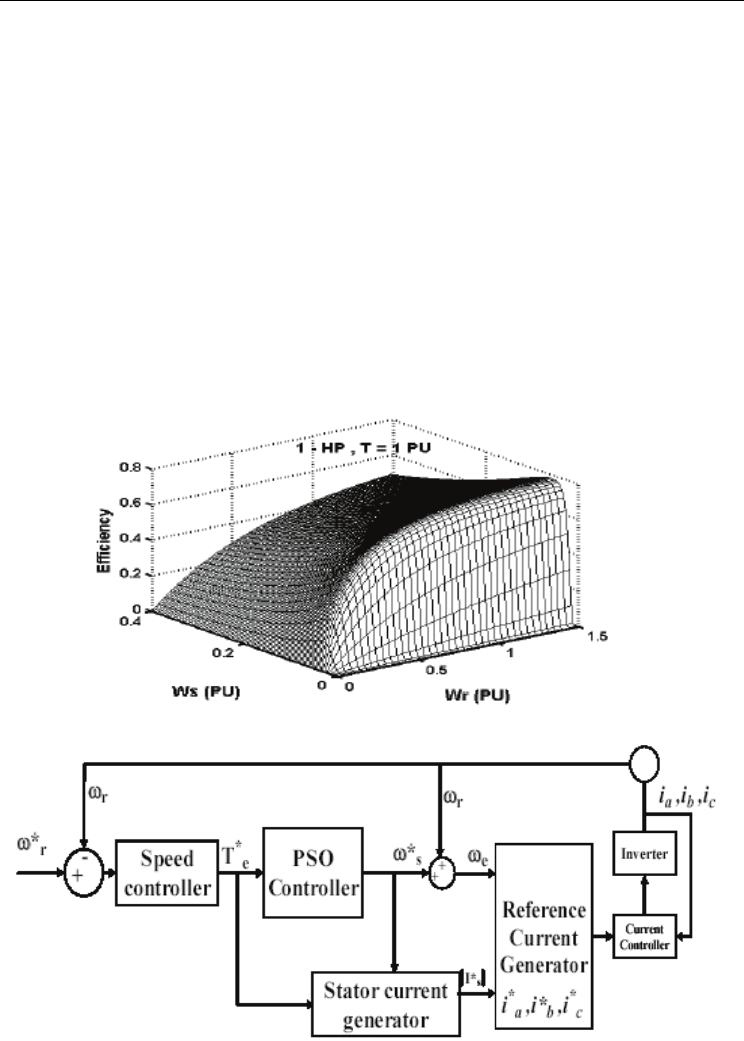
=0.05, N=15, T=8000. Figure 12 shows
the efficiency variation with respect to the rotor and slip speed at various levels of load
torque. At certain load torque and rotor speed, a certain value of slip frequency at which
the maximum efficiency occurs is optimal. The task of PSO controller is to find that value of
slip at which the maximum efficiency occurs. At certain load torque and rotor speed, the
PSO controller determines the slip frequency ω
s
at which the maximum efficiency and
minimum operating cost occur. The block diagram of the optimization process based on
Swarm Intelligence Applications in Electric Machines
35
PSO is shown in fig.13. In the proposed controller, the PSO algorithm receives the rotor
speed, load torque, and the fitness function (efficiency equation).
The PSO determines the slip frequency at which the maximum efficiency or minimum
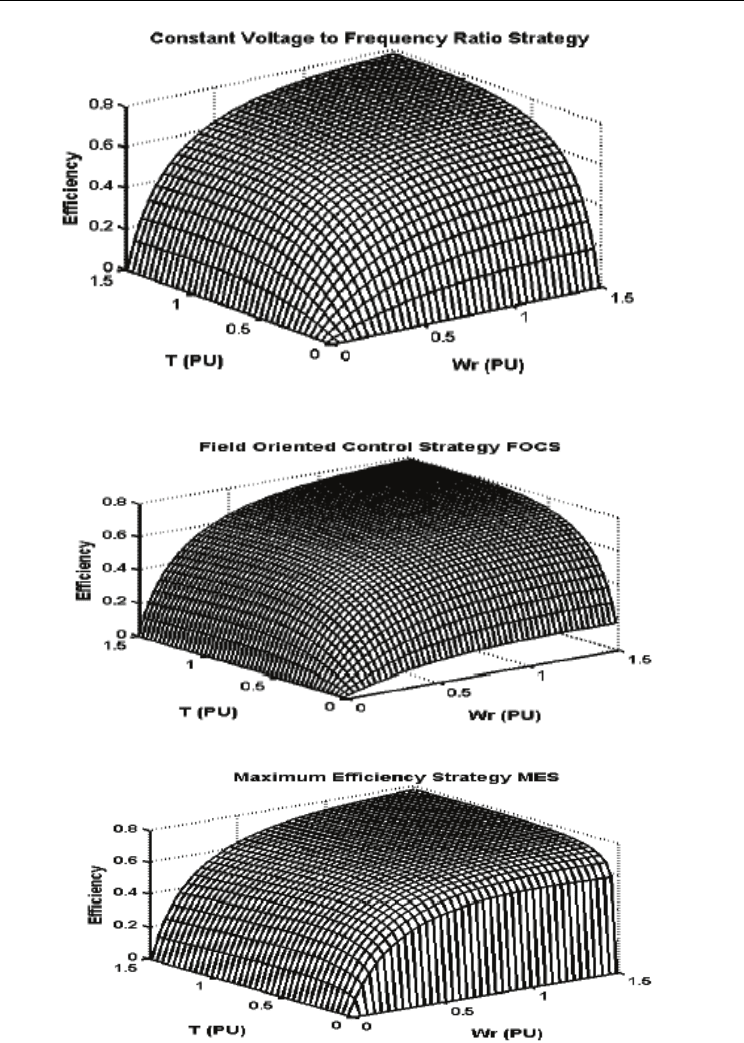
operating cost occurs at that rotor speed and load torque. Figures (14) and (15) show the
efficiency of the machine as a function of the load torque and rotor speed under constant
voltage to frequency ratio strategy and field oriented control strategy. From these figures it
is obvious that, the efficiency decreases substantially when either the torque or rotor speed
is small. On the other hand, fig. 16 shows the efficiency versus the load torque and rotor
speed using the proposed technique (MES). This figure shows a great improving in
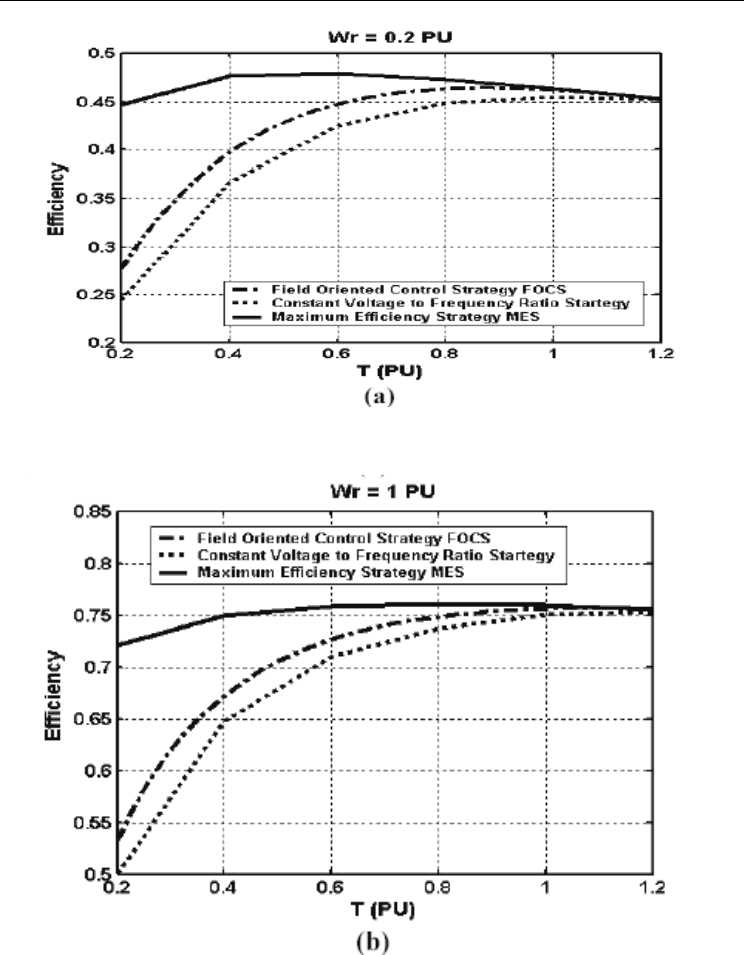
efficiency especially at light loads and small rotor speed. To observe the improvements in
efficiency using the suggested PSO controller, fig. 17 shows the efficiency of the selected
machine for all operating conditions using conventional methods (constant voltage to
frequency ratio, field oriented control strategy) and using the proposed PSO controller at
different rotor speed levels, W
r
= 0.2 PU, and W
r
= 1 PU respectively. This figure shows that
a considerable energy saving is achieved in comparison with the conventional method (field
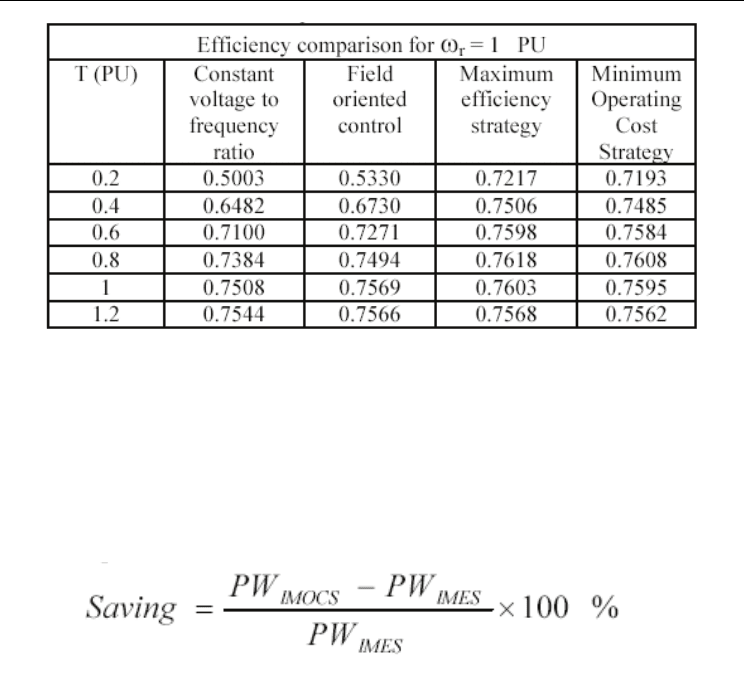
oriented control strategy and constant voltage to frequency ratio). Table (1) shows the
efficiency comparison using few examples of operating points.
Figure 12. Efficiency versus rotor speed and slip speed at load torque T
L
= 1 PU
Figure 13. The proposed drive system based on PSO
Particle Swarm Optimization
36
Figure 14. Efficiency versus rotor speed and load torque under constant voltage to
frequency ratio strategy
Figure 15. Efficiency versus rotor speed and load torque under field Oriented control strategy
Figure 8. Efficiency versus rotor speed and load torque using the Proposed PSO controller (MES)
Swarm Intelligence Applications in Electric Machines
37
Table 1. Some examples of efficiency comparison under different Load torque levels
and W
r
= 1 PU
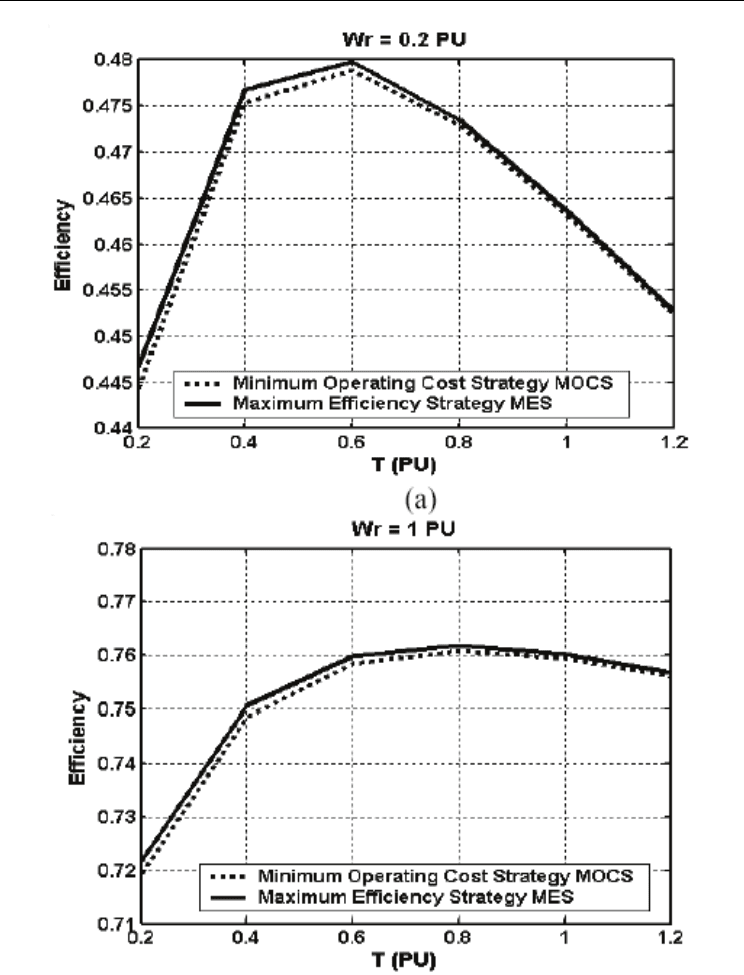
Figure (10) compares the efficiency of the induction motor drive system under the
maximum efficiency strategy with the minimum operating cost strategy at W
r
= 0.2 PU and
W
r
= 1 PU, respectively. It is obvious from the figure that the efficiency is almost the same
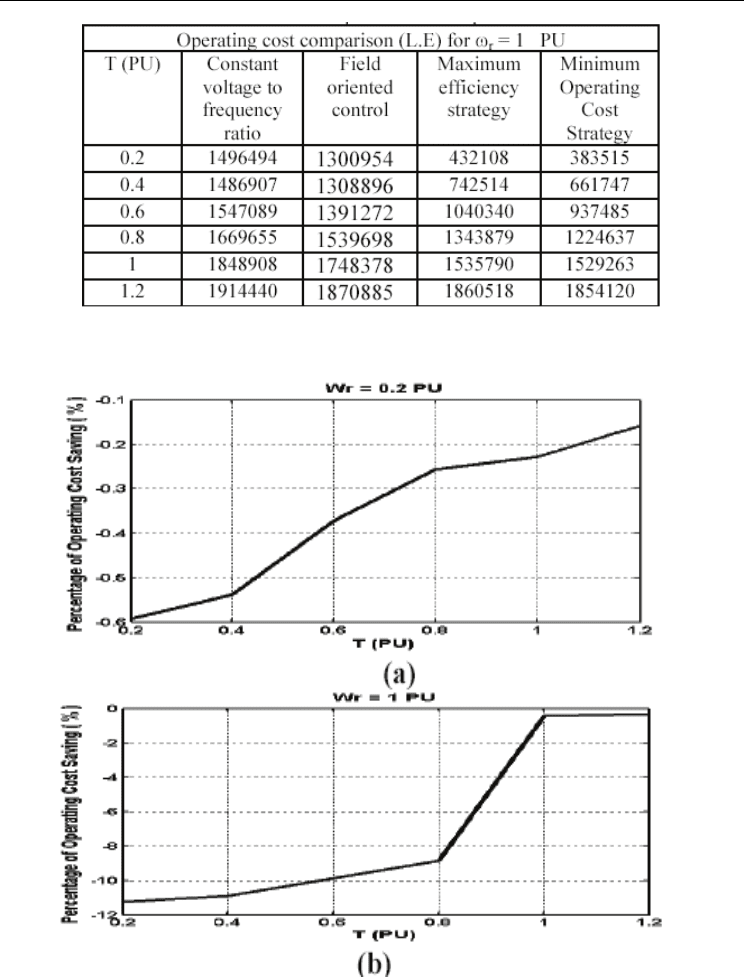
for both strategies for all operating points. On the other hand, fig. 11 shows the percentage
of the operating cost saving for the two strategies for W
r
= 0.2 and W
r
= 1 PU respectively.
The percentage of the operating cost saving is calculated according to the following
equation:
(56)
Where: PW
lMES
is the present worth value of losses under MES, and PW
lMOCS
is the present
worth value of losses under MOCS. It is obvious from fig (11) that the saving has a
noticeable value especially at light loads and rated speed that can as high as 11.2 %. It is
clear that the PWL using the minimum operating cost strategy is less than the PWL using
the maximum efficiency strategy. This difference in operating cost is shown in table (2). The
reason for that difference is due to the difference in their power factor values. The difference
in power factor values is shown in fig.12.
Particle Swarm Optimization
38
Figure 9. The efficiency of the induction motor using the maximum efficiency strategy
compared with the efficiency using the conventional methods (field oriented control
strategy and constant voltage to frequency ratio) for different rotor speed levels.
(a) W
r
= 0.2 PU, (b) W
r
= 1 PU
Swarm Intelligence Applications in Electric Machines
39
Figure 10. the efficiency of the induction motor using the maximum efficiency strategy
compared with the efficiency using minimum operating cost strategy for different rotor
speed levels. (a) Wr = 0.2 PU, (b) Wr= 1 PU
Particle Swarm Optimization
40
Table 2. Some examples of operating cost comparison under different load torque levels and
Wr = 1 PU
Figure 11. the PW
L
using maximum efficiency strategy compared with the PWL using the
minimum operating cost strategy for different rotor speed levels.
(a) Wr = 0.2 PU, (b) Wr= 1 PU