Li S.Z., Jain A.K. (eds.) Encyclopedia of Biometrics
Подождите немного. Документ загружается.

Ridge Enhancement Filtering
Ridge enhancement filtering is another fingerprint-
specific image processing technique. In the 1960s
and 1970s, most filtering techniques were labeled con-
textual. They used filtering masks similar to the ones
used to estimate orientation, either fixed size or pre-
determined variable frequencies. However, it was diffi-
cult for these techniques to flexibly adapt to very
narrow or very wide ridges and spacing [6–8]. In the
1980s, a more so phisticated method based on the two-
dimensional Fourier transform was proposed [9, 10].
In the 1990s and 2000s, Gabor filtering and wavelet
filtering were introduced [2, 5, 13].
Conceptually, ridge enhancement filtering aims to
‘‘enhance’’ ridges by generating stripe patterns from
scratch using the previously estimated orientation
and frequency. Strong enhancement is effective for
low quality images but at the risk of destroying the
original ridge structure. The strength of filtering thus
needs to be controlled adapti vely and depends on the
field in which it is used: law enforcement and non-law
enforcement. In the former case, the original ridge
structure needs to be preserved as much as possible
in order to improve compatibility with the examiners’
definition of minutiae since it still relies on manual
processing such as latent minutia coding. This is im-
portant to improve latent-print matching accuracy,
especially for fragmental latent prints with few minu-
tiae. In order to match such latent prints, even unstable
minutiae need to be incorporated to increase chances
of hit. On the contrary, in the latter case, which is fully
automatic, neither the original ridge structure has to
be preserved nor is compatibility with the examiners’
definition critical.
With respect to minutia preserving ability, there
are two types of minutiae to be considered: stable min-
utiae and unstable minutiae. The stable minutia is a
minutia that is topologically isolated from other minu-
tiae with no chance of interfering with other minutiae.
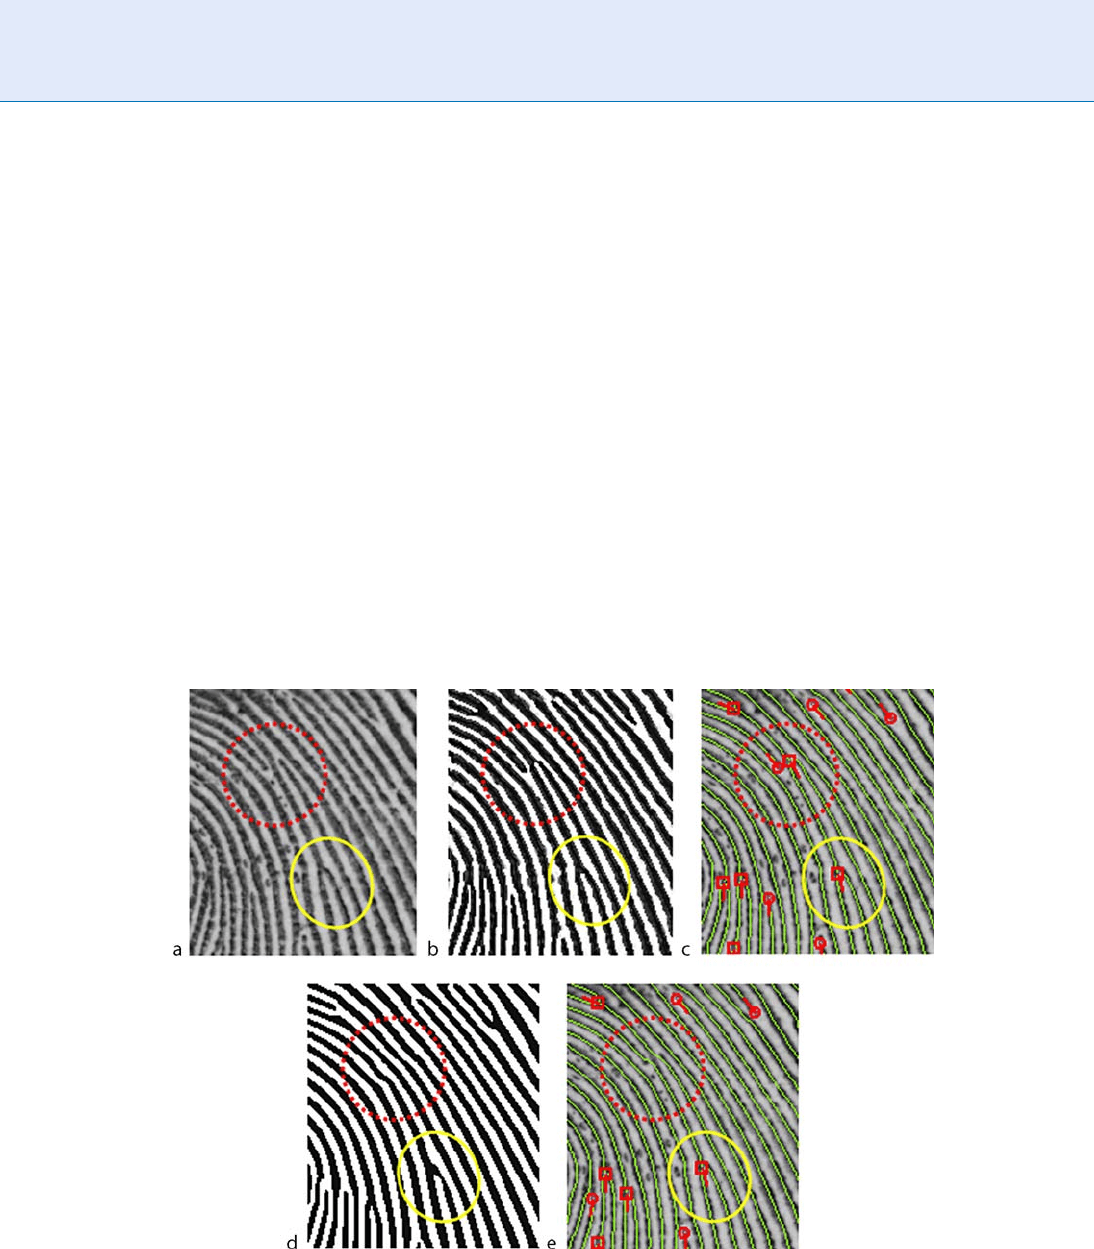
Fingerprint Image Enhancement. Figure 6 Unstable and Stable Minutiae (NIST DB#27 076T). Notes: (b) The ridge image
(a) was enhanced by one of the popular algorithms [9] with a relatively weak enhancement parameter. (c) A skeleton
image and minutiae were automatically extracted from the image in (b). (d) The image in (b) was enhanced by one of the
popular algorithms [9] with a relatively strong enhancement parameter. (e) A skeleton image and minutiae were
automatically extracted from the image in (d).
480
F
Fingerprint Image Enhancement
The unstable minutia is a minutia that may either re-
main unchanged or completely disappear depending on
the physical conditions of its surroundings. Crossover
minutiae are a typical example of unstable minutiae. In
Fig. 6(a ) a stab le minu tia is presented in the yellow
circle and an unstable minutia in the red circle. Notice
how the different levels of enhancement affect the ex-
traction results. If the strength of the ridge enhancement
filter is relatively mild, the crossover ridge structure and
the corresponding minutiae are maintained (Fig. 6(c) ).
On the other hand, the crossover minutiae completely
disapp ear w hen a strong filter is applied (Fig . 6(e)).
Despite this drawback, however, it is still beneficial to
adopt strong filtering since it is capable of consistently
extracting stable minutiae even from poor quality
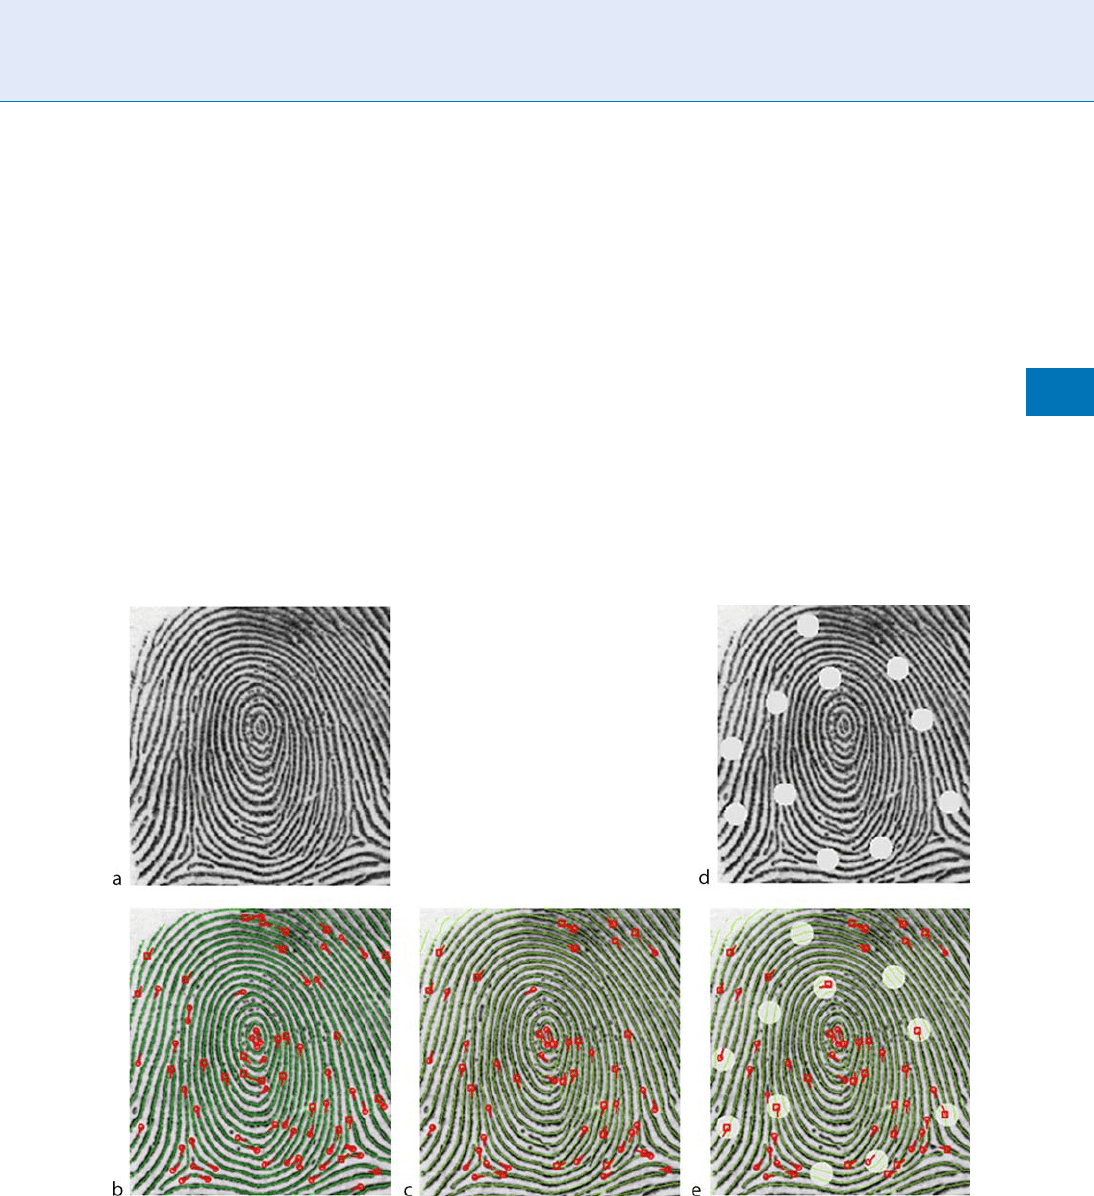
images as illustrated by the following example. The
image in Fig. 7(b) represents an ideal , man ually edited
minutia e of the image Fig . 7(a) , containing a total of
76 minutiae, 55 of which are stable and 21 are unstable.
The image in Fig . 7(d) is an ar tificially produced poor
quality image by covering it with several circular
‘‘patches.’’ When a strong filter is applied to the images
in Figs. 7(a) and (d) , most of the 55 stable minutia e are
correctly extr acted as shown in Figs. 7(c) and (e) ,
respectively. It should also be noted that this method
is especially effective when the area of the overlapping
region between the two images is large enough in
which a sufficient number of stable minutiae exist.
Thus, filtering strength depends on the operational
strategy, requirements, and target image characteristics.
Once fingerprint ridges are suitably enhanced,
▶ fingerprint binarization is then conducted to pro-
duce a black and white image and, finally,
▶ fingerprint
skeletonization to generate a skeleton image.
Fingerprint Image Enhancement. Figure 7 Effects of Strong Ridge Enhancement Filter (NIST DB#27 076T).
Notes: (b) The ideal skeleton image was manually generated so that skeleton curves correctly coincided with the
original ridges. Then, minutiae were extracted from the ideal skeleton image. (c) The ridge image in (a) was
automatically enhanced by one of the popular algorithms [9] with a relatively strong enhancement parameter. Then, a
skeleton image and minutiae were automatically extracted from that enhanced ridge image. (e) The ridge image in
(d) was automatically enhanced by one of the popular algorithms [9] with a relatively strong enhancement parameter.
Then, a skeleton image and minutiae were automatically extracted from that enhanced ridge image.
Fingerprint Image Enhancement
F
481
F

Summary and Future Improve ment
Fingerprint image enhancement is a very effective tool
for improving ridge clarity. Undoubtedly, improve-
ment in matching accuracy reported in the past two
to three decades can be attributed to innovation in
image enhancement techniques. Unfortunately, it is
far from true if considered in terms of how close the
automated fingerprint recognition got to the ability of
human perception. This is because the current techni-
ques that heavily rely on ridge orientation and fre-
quency (and whatever informati on one can think of)
are not capable of perceiving a fingerprint image as a
fingerprint but just a collection of gray-scale pixels,
and the circumstance has not changed in the course
of over 40 years of research. This may change in the
future if a leap forward in the computational neurosci-
ence reveals the mechanism of human pattern recogni-
tion, but for the time being, a goal pro tempore is
probably to find a way to extract information from
unmodified gray images to avoid side effects of the
image enhancement as far as possible.
Acknowledgments
The sample images are courtesy of the NIST and the
University of Bologna [14, 15]. The author would
like to thank Amane Yoshida for proofreading and
rewriting in English. For more information on the
technical details, refer to ‘Fingerprint Analysis and
Representation’ in Handbook of Fin gerprint Recognition
by Maltoni Et al. [2].)
Related Entries
▶ Fingerprint Classification
▶ Fingerprint Features
▶ Fingerprint Image Quality
References
1. ANSI/NIST-ITL 1-2007 Fingerprint Standard – http://finger
print.nist.gov/standard/index.html
2. Maltoni, D. et al.: Handbook of fingerprint recognition. Springer
(2003)
3. Xia, X., O’Gorman, L.: Innovation in fingerprint capture
devices. Pattern Recognit. 36, 361–369 (2003)
4. Hara, M.: Image Density Conversion Method, Image Enhan-
cement Processor, and Program Thereof (USP 20080050030A1
– Pending)
5. Hong, L et al.: Fingerprint image enhancement: Algorithm
and performance evaluation. IEEE Trans. Pattern Anal. Mach.
Intell. 20, 777–789(1998)
6. Stock, R.: Automatic fingerprint reading. In: The 1972
Carnahan Conference, on Electronic Crime Countermeasures,
April 19–21, 1972
7. Asai, K. et al.: Automatic fingerprint identification. SPIE
vol. 182, Imaging Application for Automated Industrial Inspec-
tion & Assembly (1979).
8. Capello, R. et al.: Method and apparatus for contextual data
enhancement (USP 4,876,726)
9. Kamei, T. et al.: Image filter design for fingerprint enhancement.
In:Proceedings International Symposium on Computer Vision,
109–114 (1995).
10. Chikkerur, S. et al.: Fingerprint enhancement using STFT
analysis. Pattern Recognit. 40, 198–211 (2007), 109–114 (1995)
11. Funada, et al.: System and method for processing fingerprint/
palmprint image (USP 7,027,626)
12. Hara, M.: System for recognizing fingerprint image, method
and program for the same (USP 20070036401A1 – Pending)
13. Paul, A. et al.: A study of image enhancement techniques for
fingerprint identification. Proceedings of the IEEE Interna-
tional Conference on Video and Signal Based Surveillance
(AVSS’06) (2006)
14. NIST (National Institute of Standard and Technologies) Special
Database #27 – http://www.nist.gov/srd/nistsd27.htm
15. FVC2002 Second Fingerprint Verification Competition Database
– http://bias.csr.unibo.it/fvc2002/
Fingerprint Image Quality
ELHAM TABASSI,PATRICK GROT HE R
National Institute of Standards and Technology,
MD, USA
Synonym
Expected performance or utility of fingerprint image in
an automated comparison environment
Definition
The intrinsic characteristic of a biometric signal may
be used to determine its suitability for further proces-
sing by the biometric system or assess its conformance
to preestablished standards. The quality of a biometric
482
F
Fingerprint Image Quality
signal is a numerical value (or a vector) that measures
this intrinsic attribute. Quality score is a quantitative
expression of the utility, or predicted performance of a
biometric sample in a comparison environment. This
means that finger image quality scores should correlate
to the observed false match and
▶ false non-match
rates of the samples.
Introduction
With an increase in the need for reliable identity
authentication, biometric recognition systems have
been increasingly deployed in several different applica-
tions: government applications such as national ID
card, border control; and commercial applications,
such as physical access control, e-commerce, or mobile
phone. Among all biometric modali ties, fingerprint
recognition is the most widespread due to its perma-
nence and uniqueness [1].
A fingerprint is a pattern of friction ridges on the
surface of a fingertip. A good quality fingerprint has
distinguishable patterns and features that allow the
extraction of features, which are useful for subsequent
matching of fingerprint pairs. This viewpoint may be
distinct from the human conception of quality. If, for
example, an observer sees a fingerprint with clear ridges,
low noise, and good contrast then he or she might
reasonably say it is of good quality. However, if the
image contains few minutiae points then a minutiae-
based matcher would underperform. Thus, in the context
of automated matching, the term quality should not
be used to refer to the fidelity of the sample, but instead
to the utility of the sample to an automated system.
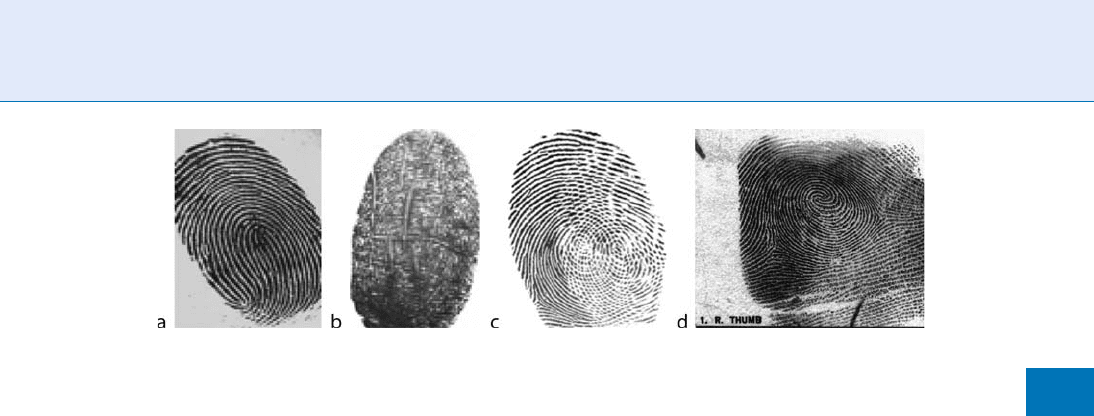
Figure 1 shows examples of good and poor quality
fingerprint image s.
Automatically and consistently determining the
quality of a given biometric sample for identification
and/or verification is a problem with far-reaching
ramifications. If one can identify low qualit y biometric
samples, this information can be used to improve the
acquisition of new data. This same quality measure can
be used to selectively improve an archival biometric
database by replacing poor quality biometric samples
with better quality samples. Weights for multimodal
biometric fusion can be sele cted to allow better quality
biometric samples to dominate the fusion. All of these
applications require that the quality of the biometric
sample be determined prior to identification or verifi-
cation. Most of these applications also require that
quality of the biometric sample be computed in real-
time during data acquisition.
Fingerprint Image Quality
Performance of an automated fingerprint recognition
system is greatly affected by the degree of imperfection
present in the finger image. Accuracy of current finger-
print recognition systems is high when high-quality
samples are being compared [2] (Note that according
to Minutia Interoperability Exchange Test 2004
(MINEX04) report, best single finger proprietary fin-
gerprint recognition system performed at 0.0047 false
non-match rate at 1% false match rate.). However,
performance degrades substantially as quality drops.
Fingerprint Image Quality. Figure 1 Good quality fingerprint images (a) have clear pattern of ridge and valleys;
however, poor quality fingerprint images (b) do not have easily distinguishable patterns. Poor quality images result in
spurious and missed features, thus degrading the performance of the overall system. Poor quality samples can be due to
distorted source like abraded skin (b), distortion in one or more steps of the process, e.g., capture (residual fingerprints on
the platen in (c)) or compression, or low character source, the sample may subjectively be assessed as ’’good’’ quality, but
a matcher may not be able to match it to its mate (d).
Fingerprint Image Quality
F
483
F
Although only a small fraction of input data are of
poor-quality, the bulk of recognition errors can be
attributed to poor-quality samples.
Degradation in fingerprint image quality reduces
the amount of identi fiable information in a finger-
print. Poor quality images cause spurious and missed
features which decrease the likelihood of a correct
verification and/or identification, while extremely
poor quality samples might be impossible to verify
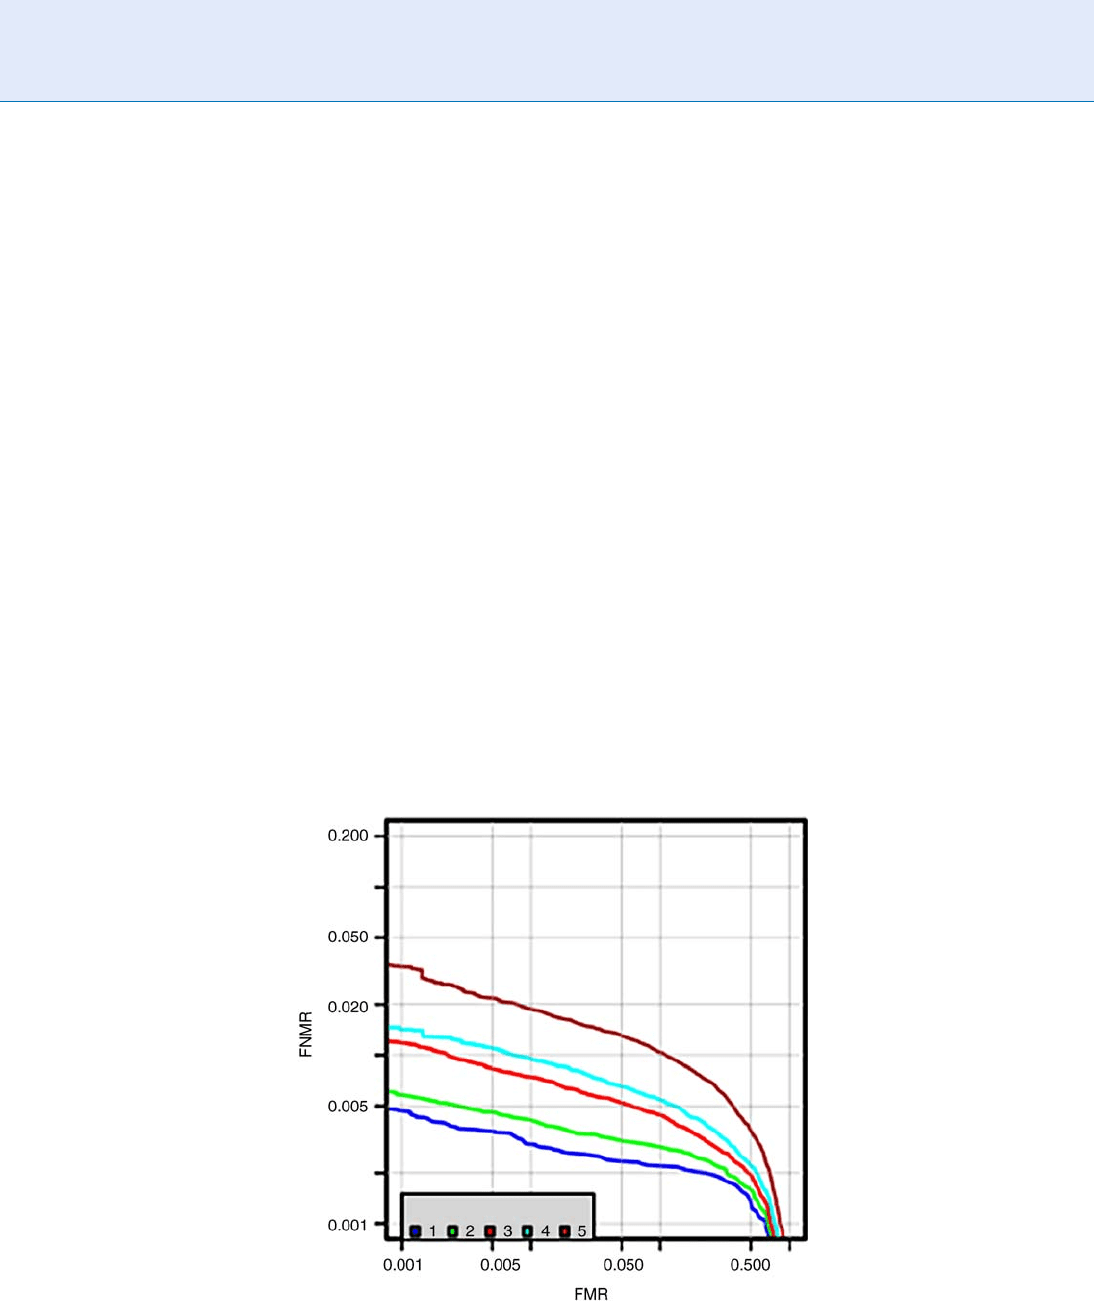
and/or identify. The variation in performance for dif-
ferent quality levels is shown in Fig. 2. The five traces
of Detection Error Tradeoff (DET) curves correspond
to five different levels of quality as measured by NIST
Fingerprint Image Quality (NFIQ) [3, 4]. NFIQ is an
integer between 1 and 5 where 1 represents the highest
quality and 5 the lowest (unusable) quality.
Several factors affect the quality of fingerprint images:
user’s skin condition, improper finger placement, scan-
ner limitation or imperfection, impurities on the scanner
surface and others. The cause of these imperfections can
be classified in four groups: (1) impairments in the
source of
▶ Biometric character istics: like scars, blisters,
skin conditions such as wet or dry, age, occupation,
etc.; (2) user behavior: such as improper finger place-
ment, e.g., rotating finger or placing only tip of a finger
which cause capturing insufficient area of finger image;
(3) imaging: e.g., low contrast, distortion, sampling
error, insufficient dynamic range, etc.; and (4) environ-
ment: such as temperature, humidity, or unclean
platen.
Fingerprint Image Quality Measures
It is w idely accepted that a statement of a biometric
sample’s quality should be related to its recognition
performance. That is, a quality measurement algo-
rithm takes a signal or image, x, and produces a scalar,
q ¼ Q(x), which is predictive of error rates associated
with the verification or identification of that sample.
This predictive value of qu ality measures may be im-
perfect but valuable nevertheless. It should be noted
that operat ionally the requirement for a scalar is not
necessary: a vector could be stored and could be used.
The fact that quality has historically been conceived of
as scalar is a widely manifested restriction [5].
International Standards Organization (ISO) has
recently established a biometric sample quality draft
standard [6], in which quality score of a biometric
sample is defined as predicted performance of the
Fingerprint Image Quality. Figure 2 Quality ranked detection error trade-off characteristics. Five traces correspond
to five NFIQ levels. Fingerprint images with NFIQ¼1 (highest quality) cause lower recognition error than images with
NFIQ¼5 (lowest quality).
484
F
Fingerprint Image Quality
sample in a comparison environment. It considers
three components of quality: (1) character, which refers
to quality of inherent physical features of the source,
for example, a fingerprint with a scar has low character;
(2) fidelity, which is the degree to which a sample is an
accurate representation of its source, for example, dis-
tortion degrades fidelity; and (3) utility, which refers to
contribution of a sample to the overall biometric rec-
ognition error rates and is related monotonically to the
performance of biometric matchers. Character and
fidelity of a sample positively or negatively impact the
utility of the sample.
There are several fingerprint analysis approaches
that gauge character and fidelity of fingerprint images.
These measures are then summarized into a scalar (or a
vector) quality score that is indicative of utility of the
sample. Broadly fingerprint image analysis can be
divided into local and global analysis methods [7].
Fingerprint local structure constitutes the main texture-
like pattern of ridges and valleys within a local region
while valid global structure puts the ridges and valleys
into a smooth flow for the entir e fingerprint. The quality
of a fingerprint image is determined by both its local and
global structures. Local feature analysis methods parti-
tion an image into nonoverlapping blocks and assign a
quality score to each block which indicates the amount of
useful information in that block for subsequent match-
ing. Final image quality score can be computed by com-
bining quality scor es of the blocks. Global feature analysis
examines continuity and uniformity of ridge–valley
structure of a fingerprint image in a holistic manner
and computes a global measure of fingerprint quality.
Global and local quality measures could be com-
bined to obtain final quality score of a fingerprint
image such that the overall quality score is a measure
of match ability of the sample in an automated match-
ing process, i.e., the derived quality score should be
related to the biometric error rates that is likely to be
realized when the sample is matched.
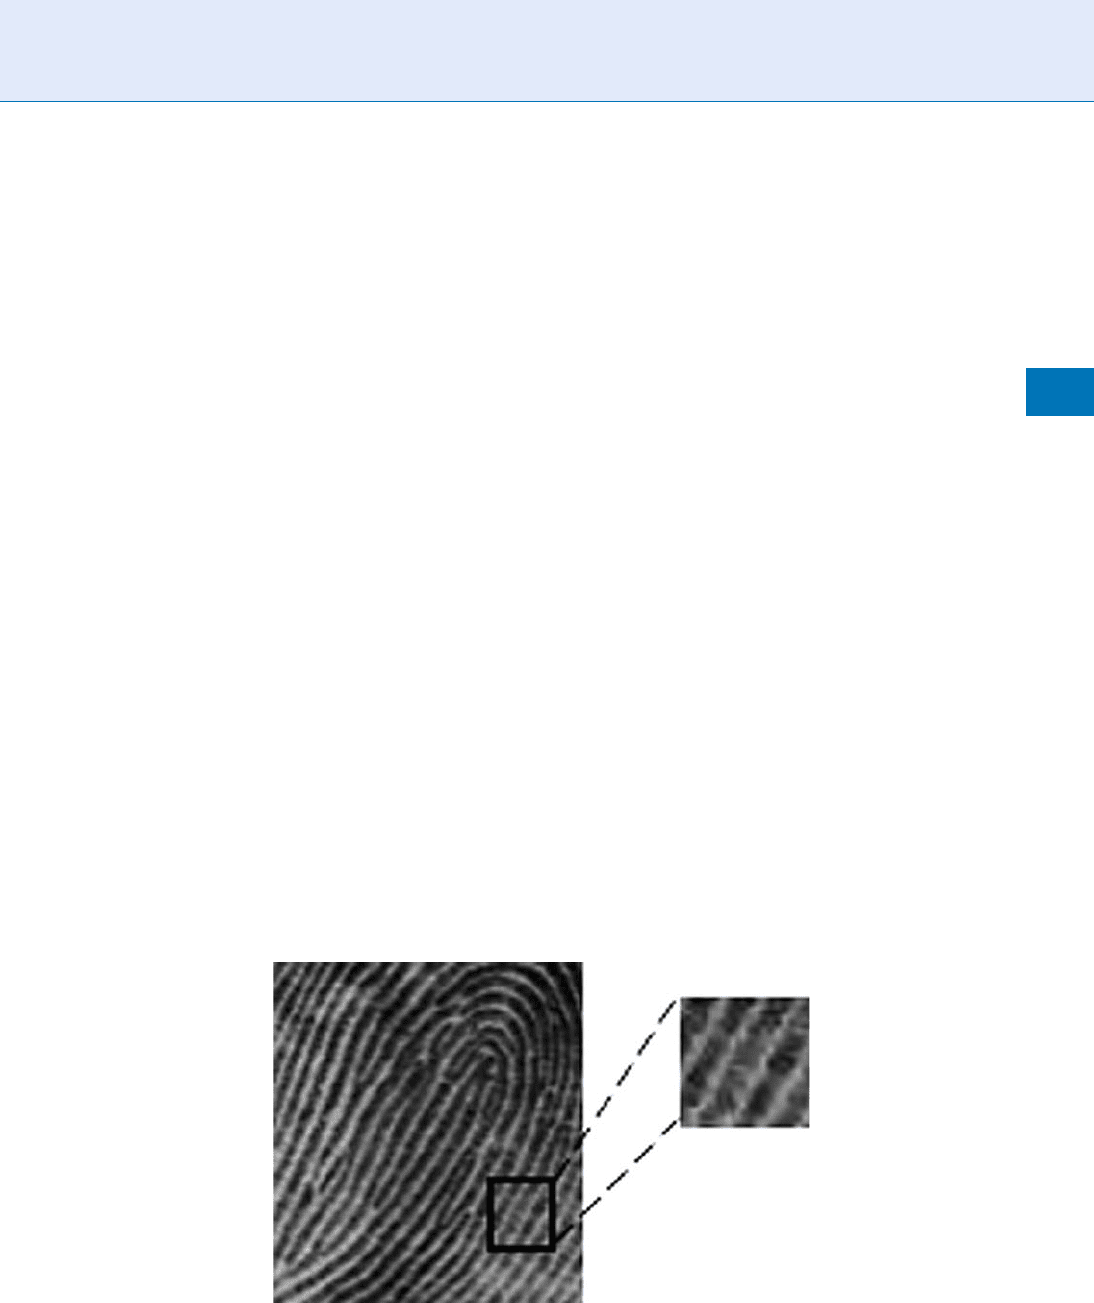
1. Local Analysis To locally analyze a fingerprint
image, it is divided into grids of blocks (Fig. 3).
For each block, local features such as directional
flow of ridges are computed which are then sum-
marized into a quality score representing quality of
the block. Each block should be large enough to
contain sufficient ridge–valley information, at least
two ridges per block. For example, for a fingerprint
with a resolution of 500 ppi, each block could be
32 32 pixels. An overview of existing local analy-
sis methods follows.
a. Orientation certainty field: A fingerprint image
within a small block generally consists of ridges
(dark pixels) separated with valley (light pixels)
lines along the same orientation. High-quality
blocks of a fingerprint image contain consistent
ridge (or valley) orientation. Local angle infor-
mation in each block can be used to compute
local features. Lim et al. [8] computed energy
concentration along the dominant direction of
Fingerprint Image Quality. Figure 3 Local analysis consists of partitioning a fingerprint image into small blocks. Local
features such as orientation consistency or directional flow are extracted from each block. These features convey
information useful for comparison of the image and therefore indicate quality of the block.
Fingerprint Image Quality
F
485
F
ridges by computing the ratio between two eigen-
values of the covariance matrix of a block’s
gradient vector. It gives an indication of how
strong the energy is concentrated along the
ridge–valley orientation. Chen et al. [9] measured
orientation coherence in each block using gra-
dient of the gray level image.
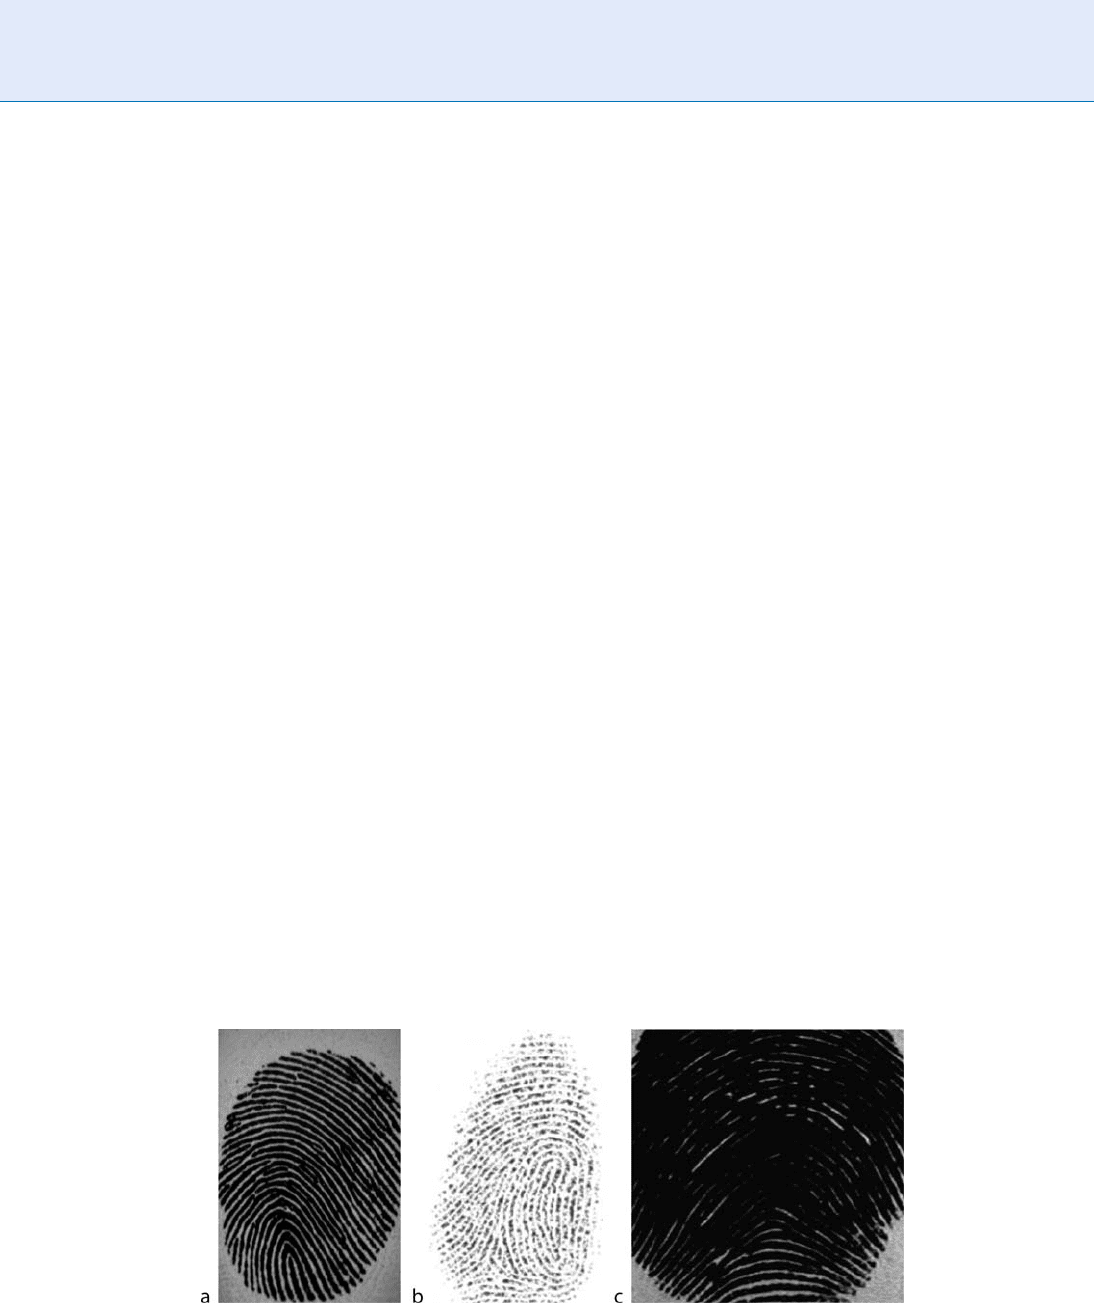
b. Ridge–valley structure: Well-formed and clearly
visible ridges are essential to the reliable detec-
tion of ridge endings and bifurcations, also
known as minutia points. Ridges that are too
close or too far apart, or ridges that are unrea-
sonably thick or thin indicate that the finger
image may not have captured properly, due to,
e.g., pressing too hard or too soft (Fig. 4). Shen
et al. [10] applied Gabor filter to image sub-
blocks, to identify blocks with clear repetition of
ridge and valley pattern as good quality blocks.
c. Pixel intensity or Directional contrast: Region of
good quality exhibits high directional contrast,
which means that the ridges and the valleys are
well separate d with regard to gray values. High-
quality blocks will exhibit large variance in gray
levels while low-quality blocks will show small
variance. [11–13] assess quality of each block
based on its pixel intensity. Bolle et al. [14]
used ratio of directional area to other nondirec-
tional area as a quality measure.
d. Power Spectrum: Ridge and valley structure in a
high-quality block forms a periodic signal,
which can be approximated either by a square
wave or a sinusoidal wave with its frequency
lie in certain range. In frequency domain, a
square wave exhibits a dominant frequency
with sideband frequency components (sinc
function), and a sinusoidal wave consists of
one dominant frequency and minimum com-
ponents at other nondominant frequencies.
Therefore, existence of a dominant frequency
component plus its frequency are indicative of
high- quality blocks of fingerprint image. Poor
quality blocks will not exhibit a dominant fre-
quency or it will be out of the normal range of
ridge frequency [12]. Hong et al. [15] modeled
the ridge and valley pattern as sine wave, and
computed the amplitude, frequency as well as
the variance of the sine wave to decide the
quality of the fing erprint. Nill and Bouzas [16]
propose an objective image quality based on the
digital image power of normally acquires
scenes. Their system is designed to assess the
quality of digital images and can be applied to
fingerprint as well.
2. Global Analysis A good qualit y fingerprint exhibit
smooth changes in ridge orientation across the
entire fingerprint image except when a core or
delta point occurs. Ratio of ridge to valley thickness
should also be fairly constant throughout the whole
image. [8] used local angle information in each
block to assess continuity in orientation field be-
tween neighboring blocks and uniformity of ridge
to valley thickness ratio. Chen et al. [13] computed
a block’s absolute difference in the orientation
angle with its neighboring blocks as a measure of
Fingerprint Image Quality. Figure 4 Examples of (a) good, (b) thin, and (c) thick ridge structure. (b) and (c) pose
challenge to automated matching system and hence are of lower quality than (a).
486
F
Fingerprint Image Quality

smoothness of the change in orientation angles
among blocks. As mentioned earlier, the ridges of
a finger image can be locally approximated by one
sine wave with its frequency in a cer tain range.
A region of interest (ROI) of the spectrum is de-
fined as an annular region with radius ranging
between the minimum and maximum typical
ridge frequency values. For a more robust ridge
structure (i.e., the better image quality) the energy
will be more concentrated within the ROI. [9]
measured the ener gy concentration in ring-shaped
regions of the ROI by employing bandpass filters to
extract the energy in each frequency band. Good
quality images will have the energy concentrated in
few bands while poor quality fingerprints will have
a more diffused distribution.
3. Overall Fingerprint Image Quality: prediction of
performance: It is desirable to combine local and
global quality features into one scalar or a vector of
quality such that the overall fingerprint image qual-
ity is related to the expected false match and false
non-match of the image. The summarization can
simply be the percentage of blocks classified as
‘‘good’’ or ‘‘bad’’ quality after a local analysis, or
more elaborate combination methods such as
weighted average of local qualities. For example,
higher weights could be assigned to blocks closer
to the centroid of a fingerprint since features
extracted from blocks near the centroid have
more useful and reliable information [9, 11]. Use
of a classifier to nonlinearly combine local and
global features was first proposed by Tabassi et al.
[3, 4]. The method called NIST Fingerprint Image
Quality NFIQ [3, 4] was developed to predict how
far a genuine score would lie from its impostor
distribution and is thus effective at improving
false rejections while suppressing false acceptance
errors.
NFIQ extrac ts minutia, assigns a quality value
to each minutia point, and measures orientation
field, pixel intensity, and directional map to com-
pute the following local and global features: num-
ber of foreground blocks, number of minutia,
number of minutia that have quality value better
than certain thresholds, percentage of foreground
blocks of excellent, good, fair, and poor quality.
A neural network was trained to classify the com-
puted feature vectors into five levels 1–5 where
NFIQ = 1 is the best quality and NFIQ = 5 is the
lowest quality. Figure 2 shows that the highest
recognition performance is achieved for the best
quality samples (NFIQ¼1), and samples with low-
est quality (NFIQ¼5) have the lowest perfor-
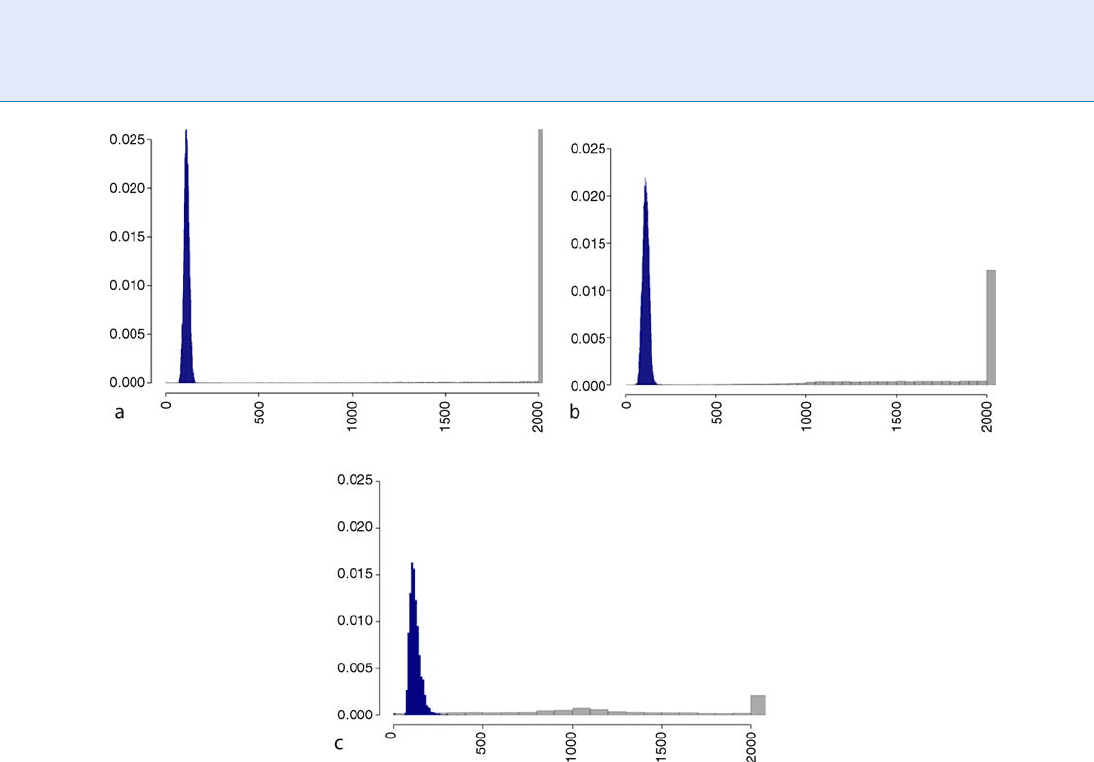
mance. The plots of Fig. 5 show, respectively, the
genuine and impostor distributions for NFIQ
values 1 (excellent quality), 3 (average quality),
and 5 (poor quality). The overlapping of genuine
and impostor for the poorest NFIQ (i.e., NFIQ = 5)
means higher recognition errors for that NFIQ
level while the almost complete separation of the
two distributions for the best quality samples (i.e.,
NFIQ = 1) indicates lower recognition error. Source
code for
NFIQ algorithm can be found in [17].
Applications of Biometric Quality
Values
This section describes the roles of a sample quality
measure in the various contexts of biometric opera-
tions. The quality value here is simply a scalar sum-
mary of a sample that is taken to be some indicator of
matchabilit y. These uses of biometric sample quality
are not fingerprint specific and can be generalized to
other modalities like face or iris.
1. Enrollment Phase Quality Assessment Enrollment is
usually a supervised process, and it is common to
improve the quality of the final stored sample by
acquiring as many samples as are needed to satisfy
either an automatic quality measurement algorithm,
a human inspector (a kind of quality algorithm), or a
matching criterion (by comparison with a second
sample acquired during the same session). Our
focus on automated systems’ needs is warranted
regardless of analyses of these other methods, but
the authors do contend that naive human judg-
ment will only be as predictive of a matcher’s
performance as the human visual system is similar
to the matching system’s internals, and it is not
evident that human and computer matching are
functionally comparable.
Specifically, human inspectors may underesti-
mate performance on overtly marginal samples.
Certainly human inspectors’ judgment may be im-
proved if adequate training on the failure modes
and sensitivities of the matcher is given to the
Fingerprint Image Quality
F
487
F
inspector, but this is often prohibitively expensive
or time consuming and not scalable. Immediate
matching also might not be predictive of perfor-
mance over time because same-session samples
usually produce unrealistically high match scores.
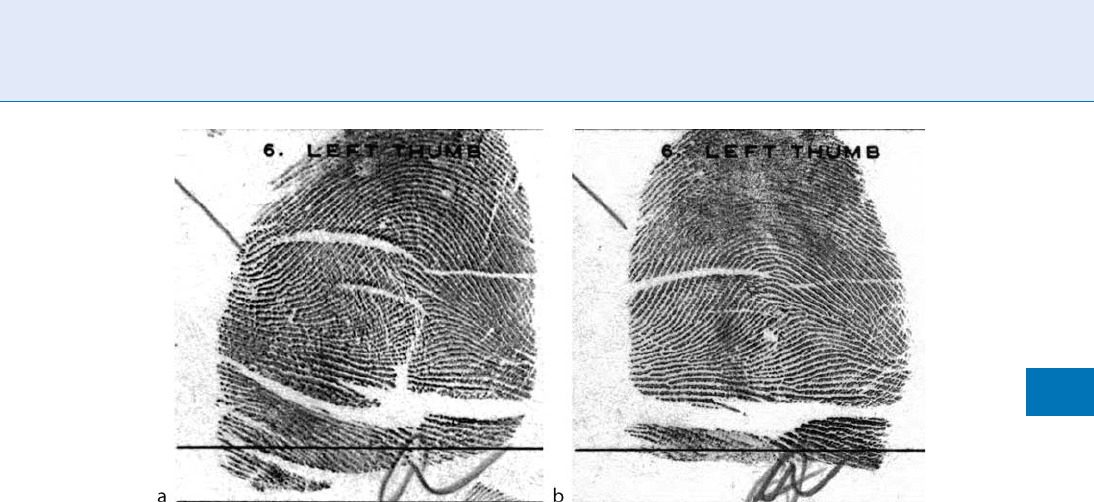
For instance, Fig. 6 shows an example of two same-
session fingerprint images that were matched suc-
cessfully by three commercial vendors despite their
obvious poor quality.
In any case, by viewing sample acquisition as a
measurement and control problem in which the
control loop is closed on the quality measure, a
system gains a powerful means of improving over-
all sample quality.
2. Quality Assurance Finger image quality assessment
algorithms may be used to monitor quality across
multiple sites or over time. This is useful to signal
possible performance problems ahead of some
subsequent matching operation. Quality values
may be aggregated and compared with some his-
torical or geographic baselines. Use of quality
values in this role has been documented in [18].
The National Institute of Standards and Tech nol-
ogy (NIST) has published a technical guidance
toward quality summarization [19]. Quality sum-
marization addresses the important issue of enter-
prise quality-assurance surveying by providing
tools on how to combine quality scores of individ-
ual samples into one scalar representing quality of
the whole database. Such a function would support
identification of, e.g., defective sensors, underper-
forming sites, and seasonal or secular trends.
3. Ver ification Quality Assessment During a verifica-
tion transaction, quality can be improved by clos-
ing an acquire–reacquire loop on either a match-
score from comparison of new and enrollment
samples or on a quality value generated without
matching. Indeed it is common to implement an
Fingerprint Image Quality. Figure 5 Probability density of impostor scores is shown in blue and probability density
of genuine scores is shown in gray. There is a higher degree of separation between the genuine and impostor
distribution for better quality samples as measured by NFIQ. (a) Best. (b) Middle. (c) Worst.
488
F
Fingerprint Image Quality
‘‘up to three attempts’’ policy in which a positive
match is a de facto statement that the sample was of
good quality – even if the individual happens to be
an impostor. Depending on the relative computa-
tional expenses of sample matching, reacquisition,
and quality measurement, the immediate use of a
matcher may not be the best solution. The key
difference here (as compared with the enrollment-
phase) is that quality values of bot h the enrollment
and verification samples can be used to predict
performance. This two-dimensional problem is
distinct from the enrollment case where only one
quality value is used.
4. Identification Quality Assessment Quality measure-
ment in identification systems is important for at
least three reasons. First, many users often do not
have an associated enrollment sample. So a one-to-
many match will be an inefficient and inconclusive
method of stating whether the authentication sample
had high quality. Second, in negative identification
systems where users with an enrolled sample are
motivated to evade detection, quality measurement
can be used to detect and prevent submission of
samples likely to perform poorly [20], which may
help prevent attempts at spoofing or defeating de-
tection. Third, identification is a difficult task: it is
imperative to minimize both the false non-match
rate (FNMR) and the false match rate (FMR). To
the exte nt that consistently high-quality samples
will produce high genuine scores, a high matching
threshold can be used and this will collaterally
reduce FMR. But in large po pulations FMR
becomes dominant, and this raises the question:
can a quality apparatus be trained to be directly
predictive of false match likelihood?
5. Differential Processing Quality measurement algo-
rithms can be used toalter the subsequent pro-
cessing of a sample. Such conditional activity
arecategorized as follows.
a. Pre-processing Phase
An identification system might apply image res-
toration algorithms or invoke different
▶ fea-
ture extraction algorithms for samples with
some discernible quality problem.
b. Matching Phase
Certain systems may invoke a slower but more
powerful matching algorithm when low-quality
samples are compared.
c. Decision Phase
The logic that renders acceptance or rejection
decisions may depend on the measured quality
of the original samples. This might involve
changing a verification system’s operating thresh-
old for poor quality samples. For example, in
multi-modal biometrics, the relative qualities of
samples of the separate modes may be used to
augment a fusion process [21, 22].
d. Sample Replacement
To negate the effects of template aging, a quality
measurement may be used to determine whether
Fingerprint Image Quality. Figure 6 Example of same session captures of single finger that despite their poor quality
(NFIQ¼5) were matched correctly by three leading commercial matchers.
Fingerprint Image Quality
F
489
F