Lowenthal G., Airey P. Practical Applications of Radioactivity and Nuclear Radiations
Подождите немного. Документ загружается.


Section 7.2.1, these data may be used to supplement on-line measurements of
ash in coal.
Instrumented neutron activation analysis
Nowadays, instrumented neutron activation analysis (INAA) is used where
possible to cope with the growing demand for measurements. INAA involves
(a) the automatic transfer of the sample to the reactor irradiation position for
a pre-determined time, (b) subsequent counting of the activity of the sample
using a high-resolution solid state detector and (c) the automated analysis of
the resulting g ray spectrum in terms of the concentrations of the required
elements. The method is non-destructive but there is a limit to the range of
elements that can be measured. The shorter the half life of the element, the
shorter has to be the cycle for sample transfer operations, activation and
counting. The minimum half life which can be accommodated in favourable
conditions is a few seconds.
7.4 Applications of neutrons 221
Table 7.8. Energies of major (g s/n >5%) photopeaks from selected elements
(after Mikesell et al. in IAEA, 1990b).
a
Element Photopeak energy (MeV)
Silicon 3.539, 3.028 (se
b
of 3.539) , 2.517 (de
c
of 3.539), 4.934, 4.423 (se of
4.934), 3.912 (de of 4.934) 2.093
Aluminium 1.779, 7.724, 7.213, 6.702,
Iron 7.631, 7.120 (se
b
of 7.631) , 6.609 (de
c
of 7.631), 7.645, 7.134 (se of
7.645), 6.623 (de of 7.645), 5.920, 5.409 (se of 5.920), 4.898 (de of
5.920), 6.018 , 5.507 (se of 6.018), 4.996 (de of 6.018)
Calcium 1.942, 6.420, 5.909 (se
b
of 6.420), 5.398 (de
c
of 6.420), 4.419, 3.908
(se of 4.419), 3.397 (de of 4.419)
Nickel 8.999 , 8.488 (se
b
of 8.999), 7.977 (de
c
of 8.999), 8.533 , 8.022 (se of
8.533), 7.511 (de of 8.533), 0.465, 6.837, 6.326 (se of 6.837), 5.815
(de of 6.837)
Manganese 0.847, 1.811, 7.244, 6.733 (se
b
of 7.244), 6.222 (de
c
of 7.244), 7.058 ,
6.547 (se of 7.058), 6.036 (de of 7.058)
Magnesium 3.917, 3.406 (se
b
of 3.917), 2.895 (de
c
of 3.917), 2.828, 1.809, 0.585
Sodium 0.472, 6.395, 5.884 (se
b
of 6.395), 5.373 (de
c
of 6.395), 0.871, 3.982,
3.471 (se of 3.982), 2.960 (de of 3.982), 2.027
Potassium 1.461 (natural decay), 0.770, 5.381, 4.870 (se
b
of 5.381), 4.359 (de
c
of 5.381)
a
The table is designed to indicate the range of pro mpt gamma neutron activation
peaks. In practice many of the peaks are not used because of interfer ences, or
because they lie outside the spectral range of the instrumentation.
b
se single escap e peak (Section 6.4.2).
c
de double escape peak.
Other comments
Activation analysis has been applied in numerous ®elds, including the
analysis of biological materials, coal and coal ef¯uents, water samples, air
particulate matter and semiconductor materials. It has also been applied to in
vivo studies, archaeology, agriculture and botany. Further information may
be obtained from Alfassi (1990) or Kruger (1971).
The large majority of NAA measurements use radioactivation and so are
carried out most ef®ciently by thermal neutrons. Epithermal or fast neutron
irradiations (Section 5.4.4) are employed when reduced ef®ciency of activa-
tion is compensated by reduced interferences. Many nuclear reactions will
only respond to fast neutrons. The intensities of epithermal or fast neutrons
are measured by using neutron ®lters such as cadmium sheets to ®lter out the
thermal ¯ux. Reactions triggered by fast neutrons, e.g. (n,p) or (n,a)
reactions, are also used to measure the energies and intensities of fast
neutrons in the reactor spectrum.
For assays of highest sensitivity, neutron activation techniques are com-
bined with either chemical concentration of the target element prior to
irradiation or radiochemical separation following the activation of the
sample (Fardy, 1990).
7.5 Scienti®c and industrial applications of protons and alpha particles
7.5.1 Introduction
High-energy protons or alpha particles impinging on a target material will
form a range of reaction products including X rays, gamma rays and
neutrons (Peisach, 1990). Their properties underpin a number of applications
which may be broadly classi®ed as
multi element analyses
thin layer activation, and
general applications such as smoke detection.
The implantation of metals and alloys with heavy ions can lead to surface
hardening which is exploited in industry. However, a detailed discussion is
beyond the scope of this text.
7.5.2 Multi element analyses
The irradiation of a target material by protons or alpha particles leads to
the excitation of the atoms and their nuclei with the resulting emission of
Industrial applications of radioisotopes and radiation222
X rays and gamma rays. The energies of the emitted radiations are
indicative of the elements present and the intensities re¯ect their concentra-
tions. These properties have been exploited over many years for the multi
element analyses of natural materials. The most common arrangement
involves the activation of the sample material with a proton beam from a
Van de Graaff accelerator and the measurement of the emitted X rays and
gamma rays. These techniques are known as proton induced X ray emission
(PIXE) and proton induced gamma ray emission (PIGME) respectively.
The beams may be highly focussed to a spot a few microns in diameter, or
even less, and directed to speci®c locations on the sample. It is thereby
possible to map the distribution of a range of elements across a sample.
There are widespread applications of PIXE and PIGME techniques to
geology (Brissaud et al., 1986), archaeology (Duerden et al., 1979) and
environmental science.
7.5.3 Thin layer activation
If the energy of the proton beam is suf®ciently high, interaction with the
target elements will lead not only to the emission of X rays and gamma rays,
but also to activation. Since the primary beam rapidly loses energy, the
activation process is restricted to the region close to the surface and is
technically known as thin layer activation. A number of industrial applica-
tions of this technology have been developed (IAEA, 1997, Longworth, 1998,
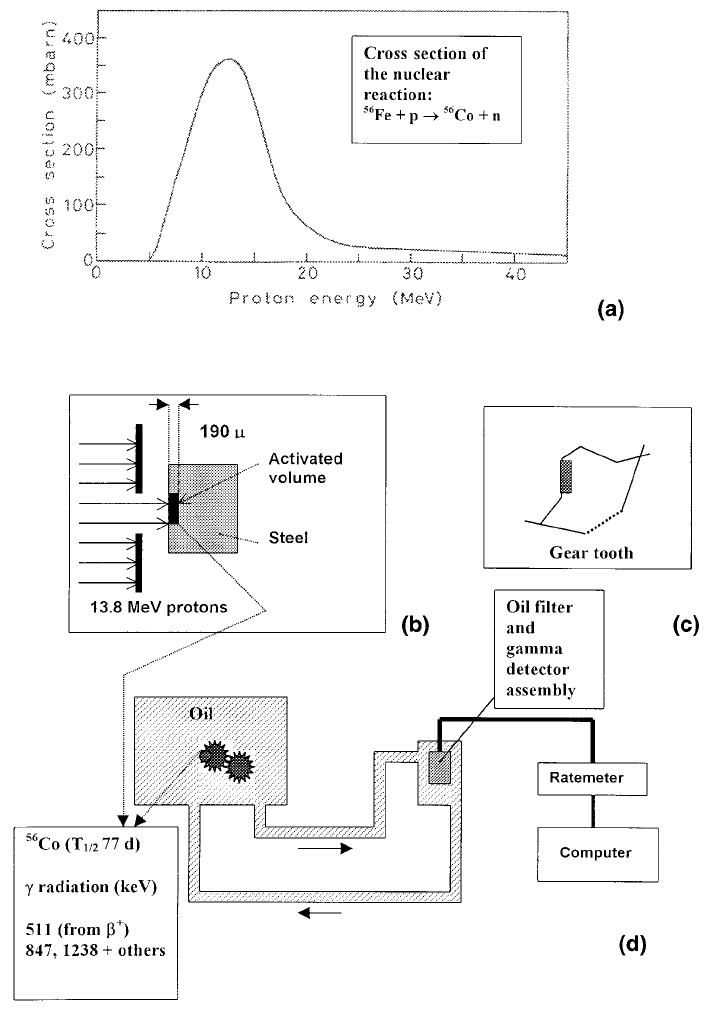
Ch. 5). One of the most important is to the study of the rate of wear of
machine components such as gear wheels. The principles of the method to
effect thin layer activation are illustrated in Figure 7.11, showing the
activation of the surface of a gear tooth. The gear was removed from a piece
of machinery and the iron activated using a beam of 13.8 MeV protons from
an accelerator, so generating
56
Co(
56
Fe + p ?
56
Co + n).
The radioisotope
56
Co has a half life of 77 d and emits gamma rays in
the range 847 to 3253 keV. The cross section of the reaction is shown in
Figure 7.11(a). The level of
56
Co activity generated depends on the number
of protons incident on the target. This is expressed in terms of a yield Y
which may be expressed in terms of kilobecquerel
56
Co per microampere
hour. The yield of
56
Co decreases from about 500 kBq/mA h at the surface
to virtually zero at the range of the 13.8 MeV protons in iron (say 190 mm).
Following activation with the accelerator (cyclotron) beam, the machine is
re-assembled, and one of two strategies is followed. The ®rst involves
circulating the lubricating oil through a ®lter designed to collect the metal
7.5 Thin layer investigations using charged particles 223

particles which have been eroded off the component. The build up of
radioactive particles on the ®lter may be monitored continuously (Figure
7.11(d)). The second approach involves locating the detector near the
component and monitoring the rate of loss of the surface activated material.
Since the monitoring is continuous, and does not interfere with the
functioning of the machine, the effect of various factors such as the
properties of the oil and its additives and the operating temperature of the
machine may be investigated.
7.5.4 Smoke detectors
One of the most widespread applications of radioisotopes is in smoke
detectors, millions of which are sold every year. A small
241
Am source is used
in one of the common designs. Alpha particles from the source ionise air
molecules which then migrate to a detector electrode to form a small
ionisation current. In the presence of smoke particles, the current is reduced,
and this triggers an alarm at a pre-determined level. Radioactive smoke
alarms are sensitive to particles over a much wider size range than those
based on light scattering.
7.6 Scienti®c and industrial applications of the absorption of radiation
7.6.1 The chemical effects of radiation
Industrial nucleonic gauges are designed to monitor key operating para-
meters in real time, to optimise process ef®ciency through on-line control and
to diagnose plant malfunction. The absorption of ionising radiation in many
materials also leads to chemical changes. However, exploitation of the
chemical effects of radiation on an industrial scale requires radiation inten-
sities that are thousands to millions times higher than those used for
diagnostic purposes.
The absorption of high-energy radiation by a molecule, M, leads to a range
of primary excitation and ionisation products (M* and M
+
) which may be
represented by expressions such as:
Industrial applications of radioisotopes and radiation224
M* (excitation) (7.8)
M
M
+
+e
7
(ionisation) (7.9)
"
"
7.6 Applications of the absorption of radiation 225
Figure 7.11. Study of wear rate using thin layer activation. (a) Activiation cross
section as a function of proton energy. (b) Irradiation of a gear tooth (shown in (c))
with 13.8 MeV protons. (d) Measurement of the rate of accumulation of wear de bris
on the ®lter (after IAEA, 1997, Fig ures 4 and 9).
Subsequent reactions form the basis of a number of industrially important
chemical and biological processes. Important industrial applications of
radiation technology are the formation of heat shrinkable polymers, the
sterilisation of medical products and food irradiation.
7.6.2 Radiation chemistry of aqueous solutions
Basic processes
Since the mid-1920s it has been known that X rays as well as a particles could
decompose water into hydrogen and oxygen. However, it was only in the
1960s that it could be shown that the initial ionisation and excitation
processes (Eqs. (7.8) and (7.9)) lead to the following primary radiation
decomposition products
H
2
O ? e
7
aq
,H
+
,H,OH,H
2
,H
2
O
2
. (7.10)
The species e
7
aq
comprises electrons formed in the initial ionisation process,
surrounded by a partially ordered array of water molecules. Although they
have a lifetime of only a few microseconds in pure water, the aquated
electrons were ®nally identi®ed as separate species through their well de®ned
optical spectra. Other radiation induced products include the hydrogen atom
(H) and the hydroxyl radical (OH), as well as molecular hydrogen and
hydrogen peroxide (H
2
O
2
). These species interact with added solutes to form
a wide range of secondary products. Radiation chemistry is concerned with
the study of these products (Tabata et al., 1991, Mozumber, 1999).
Chemical dosimetry
Radiation dosimetry was introduced as the science concerned with the
measurement of the energy of ionising radiation absorbed in any material
including living organisms (Section 2.4.2). In the SI system, the unit of dose is
the gray (Gy) de®ned as 1 J of energy imparted to 1 kg of matter (1 Gy = 1 J/
kg, see Eq. (2.3a)). The primary standard of dosimetry is based on calori-
metry, a technique designed to measure absorbed energy as heat with high
accuracy, but which requires expensive facilities and specialised skills (Sec-
tions 2.3.2 and 5.4.3). To avoid such complications, a range of secondary
dosimeters has been developed to facilitate measurements for chemical
dosimetry.
Dosimeters are calibrated to measure the absorption of ionising radiation
in materials of interest and are routinely used for that purpose (McLaughlin
et al., 1989). Important examples are listed in Table 7.9. Each dosimetry
Industrial applications of radioisotopes and radiation226

Table 7.9.
Dosimetry systems (after McLaughlin, 1989).
Dosimeter
Classi®cation
Range*
Comments
Calorimetry
Primary dosimeters and
reference dosimeters
0.2 to 2 Gy/s** Radiation energy absorbed as heat in a thermally
isolated mass and measured
Ionisation chambers Reference and ®eld
dosimeters
300 to 20,000 Gy/s Radiation induces secondary elecrons in the
chamber walls and ionisation in the gas
Standard ferrous
sulphate (Fricke
dosimeter)
Chemical dosimeters,
reference dosimeters
2 to 200 Gy The radiation induced yield of ferric species from
acidi®ed ferrous sulphate is measured
Cerous ceric dosimeter Chemical dosimeters,
transfer dosimeter
10
3
±5610
4
Gy
(up to 10
6
Gy
possible)
The formation of ceric ions induced by the
irradiation of acidi®ed cerous or cerous/ceric
solutions
Alanine dosimeter Transfer dosimeter 1 to 10
5
Gy Alanine mixed with paraf®n, cellulose, polystyrene
or other binders produces free radicals on
irradiation which are measured by (ESR)
Plastic dosimeters Routine dosimeters Varies, but
generally in the
range 10
3
to 10
6
Gy
Changes in the optical absorption of a range of
plastics or dyed polymers (e.g. red, amber or clear
perspex). Colour changes in radiation sensitive
®lms
Thermoluminescent
(TLD) dosimeters
Routine dosimeters refer comments Usable dose range
depends on the material:
Li
2
B
4
O
7
:10
72
to 10
5
Gy
CaF
2
;Mn: 10
76
to 10
3
Gy
CaSO
4
;Dy: 10
71
to 5610
6
Gy
* Calorimetry and ionisation chambers expressed in terms of the absorbed
dose rate (Gy/s); chemical dosimeters expressed as total
dose absorbed (Gy)
** A water/polystyrene calorimeter (US National Institute of Science and Technology)
system has different properties and therefore different areas of applications,
some of which are listed in the table.
Chemical dosimetry systems are important because they are widely used as
transfer dosimeters in industry. A well known example is the ferrous sulphate
or Fricke dosimeter. Its operation is based on measurements of the energy
absorbed during ferrous±ferric oxidations, the absorbed dose being calcu-
lated from the readily measured concentration of ferric ions. Reliable
dosimetry is fundamental to good radiation practice and underpins many of
the applications introduced in the next section.
7.6.3 Industrial applications of high-energy radiation
Introductory comment
High-energy radiation is currently being applied to processes as diverse as the
formation and degradation of polymers, the curing of paints and coatings,
the sterilisation of medical products and the pasteurisation of certain food-
stuffs and additives. A number of potentially exciting applications are under
investigation. These include the pasteurisation of sewage and the treatment of
¯ue gases from power generation. For a systematic discussion of these issues,
readers are referred to the works of Bradley (1984) and Woods and Pikaev
(1993).
Radiation induced polymerisation
The absorption of radiation in organic systems leads initially to ionisation
and excitation and ultimately to the formation of free radicals. The organic
free radical R (Eq. (7.11)) is the analogue of the H atom and OH radical
formed in aqueous solutions (Eq. (7.10)). The free radicals undergo the
following reactions.
. Abstraction of atoms leading to the production of a new free radical, R', or radical
centre on a polymer chain:
R +R'H 7? RH+R' (7.11)
. Addition to double bonds in ole®n to form another radical:
HR'' HR'
é
HR'' HR'' HR''
ù
R' + C=C 7? R'±C±C
ê
+ C=C 7? R'±C±C±C±C
ê
HH HH
ë
HH HHHH
û
(7-12)
This is an addition reaction which is known as a chain propagating step
because it can be repeated many times, each time leading to a lengthening of
Industrial applications of radioisotopes and radiation228
the carbon backbone or chain shown in bold in Eq. (7.12). If the reagent
monomer (CH
2
=CHR'') were ethylene (CH
2
=CH
2
), the polymer product
would be polyethylene with R'' replaced by H in Eq. (7.12). If the monomer
were propylene (CH
3
CH=CH
2
), the plastic polypropylene would be formed.
Although high-energy radiation can be used to initiate polymerisation, it is
not used on an industrial scale for the production of bulk polymers as it
cannot compete economically with catalytic methods. It has, however, found
specialist applications in the curing of surface coatings and the printing
industry. Either electron beam irradiation or UV light is used. The latter is
generally favoured as the capital costs of the installations are much lower.
Effects of high-energy radiation on polymers
Radiation effects are complex and may lead either to the enhancement of the
polymer structure or to its degradation. In the former case, they result in the
establishment of chemical bonds between adjacent polymer chains in a
process known as cross-linking; in the latter, they lead to the degradation of
the polymer chains through bond scission. Although both processes occur
simultaneously, polymers may be classi®ed according to whether cross-
linking or scission dominates. Cross-linking polymers include polyethylene,
polystyrene, PVC (polyvinyl chloride), and, in particular, heat shrink plastics.
Examples of scission polymers are Te¯on, cellulose and polypropylene.
(1) Radiation cross-linking: Cross-linking is the process by which adjacent polymer
chains establish chemical bonds leadin g to complex networks. It results in the
transformation of weak plastic materials into stronger, extensible, more rubber-
like polymers. Free radical reactions are primarily involved. The absorption of
ionising radiation by a polymeric material leads to the formation of a number of
active sites along the chain. If two such sites on adjacent chains are in close
proximity a chemical cross- linking bond will be formed.
The production of heat shrink plastics is a major industrial use of radiation
cross-linking (Bradley, 1984, Ch. 10). It depends on the fact that lightly
irradiated high-density polyethylene (but also other polymers) exhibit a so-
called `memory effect'. The concept may be illustrated with reference to the
manufacturing steps.
Using normal manufacturing procedures, the polymer is formed into the
required shape and then cross-linked with ionising rad iation (electron beams or
60
Co radiation). The cross-linked polymer is heated above its melting point and
is then blown or stretched into a larger version of the same shape. The larger
version is then `frozen' by cooling. When next heated, it reverts to the required
size and shape.
Heat shrink material is manufactured as tubing, sheet or moulded compo-
nents. The principal use of light walled tubing is in the electrical and electronic
7.6 Applications of the absorption of radiation 229
industries. Heavy walled tubing is used to protect splice connectors in telecom-
munication and power cables, and as a sleeve to protect oil and gas pipelines
against corrosion. Heat shrink ®lm is used for food wrap and other packaging.
(2) Radiation induced degradation: As indicated above, one of the effects of the
irradiation of polymers is scission of the carbon chain leading ultimately to
degradation. Although this process dominates in a range of polymers, it has
found only limited industrial application. An exception is the degradation of
Te¯on.
Te¯on or polytetro¯uoroethylene (PTFE) is an analogue of polythene in
which the hydrogen atoms are replaced by ¯uorine. Usin g doses of radiation of
the order of 1 MGy (100 Mrad), Te¯on can be suf®ciently degraded to allow
grinding into small particles. This has led to an economical method for the
recycling of scrap Te¯on into powders ®ne enough (~3 mm) for use in printing
ink and as coating additives.
7.6.4 Radiation sterilisation
Introduction
Ionising radiations have long been known to be lethal to organisms at
suf®ciently high doses. It is not surprising, therefore, that a major industrial
application of these radiations is radiation disinfection by means of sterilisa-
tion. Sterilising doses are of the order of 10 000 to 30 000 Gy (1 to 3 Mrad),
delivered over a period of hours to days. This dose rate is a billion times
greater and the total dose several million times greater than that received
annually by the general public (Table 2.3).
Sterilisation of disposable medical products
This application has increased dramatically since the construction of the ®rst
commercial plants in the 1960s because sterilisation using ionising radiations
has the following important advantages.
. In a well designed plant, the radiation reaches the whole of the product at a dose
rate which can be controlled and accurately mo nitored; and
. Unlike other sterilisation processes, radiation technology is well adapted to
continuous operation and can be undertaken at normal temperature and after ®nal
packing.
Three types of ionising radiation are used:
60
Co g radiation, electron beam
irradiation and bremsstrahlung from high-energy electron accelerators (3 to
6 MeV). The irradiated products include medical gloves, syringes and a range
of pharmaceutical products.
Industrial applications of radioisotopes and radiation230