Mark James E. (ed.). Physical Properties of Polymers Handbook
Подождите немного. Документ загружается.

mixing and from the elastic deformation of the network
should be zero (see Eq. 29.37). Thus
0 ¼ln (1 w) þw þ ww
2
þ (V
1
j = N
A
V
0
)l
1
[1 þK(l
2
)],
(29:53)
where N
A
is the Avogadro number. Substitution for j=V
0
according to Eq. (29.41) yields
[ f
]
ph
¼(RT=V
1
)[ ln (1 w) þ w þ ww
2
]l=
[1 þK(l
2
)],
(29:54)
where K(l
2
) is defined by Eq. (29.45).
Using Eq. (29.54) Erman and Flory [39] analyzed the
results of Mark and Sullivan [113] on end-linked PDMS
networks swollen in benzene as well as the data from
Erman, Wagner, and Flory [37] on poly(ethyl acrylate).
They compared the values of [ f
]
ph
obtained from stress–
strain isotherms and swelling measurements with data cal-
culated from the chemistry of crosslinking. The [ f
]
ph
val-
ues derived from elasticity measurements were slightly
higher than those calculated from the known molecular
weights of the primary chains on the basis of stoichiometry.
The deviation was attributed to possible departures from
equilibrium in the force measurements. The most pro-
nounced departure was observed for networks of low de-
grees of crosslinking in which the approach of equilibrium is
protracted. No such deviation was detected for [ f
]
ph
obtained from swelling measurements. The satisfactory
agreement between the experimental and the calculated
values of [ f
]
ph
led the authors to the conclusion that
trapped entanglements do not have a significant contribution
to the elastic response of the network. If the effective degree
of interlinking is enhanced by discrete entanglements,
the values of [ f
]
ph
deduced from elastic or swelling meas-
urements should exceed the chemical values of kTj=V
0
calculated from the chemistry of crosslinking.
Gottlieb et al. [54] reached the opposite conclusion by
the analysis of data on PDMS from different sources, in-
cluding the same data set of Mark and Sullivan [113]. They
argue that trapped entanglements contribute substantially to
the stress. Erman and Flory [39] criticized this interpretation
on several grounds. Their main criticism was that Gottlieb
et al. [54] confined their attention to stresses at small strains
and did not deduct the contribution to the reduced stress
from restraints on junction fluctuations. In the analysis of
Gottlieb et al. such fluctuations are assumed to be totally
suppressed at small strains, as if k ¼1for all networks,
and the contribution arising from the constraints is treated
as a constant fraction of the reduced stress. This procedure
may enhance the reduced forces by factors that increase
with decreasing crosslink density, and lead to a finite
value of [ f
]
ph
at j ¼ 0. According to Flory and Erman
[39] the large entanglement contribution in the analysis
conducted by Gottlieb et al. [54] is largely a fiction of
their data treatment.
A comprehensive analysis of previously reported stress–
strain data for five different elastomers both in the swollen
and unswollen states was performed on the basis of the
Flory–Erman theory by Brotzman and Mark [114] (Table
29.1). They found that, in most cases, as the polymer vol-
ume fraction decreases, the value of k required to describe
the experimental data also decreases. The analysis also
revealed that when z is set to zero the high-extension inter-
cept of the [ f
]
ph
vs. a
1
curves is practically independent
of the degree of swelling. In Table 29.2 the values of 2C
1
and 2C
1
þ 2C
2
obtained for the same networks by using the
linear Mooney–Rivlin equation of the reduced force,
[ f
] ¼ 2C
1
þ 2C
2
a
1
, are listed. The 2C
1
values are in
reasonable agreement with the [ f
]
ph
data given in Table
29.1, indicating that the Mooney–Rivlin treatment can yield
similar estimates of the cycle rank of the network as does the
more detailed theoretical approach. Poorer agreement was
found between [ f
]
ph
and 2C
1
by Sharaf and Mark [115].
These authors re-examined the small-strain modulus data
reported for unswollen PDMS model networks (Table 29.3).
The values [ f
]
ph
were found two- or threefold lower than
the corresponding values of 2C
1
. For comparison in Table
29.4 the characteristic quantities of the same PDMS model
networks are given in terms of the entanglement model (see
Eq. (29.46)).
Fontaine et al. [116,117] compared the prediction of the
constrained chain models with the results of elongation
measurements performed on dry and swollen natural rubber,
poly(ethylene oxide), polybutadiene, poly(dimethylsilox-
ane) and cis-1,4-polyisoprene networks. In Table 29.5 the
parameters obtained by analysis of the same network sys-
tems using both the CC and the MCC models are listed. It
was found that the strong dependence of the reduced force
on extension and swelling, observed in all the experiments,
can be satisfactorily described by the constrained chain
models. The value of the parameter, k
G
, varies between
0.9 and 6.0 for all five network systems investigated. (The
other parameter, jkT= V
0
, required to describe the strain and
swelling dependence of the data is obtained directly from
the experimental stress–strain isotherms at a
1
¼ 0.) In the
framework of the Flory–Erman model quantitative agree-
ment between the theory and the data for the polybutadiene
and poly(ethylene oxide) networks has been achieved only
when both k and the phantom modulus jkT=V
0
were
allowed to be dependent on w. The formulation according
to the constrained chain models, however, does not require
w dependent values of jkT=V
0
and k
G
.
Kloczkowski, Mark, and Erman [95] compared the pre-
diction of the diffused constraint model with the results of
the Flory constrained-junction fluctuation theory [36] and
the Erman–Monnerie constrained chain theory [94]. They
found that the shapes of the [ f*] vs. a
1
curves for all three
theories were very similar. Rubinstein and Panyukov [101]
reanalyzed the data of Pak and Flory [118] obtained for
uniaxially deformed crosslinked PDMS samples. They con-
cluded that the fit of the experimental data by the diffused
POLYMER NETWORKS AND GELS / 511

TABLE 29.1. Parameters of the stress–strain isotherms calculated from the fit of the Flory–Erman model for different networks
systems [114].
Polymer
a
Diluent f Crosslinker T (8C) w [f
]
ph
(MPa) kz
PDMS [134] Lin. PDMS 4 g-Irradiation 30 1.00 0.0325 7.66 0.00
0.80 0.0317 4.79 0.00
0.60 0.0317 4.10 0.00
0.40 0.0318 3.96 0.00
1.00 0.0355 6.75 0.05
0.80 0.0334 4.91 0.05
0.60 0.0330 5.02 0.05
0.40 0.0333 4.69 0.05
1.00 0.0366 6.94 0.10
0.80 0.0341 6.09 0.10
0.60 0.0335 7.72 0.10
0.40 0.0343 9.96 0.10
PDMS [134] Lin. PDMS 4 g-Irradiation 30 1.00 0.0245 14.3 0.00
0.80 0.0238 4.74 0.00
0.60 0.0232 4.63 0.00
0.40 0.0221 4.35 0.00
PDMS [134] Lin. PDMS 4 g-Irradiation 30 1.00 0.0146 15.3 0.00
0.80 0.0139 8.23 0.00
0.60 0.0129 10.8 0.00
0.40 0.0130 4.77 0.00
PBD-S [135] 1,2,4-Trichlorobenzene 4 1% Sulfur 25 1.00 0.222 7.93 0.00
0.80 0.213 6.43 0.00
0.60 0.204 6.74 0.00
0.40 0.192 8.07 0.00
0.20 0.212 5.21 0.00
1.00 0.245 6.83 0.05
0.80 0.232 6.04 0.05
0.60 0.227 5.47 0.05
0.40 0.219 7.68 0.05
0.20 0.231 12.0 0.05
1.00 0.250 10.3 0.10
0.80 0.237 7.77 0.10
0.60 0.232 8.12 0.10
0.40 0.229 25.0 0.10
0.20 0.240 4.81 0.10
PBD-G [135] 1,2,4-Trichlorobenzene 4 g-Irradiation 10 1.00 0.107 20.2 0.00
0.80 0.097 16.4 0.00
0.60 0.98 9.77 0.00
0.40 0.93 8.11 0.00
0.20 0.93 6.78 0.00
24 10 1.00 0.162 24 0.00
0.80 0.135 20 0.00
0.60 0.127 22.8 0.00
0.40 0.111 27.2 0.00
0.20 0.101 29.7 0.00
PBDG-P [135] 1,2,4-Trichlorobenzene 4 1% BPO 10 1.00 0.147 2.96 0.00
0.80 0.143 2.16 0.00
0.60 0.142 1.42 0.00
0.40 0.142 0.84 0.00
0.20 0.140 1.07 0.00
24 10 1.00 0.164 18.2 0.00
0.80 0.153 16.1 0.00
0.60 0.143 17.7 0.00
0.40 0.138 25.4 0.00
0.20 0.136 23.0 0.00
512 / CHAPTER 29

constraint model was significantly better than by the
Mooney–Rivlin expression or by the nonaffine tube model
[97].
Urayama et al. [119–121] tested the diffused constraint
model using both uniaxial compression and equibiaxial
elongation data for end-linked PDMS networks in which
trapped entanglements were dominant in number relative
to chemical crosslinks. The parameter k was used as an
empirical fitting parameter, and the best-fit procedure
yielded k ¼ 2:9. The structural parameters (n, j, m, f )
were estimated from the stoichiometry using the Miller–
Macosko model [56] in conjunction with the measured sol
fraction. They concluded that the diffused constraint model
successfully reproduced the reduced stress–strain data over
a wide range of deformations, but the model underestimated
the modulus, G, because it did not consider trapped en-
tanglements as additional crosslinks contributing to G. The
theoretical value of G calculated using k ¼ 2:9 was approxi-
mately one order of magnitude smaller (G¼5.22 kPa) than
the experimental value (G¼64.9 kPa).
TABLE 29.1. Continued.
Polymer
a
Diluent f Crosslinker T (8C) w [f
]
ph
(MPa) kz
PIB [136] 1,2,4-Trichlorobenzene 4 Disulfide 30 1.00 0.082 10.0 0.00
0.80 0.083 2.44 0.00
0.60 0.073 3.98 0.00
0.40 0.070 2.65 0.00
20 1.00 0.166 3.22 0.00
0.80 0.104 3.74 0.00
0.60 0.104 2.75 0.00
0.40 0.095 3.14 0.00
15 1.00 0.131 3.95 0.00
0.80 0.123 4.11 0.00
0.60 0.119 2.16 0.00
0.40 0.107 1.21 0.00
POE [137] Phenylacetate 3 Triisocyanate 25 1.00 0.721 1.14 0.00
0.597 0.637 1.58 0.00
0.565 0.549 2.26 0.00
0.488 0.337 14.8 0.00
0.390 0.608 1.58 0.00
POE [137] Phenylacetate 3 Triisocyanate 25 0.429 0.608 1.56 0.00
0.325 0.240 2.52 0.00
0.220 0.259 0.960 0.00
POE [137] Phenylacetate 3 Triisocyanate 25 0.457 0.314 1.29 0.00
0.341 0.345 1.19 0.00
0.291 0.314 1.29 0.00
0.488 0.337 14.8 0.00
0.390 0.608 1.58 0.00
POP [138] Benzene Tris(p-phenylisocyanate) 60 0.216 0.285 2.0 0.00
0.216 0.315 2.2 0.00
M
c
¼ 3,000 0.286 0.400 1.5 0.00
M
c
¼ 2,000 0.286 0.417 1.7 0.00
0.273 0.376 1.7 0.00
M
c
¼ 1,025 0.406 0.805 0.5 0.00
0.421 0.773 0.5 0.00
M
c
¼ 725 0.464 0.750 0.5 0.00
0.456 0.769 0.5 0.00
M
c
¼ 730 0.473 0.725 0.4 0.00
0.477 0.758 0.4 0.00
0.440 0.755 0.4 0.00
M
c
¼ 740 0.522 0.695 0.5 0.00
0.519 0.645 0.4 0.00
M
c
¼ 725 0.480 0.850 0.5 0.00
0.510 0.829 0.4 0.00
a
PDMS: poly(dimethylsiloxane); PDB: cis-1,4-polybutadiene; PIB: polyisobutylene; POE: poly(oxyethylene); POP: poly(oxy-
propylene).
POLYMER NETWORKS AND GELS / 513

TABLE 29.2 Mooney–Rivlin parameters of the stress–strain isotherms for different networks systems [114].
Polymer Diluent f Crosslinker T (8C) w 2C
1
(MPa) 2C
1
þ 2C
2
(MPa)
PDMS Lin. PDMS 4 g-Irradiation 30 1.00 0.0304 0.0571
0.80 0.0298 0.0476
0.60 0.0299 0.0433
0.40 0.0305 0.0398
PDMS Lin. PDMS 4 g-Irradiation 30 1.00 0.0218 0.0533
0.80 0.0220 0.0365
0.60 0.0218 0.0324
0.40 0.0208 0.0290
PDMS Lin. PDMS 4 g-Irradiation 30 1.00 0.0118 0.0364
0.80 0.0121 0.0255
0.60 0.0117 0.0230
0.40 0.0126 0.0168
PBD-S
a
1,2,4-Trichlorobenzene 4 1% Sulfur 25 1.00 0.203 0.406
0.80 0.202 0.343
0.60 0.202 0.302
0.40 0.196 0.272
0.20 0.204 0.254
PBD-G 1,2,4-Trichlorobenzene 4 g-Irradiation 10 1.00 0.0904 0.280
0.80 0.0864 0.210
0.60 0.0915 0.167
0.40 0.0933 0.135
0.20 0.0878 0.117
24 10 1.00 0.0904 0.28
0.80 0.0868 0.210
0.60 0.0915 0.167
0.40 0.0933 0.135
0.20 0.0878 0.117
PBDG-P 1,2,4-Trichlorobenzene 4 1% BPO 10 1.00 0.142 0.228
0.80 0.140 0.178
0.60 0.138 0.160
0.40 0.138 0.150
0.20 0.142 0.144
24 10 1.00 0.164 0.168
0.80 0.140 0.178
0.60 0.138 0.160
0.40 0.138 0.150
0.20 0.135 0.144
PIB 1,2,4-Trichlorobenzene 4 Disulfide 30 1.00 0.072 0.159
0.80 0.083 0.103
0.60 0.074 0.0953
0.40 0.073 0.0777
20 1.00 0.113 0.165
0.80 0.0976 0.148
0.60 0.104 0.131
0.40 0.0905 0.115
15 1.00 0.128 0.194
0.80 0.123 0.170
0.60 0.114 0.145
0.40 0.108 0.114
POE Phenylacetate 3 Triisocyanate 25 1.00 0.744 0.934
0.597 0.660 0.795
0.565 0.613 0.722
0.488 0.575 0.732
0.390 0.593 0.715
POE Phenylacetate 3 Triisocyanate 25 0.429 0.251 0.320
0.325 0.231 0.296
0.220 0.263 0.266
514 / CHAPTER 29

It should be noted that the effect of G is cancelled when
reduced stress–strain data are analyzed. This explains the
success of this model in describing the shape of the experi-
mental curves. On the basis of the diffused constraint theory
a detailed comparison between theory and experiment on
swollen polymer networks has not yet been made.
TABLE 29.2 Continued
Polymer Diluent f Crosslinker T (8C) w 2C
1
(MPa) 2C
1
þ 2C
2
(MPa)
POE Phenylacetate 3 Triisocyanate 25 0.457 0.280 0.390
0.341 0.329 0.402
0.291 0.310 0.348
POP Benzene Tris(p-phenylisocyanate) 60 0.216 0.322 0.423
0.216 0.328 0.477
M
c
¼ 3,000 0.286 0.450 0.546
M
c
¼ 2,000 0.286 0.448 0.594
0.273 0.398 0.537
M
c
¼ 1,025 0.406 0.839 0.899
0.421 0.839 0.859
M
c
¼ 725 0.464 0.810 0.835
0.456 0.847 0.851
M
c
¼ 730 0.473 0.779 0.785
0.477 0.796 0.832
0.440 0.814 0.817
M
c
¼ 740 0.522 0.723 0.776
0.519 0.647 0.713
M
c
¼ 725 0.480 0.861 0.959
0.510 0.891 0.904
TABLE 29.3. Parameters of the stress–strain isotherms calculated from the Flory–Erman model for unswollen PDMS model
networks[115].
M
n
(g mol
1
) f [f
]
ph
(MPa) k 2C
1
(MPa) 2C
2
(MPa)
32,900 3 0.013 19.4 0.033 0.034
25,600 3 0.014 18.2 0.043 0.052
18,500 3 0.021 15.0 0.066 0.061
9,500 3 0.053 9.5 0.093 0.057
4,700 3 0.075 7.9 0.148 0.011
4,000 3 0.101 6.8 0.192 0.015
45,000 4 0.008 22.3 0.038 0.030
32,900 4 0.015 16.4 0.058 0.042
25,600 4 0.028 11.9 0.084 0.055
18,500 4 0.023 13.3 0.089 0.040
9,500 4 0.062 8.0 0.167 0.050
4,700 4 0.119 5.8 0.353 0.031
4,000 4 0.195 4.5 0.395 0.021
18,500 4 0.020 14.3 0.096 0.043
18,500 4 0.020 14.3 0.089 0.043
18,500 4 0.020 14.3 0.089 0.040
11,300 4 0.082 7.0 0.196 0.083
11,300 4 0.079 7.1 0.169 0.115
11,300 4 0.084 6.9 0.199 0.076
11,300 4 0.064 7.9 0.188 0.092
11,300 4 0.060 8.2 0.178 0.098
11,300 4 0.062 8.1 0.165 0.120
21,500 4 0.038 10.3 0.142 0.098
11,100 4 0.086 6.8 0.207 0.087
8,800 4 0.104 6.2 0.244 0.084
POLYMER NETWORKS AND GELS / 515

29.3.3 Determination of the Model Parameters from
Swelling Measurements
Swelling of elastomers in a solvent is a relatively simple
technique for the characterization of polymer networks.
Empirical information, such as the degree of swelling and
the elastic modulus, can be obtained by direct measure-
ments. Equilibrium swelling measurements and stress–
strain measurements are the most frequently used methods
for determining the relative degree of crosslinking. A quan-
titative analysis of the swelling data, however, requires
further considerations.
According to the Frenkel–Flory–Rehner hypothesis the
elastic and mixing contributions to the free energy are
additive, and the mixing free energy for the network is the
same as that of the corresponding uncrosslinked polymer. It
follows from these assumptions that the thermodynamic
activity of the solvent in the network contains two separable
contributions, a
1,c
and a
1,u
, representing the diluent activ-
ities in the crosslinked and the uncrosslinked polymers,
respectively, and the ratio a
1,c
=a
1,u
at identical concentra-
tions yields the elastic component of the solvent activity.
Experimental tests of this prediction have been performed
by differential sorption measurements first conducted by
TABLE 29.4. Parameters of the stress–strain isotherms for PDMS model networks calculated from the entanglement model
(Eq. (29.46)) [54].
M
n
(g mol
1
) fT(K) 10
5
G(Pa) 10
5
(vRT )(Pa) T
e
32,900 3 298 0.699 0.286 0.467
25,600 3 0.947 0.377 0.474
18,500 3 1.27 0.508 0.467
9,500 3 1.50 1.41 0.641
4,700 3 1.59 2.00 0.467
4,000 3 2.07 2.66 0.536
45,000 4 298 0.68 0.185 0.278
32,900 4 1.00 0.335 0.38
25,600 4 1.40 0.618 0.571
18,500 4 298 1.29 0.517 0.324
9,500 4 2.17 1.38 0.466
4,700 4 3.84 2.63 0.439
4,000 4 4.16 4.185 0.625
18,500 4 1.35 0.45 0.278
11,300 4 298 2.79 1.72 0.744
11,300 4 2.84 1.68 0.723
11,300 4 2.75 1.77 0.769
11,300 4 2.75 1.50 0.804
11,300 4 2.76 1.41 0.752
11,300 4 2.85 1.44 0.771
21,600 4 298 2.40 0.871 0.774
11,100 4 2.94 1.87 0.866
8,800 4 3.28 2.28 0.783
TABLE 29.5. Network parameters calculated by the constrained chain (CC) and modified constrained chain (MCC) models
[116,117].
System Crosslinker
a
w
jkT =V
0
(MPa) k
G
CC MCC CC MCC
cis 1,4- DCP 1.3% 0.197 0.312 0.325 1.1 0.9
Isoprene/ DCP 0.75% 0.165 0.215 0.220 1.6 1.6
benzene DCP 0.30% 0.133 0.115 0.125 3.0 2.5
T¼25 8C DCP 0.20% 0.112 0.083 0.092 3.8 3.0
DCP 0.10% 0.081 0.043 0.045 5.0 6.0
NR/n-decane DCP 0.24–1.0 0.150 0.170 3.0 2.0
PEO/phenylac. isocyanate 0.22–1.0 0.260 0.275 1.5 1.6
PBD/chl.benz. sulfur 0.2–1.0 0.235 0.235 2.0 2.6
PDMS/benzene el.radiation 0.32–1.0 0.125 0.135 2.5 2.0
a
DCP: dicumyl peroxide.
516 / CHAPTER 29
Gee et al. [122]. In this experiment on natural rubber/ben-
zene system the vapor pressure of the solvent and the
amount of solvent absorbed by the crosslinked and uncros-
slinked rubbers were determined simultaneously by using a
sensitive microbalance housed in a vacuum system. Similar
experiments were performed by Yen and Eichinger
[6], Brotzman and Eichinger [7–9], Neuburger and Eichin-
ger [10], Zhao and Eichinger [11] and McKenna et al.
[13–16]. Conventionally the results of these measurements
are given in term of the dimensionless swelling activity
parameter [15] (or dilation modulus [6–11])
S ¼ l ln (a
1,c
=a
1,u
): (29:55)
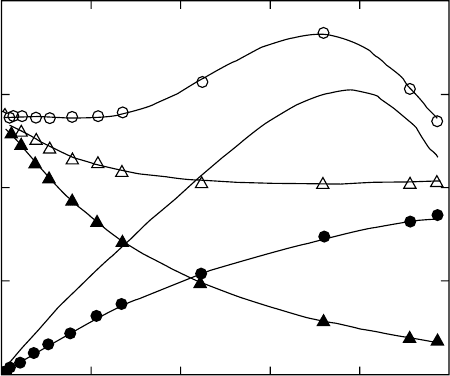
Typical theoretical and experimental S vs. w
1=3
( ¼ l)
curves are shown in Fig. 29.6. The phantom network theory
predicts constancy while the affine network model predicts a
monotonic increase of S with increasing w
1=3
. Many of the
experimental S vs. w
1=3
curves, including that of Gee et al.
[122] exhibit a maximum. This behavior is consistent with the
Flory–Erman theory, although the experimental peak is, in
general, much sharper and of significantly greater magnitude
than that predicted by the model. Neuburger and Eichinger
[10] determined the swelling activity parameter for poly(di-
methylsiloxane) networks in benzene and cyclohexane at 20
and 30 8C. They found that the benzene data at 20 8C can be
reasonably well described by the Flory–Erman model with
the parameters: j=(N
A
V
0
) ¼ 4:0910
4
mol=cm
3
, k ¼ 1:0,
and z ¼ 90 (this value of z is much bigger than that required
to fit the stress strain data). The value of the molecular weight
between crosslinks, M
c
, calculated from the equation
j=(N
A
V
0
) ¼ r=2M
c
was M
c
¼ 1,190 g=mol. It is signifi-
cantly smaller than the actual M
c
¼ 26,000 g=mol. Even
larger discrepancies were found between the calculated
and the actual values of M
c
for the PDMS/cyclohexane sys-
tem. In this case the best fit was obtained using the phantom
network model with j=(N
A
V
0
) ¼ 0:0012 mol=cm
3
corre-
sponding to M
c
¼ 406 g=mol. The authors concluded that
the deviation is the consequence of the breakdown of the
Frenkel–Flory–Rehner theory, namely the hypothesis that
the elastic and mixing free energies are separable.
McKenna et al. [13–16] performed similar investigations
on natural rubber networks swollen in different diluents.
They assumed that the elastic free energy contribution is
adequately described by the phenomenological Valanis–
Landel function (see Eq. (29.1)) and for the measured degree
of swelling they calculated it from the values of w
0
(l
s
)
determined in the unswollen state. Comparing these data
with the mixing contribution obtained by using Eq. (29.24)
they came to the conclusion that the value of the interaction
parameter for the crosslinked polymer, w
c
, exceeds that of the
solution of the uncrosslinked polymer, w
u
. This conclusion
has been supported by lattice model calculations of Freed
and Pesci [123], who pointed out that the effective inter-
action parameter depends on the crosslink density.
McKenna et al. [13–16] use the following relation for the
swelling activity parameter:
S ¼ l ln (a
1,c
=a
1,u
) ¼ (w
c
w
u
)l
5
þ V
1
w
0
(l)=RTl:
(29:56)
The important point to note from this equation is the as-
sumption that w
c
¼ w
u
often found in the use of the Frenkel–
Flory–Rehner hypothesis, has been suppressed. Hence the
first term on the right hand side of Eq. (29.56) provides
insight into the thermodynamics of swelling and in particu-
lar is in accord with the experimental observation that S 6¼ 0
as l ! 1, i.e., no swelling. A typical value for w
c
w
u
of
1.0
0.00
0.01
lIn(a
1,c
/a
1,u
)
Gee et al.
lIn(a
1,c
/a
1,u
)
calc
[V
1
W'(l)/(RTl)]
Gee
[V
1
W'(l)/(RTl)]
Exp
(x
c
−
x
u
)l
−5
0.02
Contributions of the swelling activity parameter
0.03
0.04
1.1 1.2
l
1.3 1.4
1.5
FIGURE 29.6. Thermodynamic parameters that contribute to the swelling activity parameter S vs. the swelling deformation
l
s
¼ w
1=3
. (After Ref. 15 see text for discussion).
POLYMER NETWORKS AND GELS / 517

0.027 can be obtained by examining the curve labeled
l ln (a
1,c
=a
1,u
)
Gee et al:
of Fig. 29.6 and taking the value at
l ¼ 1.
In Fig. 29.6 we show the thermodynamic parameters from
Eq. (29.56) and a comparison with the swelling data of Gee
et al [122]. The curve labeled l ln (a
1,c
=a
1,u
)
Gee et al:
refers to
the data obtained by Gee et al. for S. The curve labeled
l ln (a
1,c
=a
1,u
)
calc
refers to a calculation of S from Eq.
(29.56) using the values of (w
c
w
u
)l
5
depicted in the
plot on the curve so labeled summed with the values of
[V
1
w
0
(l)=RTl]
Exp
determined experimentally by measure-
ments on a rubber similar to that used by Gee et al. [122] and
depicted with solid circles. The solid line without points
labeled [V
1
w
0
(l)=RTl]
Gee
represents the value of the elastic
contribution that would have been needed to have in order to
agree with the Gee et al. [122] results for S, i.e., when added
to the measured values of (w
c
w
u
)l
5
. The deviation be-
tween the measured and calculated curves is significant, i.e.,
the crosslink dependence of the interaction parameter does
not provide an adequate explanation for the anomalous
behavior of the swelling activity parameter. The reader is
referred to McKenna et al. [13–16] for further discussion.
McKenna and Crissman [16] also investigated the effect of
temperature on the shape of the S vs. w
2=3
( ¼ l
2
) curves. In
the polyisoprene/benzene system they did not observe a max-
imum in S at 30 and 40 8C, rather a rapid decrease occurred
which was followed by a plateau region above l
2
¼ 1:2. At
50 8C, however, a pronounced maximum was found at
l
2
¼ 1:13. Neuburger and Eichinger [10] reported similar
changes in the swelling behavior for the PDMS/benzene
system in the temperature range between 20 and 30 8C. Simi-
lar results were reported for changing solvent quality by Zhao
and Eichinger [11]. Such abrupt changes in behavior imply
significant changes in the free energy of the network over a
narrow range of temperatures (or solvent qualities). None of
the existing network theories predicts such a possibility.
Sivasailam and Cohen [124] studied the effect of swelling
on the elastic modulus of end-linked polydimethyl siloxane
networks synthesized at the theta condition from a series of
molecular weight precursors (9,900 < M < 101,700) at
polymer concentrations from 100% to 40%. These networks
exhibited a minimal number of defects as they were prepared
from low polydispersity chains at an optimal ratio of cross-
links to precursor chains. The optimum ratio was chosen as
the one that produced the network with the highest elastic
modulus, the minimum equilibrium swelling, and the min-
imum soluble fraction. The wide range of precursor molecu-
lar weights allowed the investigation of the effect of trapped
entanglements as a function of the molecular weight.
Equilibrium swelling concentrations were determined in
PDMS oligomer (M
n
¼ 3; 900 g=mol), and the elastic
modulus was measured at three different states: in swelling
equilibrium (fully swollen state), at the concentration at
which the network was formed (reference state), and in the
unswollen (dry) state (Table 29.6 and Table 29.7). The
dependence of the modulus after cure, the dry modulus
TABLE 29.6. Elastic modulus of end-linked PDMS networks made at different precursor concentrations [124,126].
Molecular weight (g/mol) Diluent Volume fraction w
ref
*Sol fraction w% G
ref
(kPa)
101,700 1.00 2.60 111
PDMS 0.89 2.50 95
oligomer 0.79 1.28 72
0.74 2.10 62
0.67 2.99 50
71,500 1.00 0.28 176
PDMS 0.89 1.41 143
oligomer 0.78 0.75 98
0.49 1.84 48
0.40 1.67 27
30,200 1.00 0.26 210
PDMS 0.89 0.12 168
oligomer 0.78 0.13 150
0.70 0.05 106
0.59 0.96 85
0.50 2.50 61
0.40 4.90 39
9,900 1.00 0.25 343
PDMS 0.89 0.07 277
oligomer 0.80 0.05 251
0.69 0.98 193
0.57 3.04 147
0.51 6.90 123
*The negative value indicates that solvent is expelled from the swollen network by syneresis. In these gels the amount of
uncrosslinked polymer is practically negligible.
518 / CHAPTER 29

after solvent extraction, and the degree of equilibrium swell-
ing on precursor concentration during cure were compared
to scaling predictions. The experimental scaling exponents
were found to be strong functions of the molecular weight of
the precursor chains and for high molecular weight pre-
cursors their values approached the theoretical prediction
by Obukhov et al. [125] for entanglement-dominated net-
works. The authors concluded that for networks made of
high molecular weight chains a major contribution to the
modulus is from trapped entanglements. They also pointed
out that at molecular weights below the entanglement mo-
lecular weight the modulus of the network is affected by the
mutual interpenetration of interspersed chains.
The data of Sivasailam and Cohen were reanalyzed by
Graessley [126] in terms of the entanglement model.
According to this model the shear modulus at the reference
state G
ref
is the sum of crosslink and entanglement contri-
butions
G
ref
¼ n
ref
kT þ T
0
G
0
N
w
2:3
ref
, (29:57)
where G
0
N
is the plateau modulus of the polymer melt (for
PDMS G
0
N
¼ 0:2 MPa), T
0
is the entanglement trapping
factor, and w
ref
is the volume fraction of the polymer at
crosslinking. Assuming that the first term (crosslink contri-
bution) in Eq. (29.57) varies with the concentration as in the
phantom network, and the second term (entanglement con-
tribution) varies like the Mooney–Rivlin term C
2
, the fol-
lowing equations can be derived
G
ref
¼ G
0
w
ref
þ T
0
G
0
N
w
2:3
ref
, (29:58a)
G
swollen
¼ G
0
w
2=3
ref
w
1=3
þ T
0
G
0
N
w
ref
w
1:3
, (29:58b)
G
dry
¼ G
0
w
2=3
ref
þ T
0
G
0
N
w
2:3
ref
, (29:58c)
where G
0
( ¼ nkT) is the crosslink contribution in the dry
state (this excludes trapped entanglement effects). Using
Eqs. (29.58a–c) in conjunction with empirically obtained
data for T
0
and the sol fraction, the elastic moduli of these
gels were calculated (Table 29.7). No systematic deviation
can be observed between the predicted and measured
moduli.
Urayama et al. [127,128] made similar investigations on
end-linked PDMS networks cross-linked in solution. The
elastic moduli of gels made from M¼29,400g/mol and
M¼4,400 g/mol precursor chains were measured in the
fully swollen state in toluene (good solvent), and in the
reference state (Table 29.8). The sol fraction of these gels
was less than 10%. The same analysis described above
indicates that at high polymer volume fractions the calcu-
lated and experimental values agree fairly well, while at
high swelling ratios the deviation is pronounced [126]. The
discrepancy may be the consequence of structural and
chemical changes accompanied by the crosslinking process.
In general, the reasonable agreement between the pre-
dicted and measured values of the elastic modulus suggests
that the effect of swelling on the elastic properties can be
approximated as a sum of two distinct contributions: one
due to the chemical crosslinks and the other due to the
entanglements. The latter in polymer melts is independent
of chain lengths and represent an entanglement contribution
TABLE 29.7. Experimental and calculated values of the elastic modulus of end-linked PDMS networks swollen in PDMS oligomer
(M¼3,900 g/mol, theta solvent) and in the dry state [124,126].
Polymer volume fraction G
sw
(kPa) G
dry
(kPa)
Molecular weight (g/mol) w
ref
w
u
Exp. Calc. Exp. Calc.
101,700 1.00 0.38 59 37 111 111
0.89 0.37 62 32 105 87
0.79 0.34 45 27 82 68
0.74 0.32 36 23 71 60
0.67 0.23 16 16 57 49
71,500 1.00 0.48 129 84 175 191
0.89 0.44 110 70 148 150
0.78 0.37 61 52 105 116
0.50 0.30 36 29 77 51
30,200 1.00 0.51 153 121 210 229
0.89 0.47 130 101 172 185
0.78 0.45 109 87 159 148
0.59 0.37 67 59 98 95
0.50 0.33 48 48 72 74
9,900 1.00 0.62 280 258 342 363
0.89 0.59 240 228 286 310
0.80 0.56 212 203 263 270
0.69 0.52 161 175 208 226
0.57 0.47 133 141 172 182
POLYMER NETWORKS AND GELS / 519

when the network is formed. [126] Chemical crosslinks trap
a fraction of this contribution into the structure that governs
the elastic response of the network.
29.3.4 Analysis of the Experimental Results on the Basis
of the Scaling Theory
The validity of scaling laws has been tested on several
swollen network systems (Table 29.9). Munch et al. [99]
studied the concentration dependence of the shear modulus
for polystyrene model networks synthesized by copolymer-
ization of styrene and divinylbenzene and swollen to equi-
librium in benzene (good solvent for polystyrene). It was
found that the modulus obeys a scaling law with equilibrium
concentration, similar to that obtained for semidilute poly-
mer solutions. The best fit to the equation G ¼ Bw
n
e
yields
B¼4,200 kPa and n¼2.28. Hild et al. [129] compared the
concentration dependence of the shear moduli of poly(ethyl-
ene oxide) networks crosslinked by aliphatic pluriisocyanate
in two diluents: dioxane and water. The corresponding scal-
ing laws were found: G ¼ 8,430w
2:30
e
kPa (in 1,4-dioxane)
and G ¼ 10,400w
2:51
e
kPa (in water). The exponent obtained
in 1,4-dioxane is in excellent agreement with the prediction
of the scaling theory. However, for the same networks
swollen in water a significantly higher exponent, n¼2.51,
was obtained. They assumed that the deviation from the
theoretical exponent is due to the insolubility of the urethane
linkages in water, which may induce inhomogeneities in
the gels at the molecular level. Hecht and Geissler [130]
investigated the elastic properties of polyacryamide gel
homologs in a theta solvent (water–methanol mixture, 3:1
by volume). They found that in the concentration range
0:07<w<0:3 the longitudinal elastic modulus, E
L
, obtained
TABLE 29.8. Elastic modulus and polymer volume fraction of end-linked PDMS networks at the preparation state and in the fully
swollen state in toluene (good solvent) [127,128].
Molecular
Polymer volume fraction
weight (g/mol) Diluent w
ref
w
sw
G
ref
(kPa) G
sw
(kPa)
29,400 toluene 1.0 0.187 113 33
0.852 0.155 93 27
0.709 0.126 63 17
0.544 0.093 30 73
0.411 0.078 19 47
0.281 0.055 9 2.3
0.179 0.038 3 0.9
4,400 toluene 1.0 0.275 680 251
0.777 0.216 423 149
0.654 0.208 330 137
0.601 0.194 297 119
0.584 0.195 301 113
0.504 0.180 241 100
0.381 0.140 150 53
0.298 0.109 61 29
TABLE 29.9. Power law exponents for the concentration dependence of the elastic modulus in swollen network homologs.
System T (8C) w A (kPa) nr Ref.
NR/n-decane 20 0.06–0.40 4,500 2.06 0.992 [139, 140]
PS/benzene 20 0.05–0.20 4,200 2.28 0.955 [99]
PS/benzene 25 0.05–0.50 4,140 2.35 0.993 [99]
PS/cyclohexane 37 0.12–0.28 1,750 3.14 0.980 [28]
PEO/dioxane 25 0.03–0.35 8,430 2.30 0.984 [129]
PEO/water 25 0.03–0.30 10,401 2.51 0.992 [129]
PHPMA 25 0.08–0.35 2,590 2.59 0.995 [129]
PDMS/toluene 25 0.10–0.40 2,650 2.20 0.988 [23]
PVAC/toluene 25 0.06–0.30 2,430 2.27 0.990 [22]
PVAC/acetone 25 0.05–0.25 4,420 2.25 0.992 [22]
PVAC/isopropanol 70 0.10–0.60 3,388 2.31 0.977 [132]
PAA/water 25 0.03–0.30 4,880 2.23 0.991 [141]
PVA/water 25 0.03–0.30 3,500 2.11 0.993 [139]
NR: natural rubber; PS: polystyrene; PEO: poly(ethylene oxide); PHPMA: poly(hydroxi-ethyl-methacrylate); PDMS: polydi-
methylsiloxane; PVAC: poly(vinyl acetate); PAA: poly(acryamide); PVA: poly(vinyl alcohol); r: correlation coefficient.
520 / CHAPTER 29