Martienssen W., Warlimont H. (Eds.). Handbook of Condensed Matter and Materials Data
Подождите немного. Документ загружается.

372 Part 3 Classes of Materials
4
2
0
–2
–4
–6
–8
–10
0
Temperature (K)
10
0
–10
–20
–30
–40
–50
500 1000 1500
Thermoelectric power (µ VK
–1
)
Pd
Pt
Os
Ru
Ir
Rh
Cu
Ag
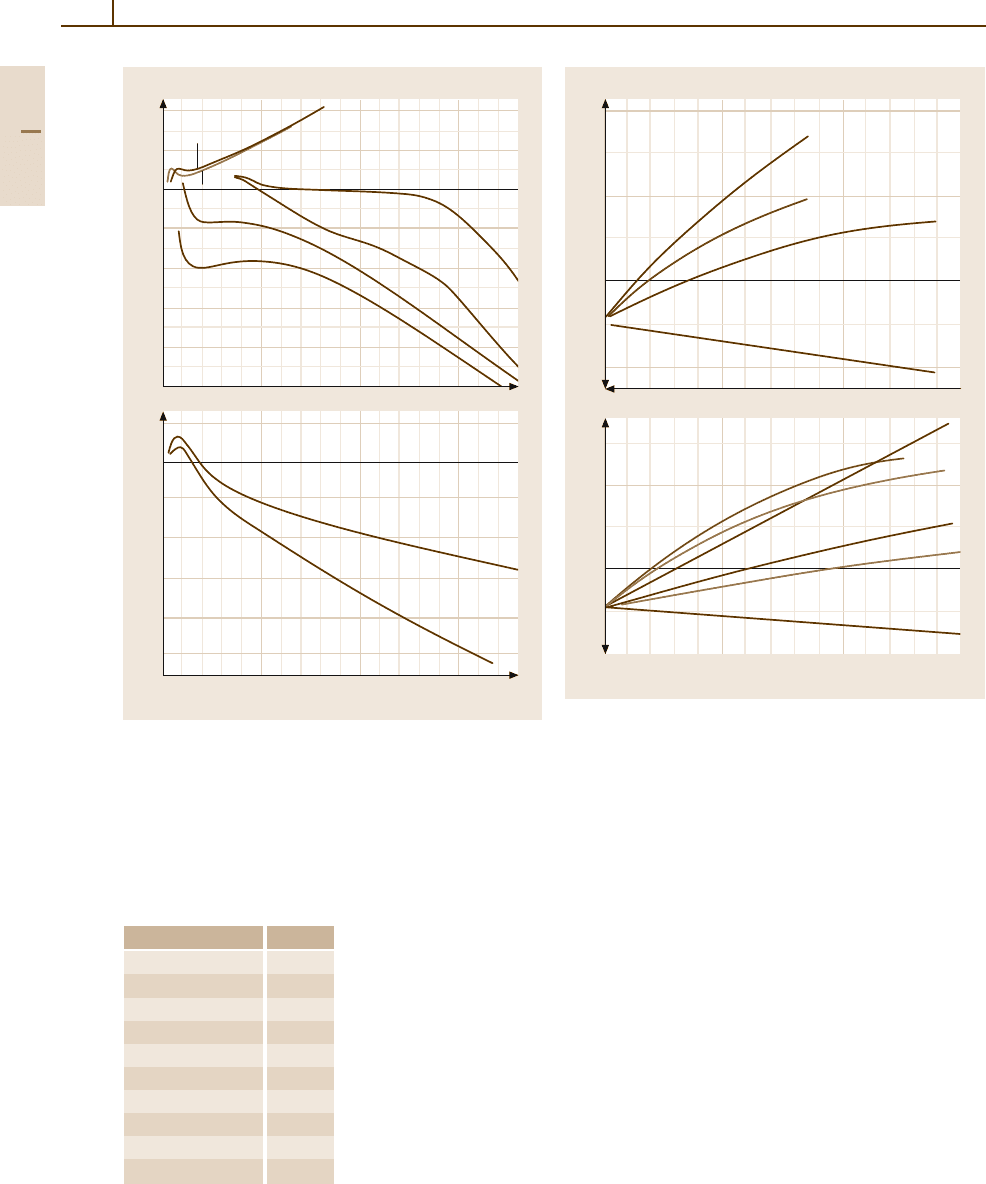
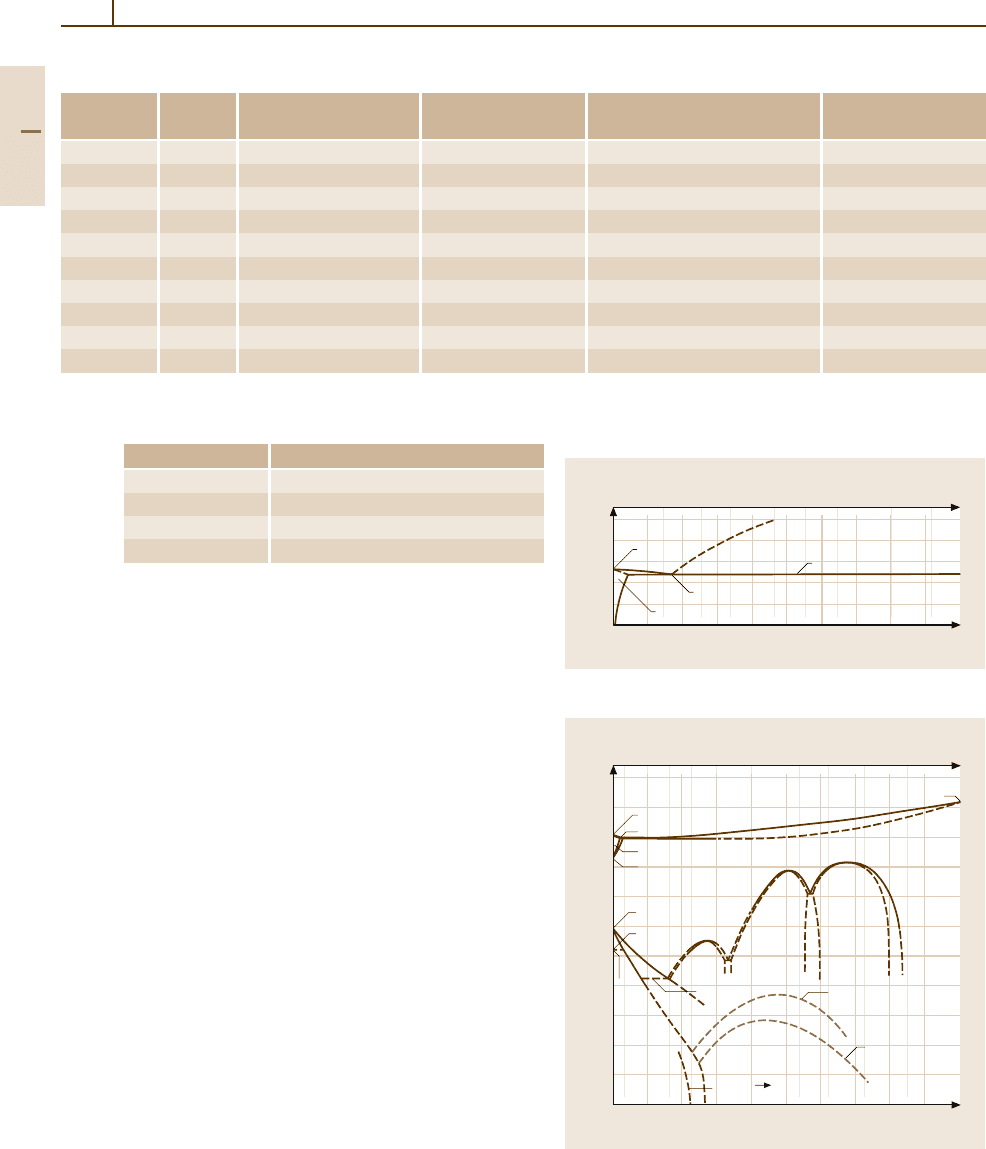
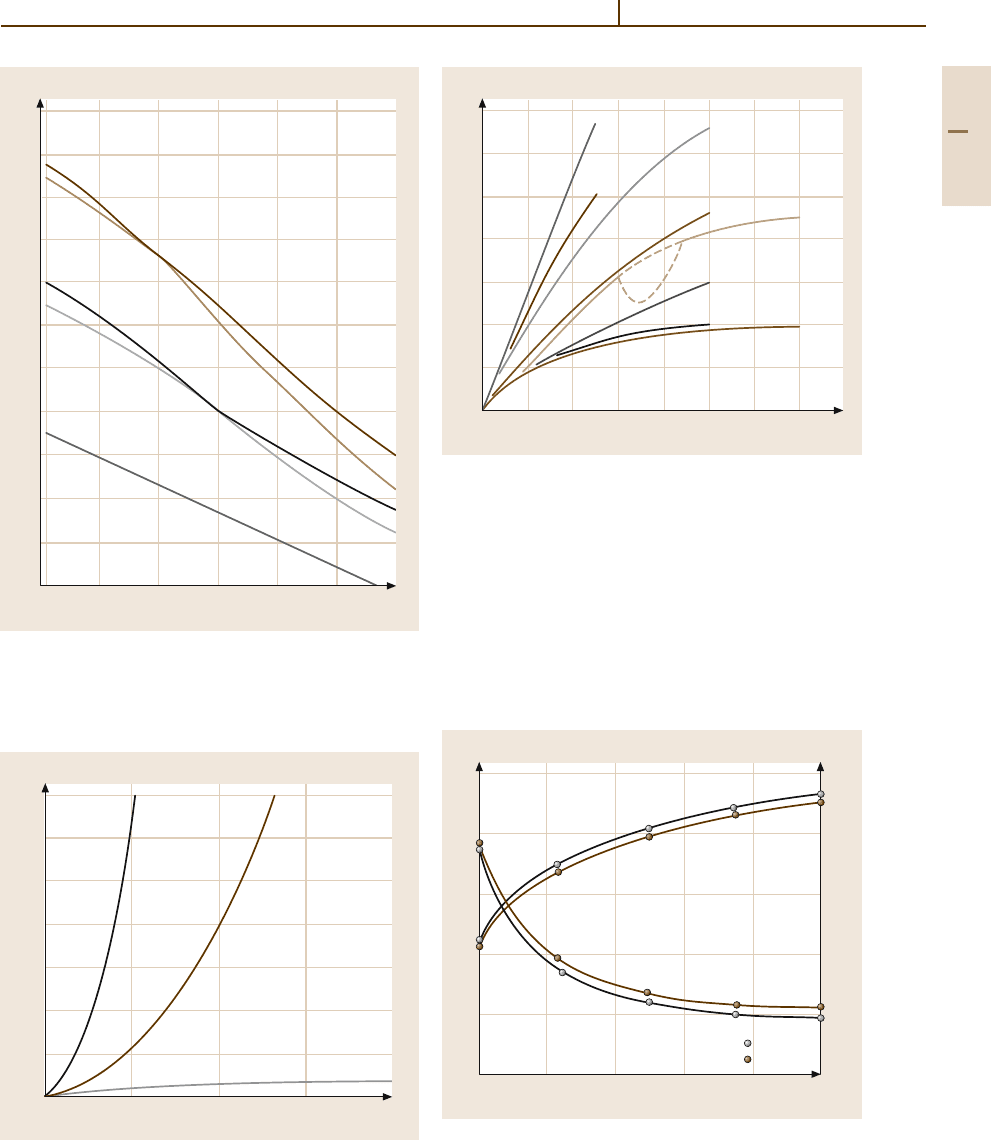
Fig. 3.1-269 Thermoelectric power of the platinum group
metals [1.218, p. 58]
Magnetic Properties. All PGMs show magnetostriction
in a magnetic field. The reversible change of length is
proportional to the square of the applied magnetic field
(Table 3.1-211) [1.217,218]. The paramagnetic suscep-
tibilities of Pd and Pd alloys decrease with increasing
Metal S
l
Ru −1.4
Rh 11
Pd −39.4
Ir 3.8
Pt −32
Rh
0.50
Ir
0.50
9.5
Rh
0.50
Pd
0.50
27
Ir
0.60
Pd
0.40
13.4
Pd
0.67
Pt
0.33
−17.4
Pd
0.33
Pt
0.67
−79
Table 3.1-211
Magnetostriction of
platinum-group metal
and platinum-group metal
alloys, expressed by
the factor S
l
of pro-
portionality according
to ∆l/l = S
l
H
2
[1.217,
p. 161]
40
20
0
–20
wt % Pd
20
0
–20
95 90 85
Pd
Pd
E
A, Pt
(mV)
W
Re
Ir
Bi
Pt
Au
t
2
= 900 °C
t
1
= 0 °C
Mo
Ru
Rh
Ag
t
2
= 900 °C
t
1
= 0 °C
Fig. 3.1-270 Thermal electromotive force of Pd alloys at
900
◦
C (reference junction at 0
◦
C) [1.216, p. 97]
temperature (Figs. 3.1-271, 3.1-272) [1.217,218]. Al-
loying with 0.05 wt% Rh raises the susceptibility from
88× 10
−10
m
3
/mol to 160× 10
−10
m
3
/mol. Pd
−
Cu
alloys are diamagnetic up to 50 at.% Pd. The suscep-
tibilities of the ordered phases in this system are higher
than those of the disordered solid solution phase. The
paramagnetism of Pd decreases by dissolution of H
2
to
reach zero at PdH
0.66
and above. Partial ordering within
FePd raises its coercive field from the disordered value
of 2 to 260 Oe [1.281, 282].
Part 3 1.10
Metals 1.10 Noble Metals and Noble Metal Alloys 373
1.4
1.2
1.0
0.8
0.6
0
Temperature (K)
200 400 600
Relative susceptibility, χ(T)/χ(293)
Pd
Pt
Rh
Ru
Ir
Os
Rh
Pt
Pd
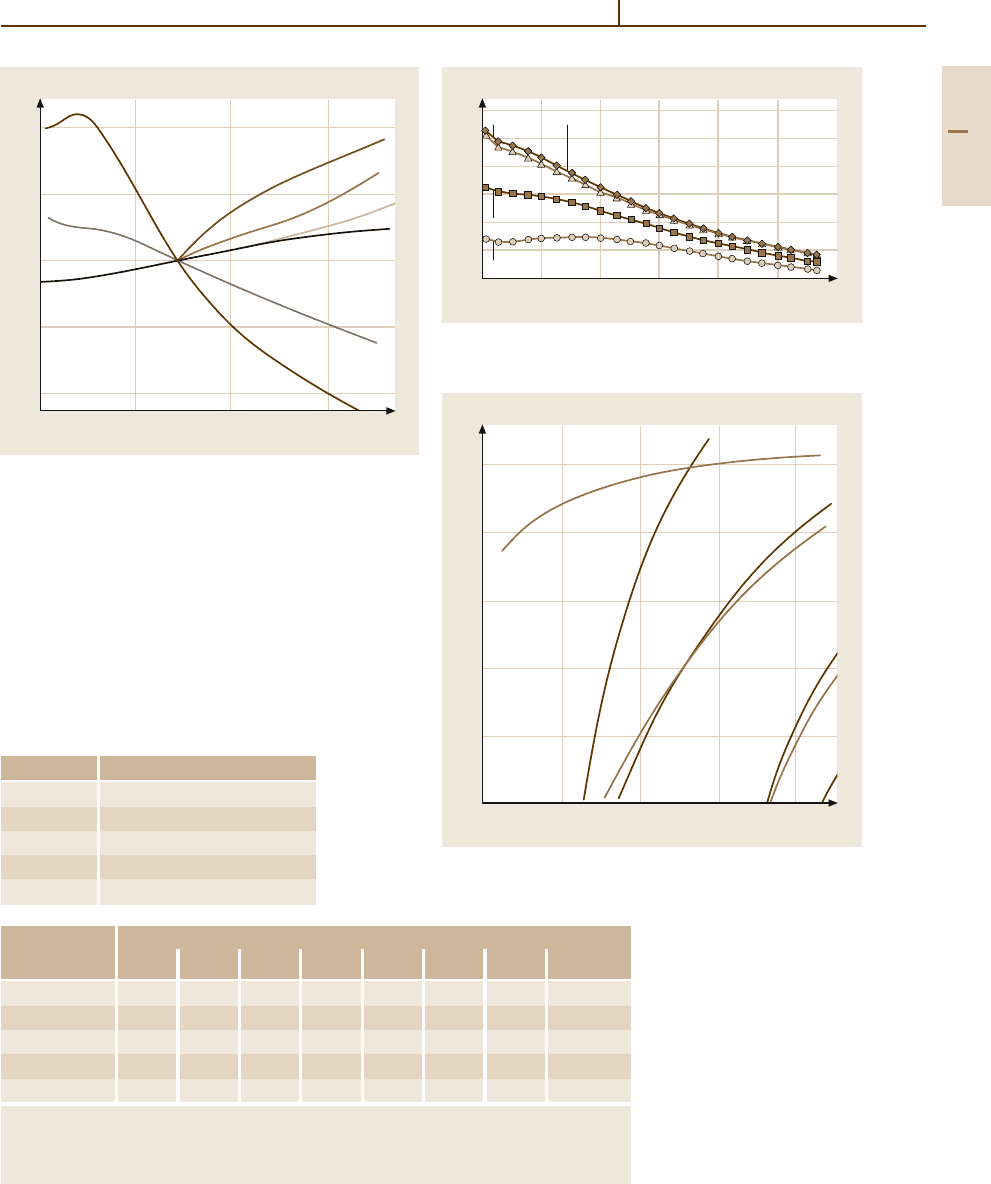
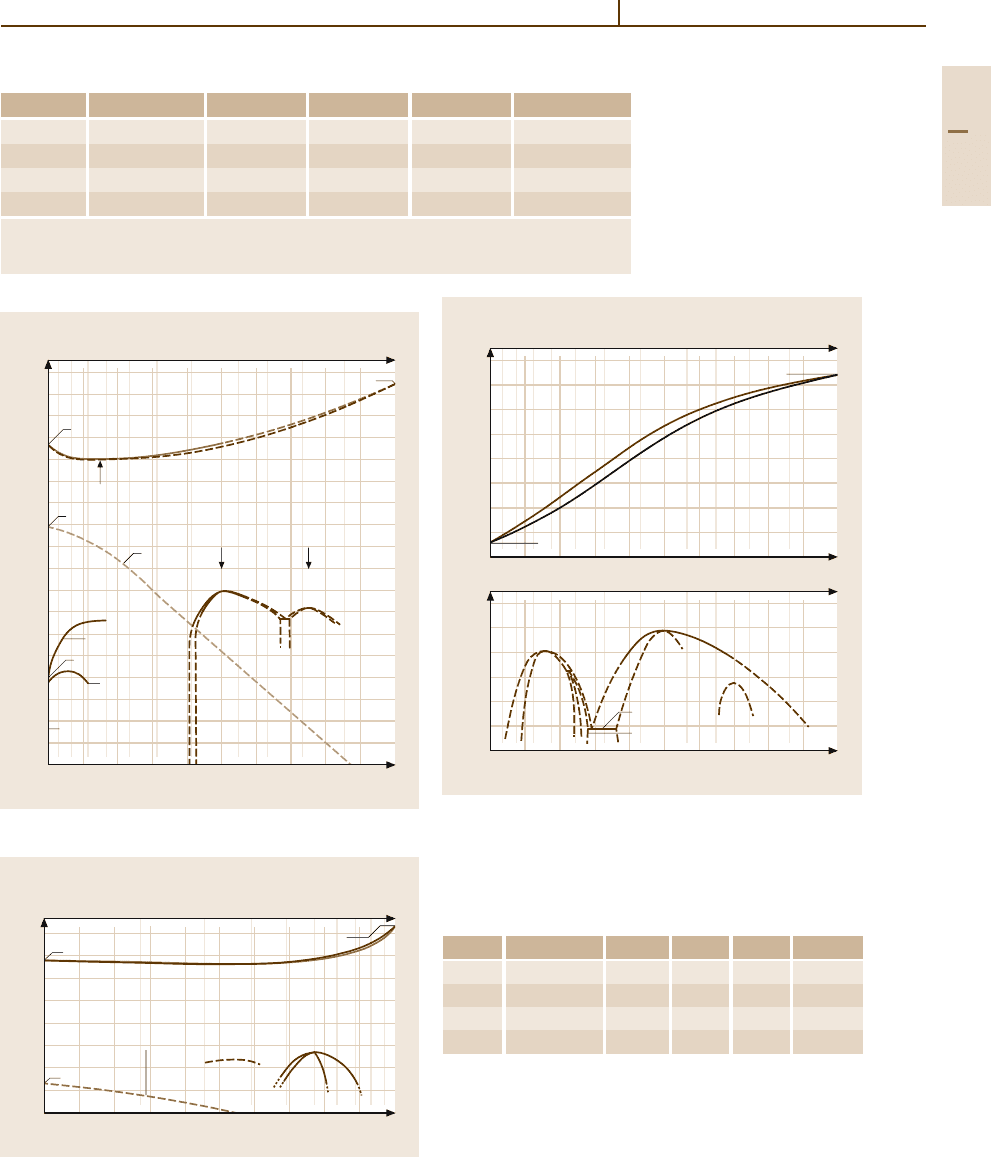
Fig. 3.1-271 Temperature dependence of the magnetic sus-
ceptibility of the platinum group metals [1.218, p. 98]
Thermal Properties.
Selected data of thermal conduc-
tivity and thermal expansion of PGM and PgAg alloys
are given in Tables 3.1-212–3.1-215, Fig. 3.1-273. FePd-
alloys exhibit around the Fe
3
Pd stoechiometry in the
disordered state zero coefficient of thermal expansion
(Invar effect) [1.281,282].
Table 3.1-212 Recrystallization temperatures of platinum-
group metal (0
◦
C) (Depending on purity, degree of cold
forming an annealing time) [1.217, p. 216]
Metal Recryst. temperature (
◦
C)
Ir 1200–1400
Pd 485–600
Pt 350–600
Rh 700–800
Ru 1200–1300
Temperature Thermal conductivity (W/mK)
(
◦
C) Pd Pt Rh Ir Ru
a
Ru
b
Ru
p
Os
100 76 85.6 185 − 140 180 150 −
273 75.6 75.0 153 149 110 134 119 88
600 79.0 73.0 135 130 95 129 105 85
800 83.0 74.8 126 125 87 112 96 −
1200 88.2 83.2 118 117 77 101 83 −
a
vertical to the crystal c axis,
b
parallel to the crystal c axis
p
polycrystalline
Table 3.1-213 Thermal con-
ductivity of platinum-group
metal at different tempera-
tures [1.217, p. 153]
180
160
140
120
100
80
60
0 300
T (K)
50 100 150 200 250
χ
g
(10
–9
m
3
kg
–1
)
x = 0.050
Pd
1–x
Rh
x
x = 0.030
x = 0.015
x = 0.001
Fig. 3.1-272 Temperature dependence of the magnetic
mass susceptibility of Pd
−
Rh alloys [1.217, p. 169]
10
–3
10
–4
10
–5
10
–6
10
–7
10
–8
400
Temperature (K)
800 1200 1600 2000
Oxide vapour pressure (atm)
Ir
Pt
Rh
PtO
2
RhO
2
IrO
3
RuO
3
IrO
3
Fig. 3.1-273 Vapor pressures of platinum group metal
oxides [1.277, p. 178]
Part 3 1.10
374 Part 3 Classes of Materials
Table 3.1-214 Thermal expansion coefficient of the platinum-group metals [1.217, p. 154]
Temperature (
◦
C) Thermal expansion coefficients (10
−6
K
−1
)
Metal
Pd Pt Rh Ir Ru
a
Ru
b
Ru
p
Os
a
Os
b
Os
p
323 − − − − 5.9 8.8 6.9 4.0 5.8 4.8
373 11.9 9.1 8.5 6.7 − − − − − −
423 6.1 9.3 7.2 4.3 6.2 5.0
473 12.1 9.2 9.0 − − − − − − −
623 6.8 10.5 8.0 4.0 7.1 5.7
673 12.6 9.5 9.6 − − − − −
723 7.2 11.0 8.4 5.3 7.6 62
823 − − 9.6 − 11.7 8.8 5.8 8.3 6.9
1073 13.4 10.0 10.3 − − − − − −
a
vertical to the crystal c axis,
b
parallel to the crystal c axis
p
polycrystalline
Table 3.1-215 Thermal expansion coefficient of Pd
−
Ag
alloys [1.217, p. 154]
Temp. range (K) 373–473
Pd-content (%)
Thermal expansion coefficient
(10
−6
K
−1
)
20 16.2
50 14.7
80 12.4
Optical Properties. In Table 3.1-216 and Fig. 3.1-274
characteristic data are given. The optical reflectance of
Pd is increased by alloying with Ru (Fig. 3.1-275).
100
80
60
40
20
4000 8000
Wavelength (Å)
5000 6000 7000
Reflectance (%)
Pd
Pt
Ir
Rh
Fig. 3.1-274 Optical reflectance of the platinum group met-
als [1.220, p. 78]
Table 3.1-216 Spectral degree of emission ε of the
platinum-group metals at different temperatures [1.217,
p. 171]
Surface Temperature (
◦
C) Spectral emission
Ru
b
solid 1000 0.421
solid 2000 0.314
Os
b
solid 1000 0.526
solid 2000 0.383
Rh
a
solid < 1966 0.29
liquid > 1966 0.3
Ir
a
solid 927–2027 0.3
solid 2000 0.383
Pd
a
solid 900–1530 0.33
liquid 1555 0.37
Pt
a
solid 1000 0.371
solid 1400 0.421
liquid 1800 0.38
a
650 nm;
b
655 nm
Part 3 1.10
Metals 1.10 Noble Metals and Noble Metal Alloys 375
75
70
65
60
55
50
0.2 1.4
Wavelength (µm)
0.6 1.0
Reflectance (%)
Pd
Pd-5% Ru
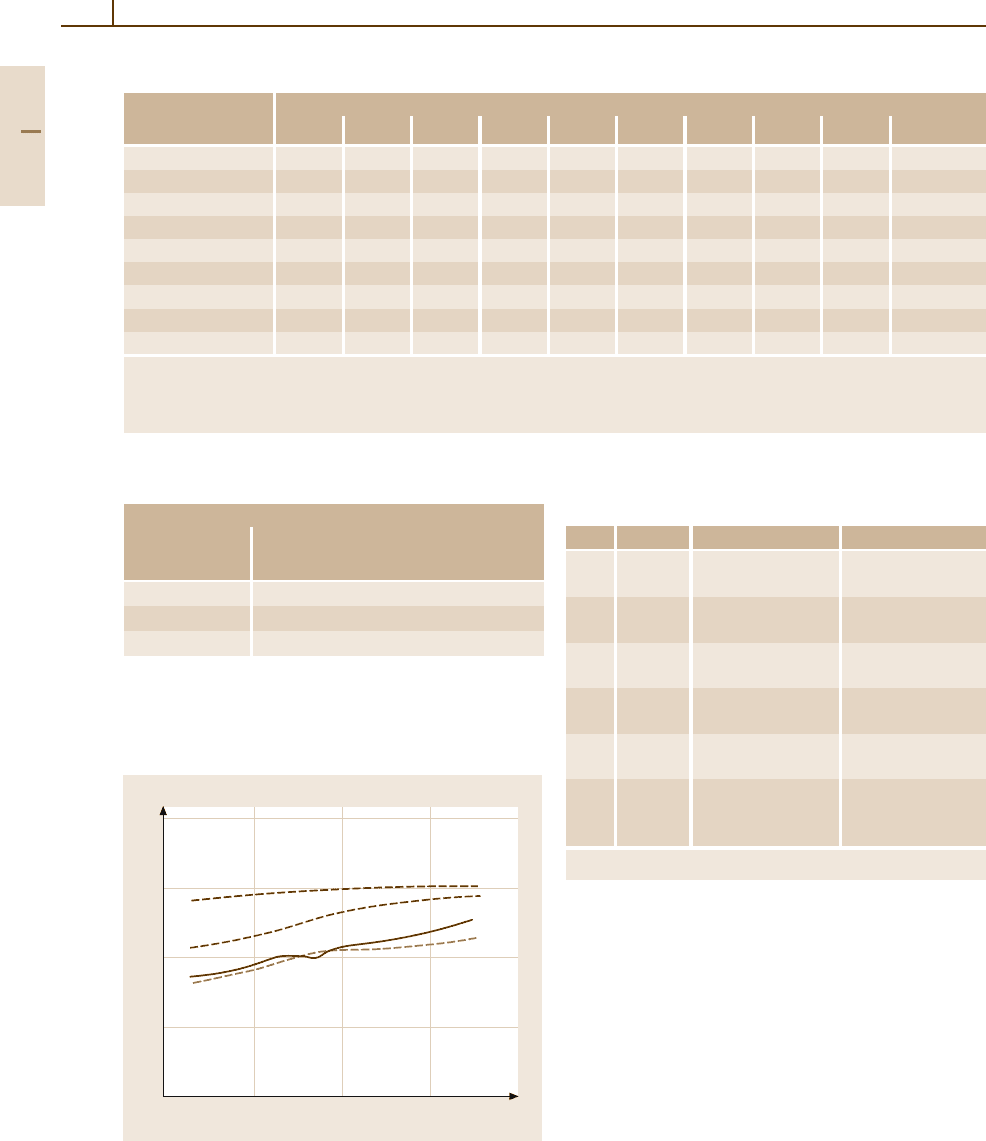
Fig. 3.1-275 Optical reflectance(%) of PdRu5 alloy[1.228,
p. 700]
Diffusion.
Data for selfdiffusion, diffusion of tracer
elements and of hydrogen and oxygen are shown in
Tables 3.1-156, 3.1-158, 3.1-217.
Carbon diffuses very rapidly through Pd at elevated
temperatures in presence of a concentration gradient on
the surface.
Table 3.1-217 Self-diffusion in pure platinum-group met-
als [1.217, p. 149]
Element D
0
O T (K)
Lattice Ir(S) 0.36 438.8 2092–2664
diffusion
Pd(S) 0.205 266.3 1323–1773
Pt 0.33 285.6 1598–1837
Pt(S) 0.05 257.6 850–1265
Surface Rh(111) 4×10
−6
174 1200–1500 (Vac.)
diffusion
Pt 4×10
−7
108 1160–1580 (Vac.)
Chemical Properties. Pd has the reduction potential of
E
0
= 0.951 for Pd/Pd
2+
. It is resisant against reducing
acids and in oxydizing media above pH 2. Alkali melts
attack above ∼400
◦
C. In oxygen atmosphere between
400 and 800
◦
C are thin PdO-surface layers formed,
which dissociate above 800
◦
C. Above 1100
◦
C occur
increasing weight losses by evaporation (Fig. 3.1-276).
Catalysis: Pd and Pd alloys are effective catalysts in
numerous chemical reactions. In heterogenous catalysis,
10
3
100
10
1
0.1
0.01
10
–3
10
–4
10
–5
512
1/T (10
4
/K)
1400
67891011
1200 1000 900 800 700 600
Rh
Pt
Pd
Ru
Os
Ir
Linear weight loss
(mg/cm
2
h)
Temperature (°C)
Fig. 3.1-276 Weight losses of the platinum group metals at
annealing on air [1.217, p. 183]
PGM are applied in form of wire nets and of powders
with high specific surfaces (20 to 1000 m
2
/g, “platinum
black”, “palladium black”) on carbon or Al
2
O
3
supports.
Automotive gas cleaning catalysts use of Pd–Pt–Rh
alloys in different compositions.
Special Alloys. Tables 3.1-159, 3.1-160, 3.1-218 show
typical compositions of Pd containing brazing alloys,
Table 3.1-219 Pd containing jewelry alloys. PdAg40
has a very low temperature coefficient of resistivity
(0.00003/
◦
C between 0 and 100
◦
C, electrical resis-
tivity 42 µcm). It is used for precision resistance
wires (Fig. 3.1-268). Pd60Ni35Cr5 is corrosion resis-
tant against molten salt mixtures up to 700
◦
C, suited for
brazing graphit, Mo and W.
Ti
−
Pd
−
Ni and Fe
−
Pd alloys show shape mem-
ory effects. Partial replacement of Pd in the alloy
Fe30 at.% Pd by > 4 at.% Pt decreases the temperature
of the f.c.c./f.c.t. martensite transformation and effects
strengthening.
Part 3 1.10
376 Part 3 Classes of Materials
Table 3.1-218 Physical properties of some technical Pd and Pt alloys [1.231, p. 67]
Material Density Melting point (interval) Electrical conductivity Temperature coefficient Modulus of elasticity
(g/cm
3
) (
◦
C) (m/ mm
2
) of electrical resistance (10
3
K
−1
) (kN/mm
2
)
Pt(99.9) 21.45 1773 9.4 3.92 16–17
PtIr5 21.5 1774–1776 4.5 − 18.5–19.5
PtIr10 21.6 1780–1785 5.6 2.0 ca. 22
PtRu10 20.6 ca. 1800 3.0 0.83 ca. 23.5
PtNi8 19.2 1670–1710 3.3 1.5 ca. 18
PtW5 21.3 1830–1850 2.3 0.7 ca. 18.5
Pd(99.99) 12.0 1552 9.3 3.77 ca. 12.5
PdCu15 11.3 1370–1410 2.6 0.49 ca. 17.5
FdCu40 10.4 1200–1230 3.0 0.28 ca. 17.5
PdNi5 11.8 1455–1485 5.9 2.47 ca. 17.5
Table 3.1-219 Composition and melting temperature range
of selected Pd-jewellery alloys [1.217, p. 511]
Alloy Melting temperature range (
◦
C)
Pd95Cu3Ga2 1340–1400
Pd95Cu5 1400–1460
Pd95Ni5 1450–1490
Pd50Ag47.5Cu2.5 1200–1280
Platinum and Platinum Alloys
Applications. Platinum and platinum alloys are im-
portant constituents of catalysts (chemistry, automotive
exhaust gas cleaning, fuel cells), sensor materials (ther-
mocouples, resistance thermometers), strong permanent
magnet alloys, magnetic and magnetooptical (mem-
ory) devices, high temperature and corrosion resistant
structural parts, and electrical contacts and connect-
ing elements. Classical applications are jewelry and
dentistry alloys.
Commercial grades are sponge and powder in puri-
ties varying from minimum 99.9% to 99.95% (ASTM
B 561-86). High purity electronic grade is 99.99%.
Production. Platinum sponge or powder are compacted
by pressing and sintering. Melting and alloying is done
in electrical heated furnaces in Al
2
O
3
or MgO crucibles,
by vacuum arc and by electron beam melting 99.98%.
Phases and Phase Equilibria. Selected phase diagrams
are shown in Figs. 3.1-277–3.1-281 [1.219]. Thermo-
dynamic data are given in Tables 3.1-190 – 3.1-193 and
3.1-220 [1.216, 217,222]. For compositions and crys-
tal structures, see Tables 3.1-196, 3.1-219, 3.1-222,
3.1-221 [1.217, 219]. Platinum forms continuous solid
3000
2600
2200
1800
1400
1000
Pt C
C (at. %)
123 5710 2040
10 20 30 40 50 60 70 80 90
T (K) C (wt %)
16.8 (10)
1978 (13) K
2042 K
C-Pt
L + graphite
(Pt) + graphite
(Pt)
Fig. 3.1-277 Binary phase diagram Pt
−
C [1.219]
2200
2000
1800
1600
1400
1200
1000
800
600
400
200
0
Fe Pt
10
10 20 30 40 50 60 70 80 90
Pt (at. %)
30 40 50 60 70 80 85 90 95
(Fe
3
Pt) (α-Fe)
T (K) Pt (wt %)
T
c
(ordered)
T
c
(γ)
(α-Fe)
(Fe
3
Pt)
(FePt) (FePt
3
)
T
c
1043 K
1185 K
> 823 K
< 973 K
≈1573 K
≈1623 K
(γ-Fe, Pt) or γ
1667 K
(δ-Fe)
1792 K
1811 K
2042 K
Fe-Pt
Fig. 3.1-278 Binary phase diagram Pt
−
Fe (dash-dotted
line: Curie temperature) [1.219]
Part 3 1.10
Metals 1.10 Noble Metals and Noble Metal Alloys 377
Table 3.1-220 Thermodynamic data of Pt [1.217, p. 109]
T (K) c
p
(J/K mol) S (J/K mol) H (J/mol) G (J/mol) p (at)
298.15 25.857 41.631 0 12.412 8.26 × 10
−92
400 26.451 49.314 2.664 −17.961 1.30 × 10
−66
800 28.593 68.313 13.677 −40.973 9.75 × 10
−30
1400 31.731 85.111 31.776 −87.38 5.84 × 10
−14
T = Temperature, c
p
= specific heat capacity, S = Entropy, H = Enthalpy,
G = free Enthalpy, p = partial pressure of the pure elements
2100
2000
1900
1800
1700
1600
1500
1400
1300
1200
1100
1000
900
800
700
600
500
400
300
Co Pt
Pt (at. %)
10
10 20 30 40 50 60 70 80 90
20
30
40
50
60
70
80
85
90
95
T (K) Pt (wt %)
On cooling
On heating
695 K
1098 K
≈1023 K
1394 K
1768 K
1703 K
≈15
(α-Co, Pt)
Co-Pt
T
c
CoPt CoPt
3
(ε-Co)
2042 K
Fig. 3.1-279 Binary phase diagram Pt
−
Co [1.219]
1700
1500
1300
1100
900
700
500
300
100
0 100
Pt (wt %)
10
10 20 30 40 50 60 70 80 90
Ni
20
30
40
50
60
70
80
90
100
Temperature (°C) Platinum (at. %)
361°C
Magnetic
transformation
Ni
3
Pt
(Ni, Pt)
NiPt
L
1455°C
1769.0°C
Fig. 3.1-281 Binary phase diagram Pt
−
Ni [1.219]
2100
2000
1900
1800
1700
1600
1500
1400
1300
Cu Pt
Pt (at. %)
10
1200
1100
1000
900
800
700
600
20
30
40
50
60
70
80
85
90
95
10 20 30 40 50 60 70 80 90
a) T (K)
Pt (wt %)
b)
Cu-Pt
Cu-Pt
(Cu, Pt)
≈1005 K
≈1085 K
(CuPt)
(Cu
3
Pt)
≈691 K
1D-LPS
?
(Cu, Pt)
L
1357.87 K
2042 K
Fig. 3.1-280a,b Binaryphase diagrams Pt
−
Cu. (a) Liquid–
solid.
(b) Solid–solid (1-D LPS = one-dimensional
long-period superstructure) [1.219]
Table 3.1-221 Crystal structure and lattice parameters of
intermediate phases of Pt oxides [1.219]
Phase Structure Type a (nm) b (nm) c (nm)
PtO tetragonal PtO 0.304 0.534
Pt
3
O
4
cubic Pt
3
O
4
0.6226
PtO
2
orthorhombic Fe
2
O
3
0.4533 0.4488 0.3138
PtO
2
hexagonal 0.310 0.435
solutions with all other noble metals and with Co, Cu, Fe,
and Ni. Miscibility gaps exist with C, Co, Ir, Pt, and Rh.
Primary solid solutions have fcc structure and the lattice
parameters correspond with few exceptions roughly to
Vegard’s law. Numerous intermediate phases exist in al-
Part 3 1.10

378 Part 3 Classes of Materials
Table 3.1-222 Structure and lattice parameter of selected intermediate Pt compounds [1.217, p. 119]
Phase Pearson Symbol a (nm) b (nm) c (nm) c/a Remarks Concentration x A(1 −x)B(x)
CoPt tP4 0.3806 0.3684 0.9679
CoPt
3
cP4 0.3831
CuPt hR32 0.7589 0.5
CuPt
3
cF4 0.3849
Cu
3
Pt o
∗∗
0.7596 0.2745 0.777
Cu
3
Pt cP4 0.3682
Fe
−
Pt cF4 0.376 0.245
FePt tP4 0.3861 0.3788 0.9811
Fe
3
Pt cP4 0.3727
NiPt tP4 0.3823 0.3589 0.9388
PtZr oC8 0.3409 1.0315 0.4277
Pt
3
Zr hP16 0.5624 0.9213 1.6328
loy systems with rare earth metals. The formation and
crystal structures of the intermediate phases have been
related to the electron configuration of the alloy compo-
nents (Engel–Brewer correlation) [1.283, 284]. Phases
with superlattice structures are formed with Co, Cu,
Fe, Nb, and V in atomic ratios of 1:1, 2:1, and 3:1
(Tables 3.1-123, 3.1-197). The ordered CuPt phase has
a long-range ordered rhombohedral structure.
Mechanical Properties. Characteristic data are shown
in Tables 3.1-223 – 3.1-226 [1.217], Figs. 3.1-282 –
3.1-290 [1.217, 228, 228, 231]. For elastic properties of
PGMs at different temperatures, see [1.217]. Strength-
ening is affected by solid solution hardening, order
hardening (Pt
−
Co, Pt
−
Cu), and dispersion hardening.
Dispersion-strengthened Pt and Pt alloys are remarkably
resistant to creep at high temperatures. They are pro-
Table 3.1-223 Elastic constants of Pt [1.217, p. 219]
c
11
c
12
c
44
347 173 76.5
Table 3.1-224 Mechanical properties of Pt (99.9%) at dif-
ferent temperatures (
◦
C) [1.217, p. 220]
T (
◦
C) E (GPa) R
m
(MPa) A (%) R
p0.2
(MPa) HV
20 173 135 41 50 55
250 169 110 40 40 53
500 159 78 42 30 50
750 140 44 46 20 35
900 126 34 44 17
a
23
a
interpolation
A = Elongation, E = Modulus of elasticity, R
p
= Limit of
proportionality, HV = Vickers hardness, R
m
= Tensile strength
Table 3.1-225 Mechanical properties of Pt as function of
reduction in thickness (%) by cold rolling [1.217, p. 220]
Reduction (%) R
m
(MPa) R
p
(MPa) HV
a b
0 250 140 50 40
20 350 310 70 63
59 400 380 84 73
a = Pt > 99.5%, b = Pt > 99.99%
Table 3.1-226 Tensile strength R
m
(MPa) and elonga-
tion A (%) of binary Pt alloys at different tempera-
tures [1.217, p. 217, 220]
Temperature (
◦
C)
Alloy compound
20 400 600
(wt%) R
m
/A
Au5 340/18 290/10 250/10
Ir10 260/33 240/27 180/33
Ni5 470/26 420/26 320/25
Pd20Rh5 370/30 290/18 240/23
Rh5 225/44 150/40 120/43
Rh10 287/39 200/33 170/38
duced either by co-precipitation with refractory oxides
(e.g., 0.16 vol% ZrO
2
) or by internal oxidation of alloys
with 0.2 wt% Cr or 0.8 wt% Zr. Rh additions improve
the solubility for oxygen. TiC powder affects disper-
sion strengthening in concentrations of 0.04–0.08 wt%
(Fig. 3.1-291) [1.277].
Part 3 1.10
Metals 1.10 Noble Metals and Noble Metal Alloys 379
400
20 100
x (at. %)
300
200
100
0406080
Modulus of elasticity E (GPa)
Rh
Ru
Cu
Pd
Ir
Pt
1–x
M
x
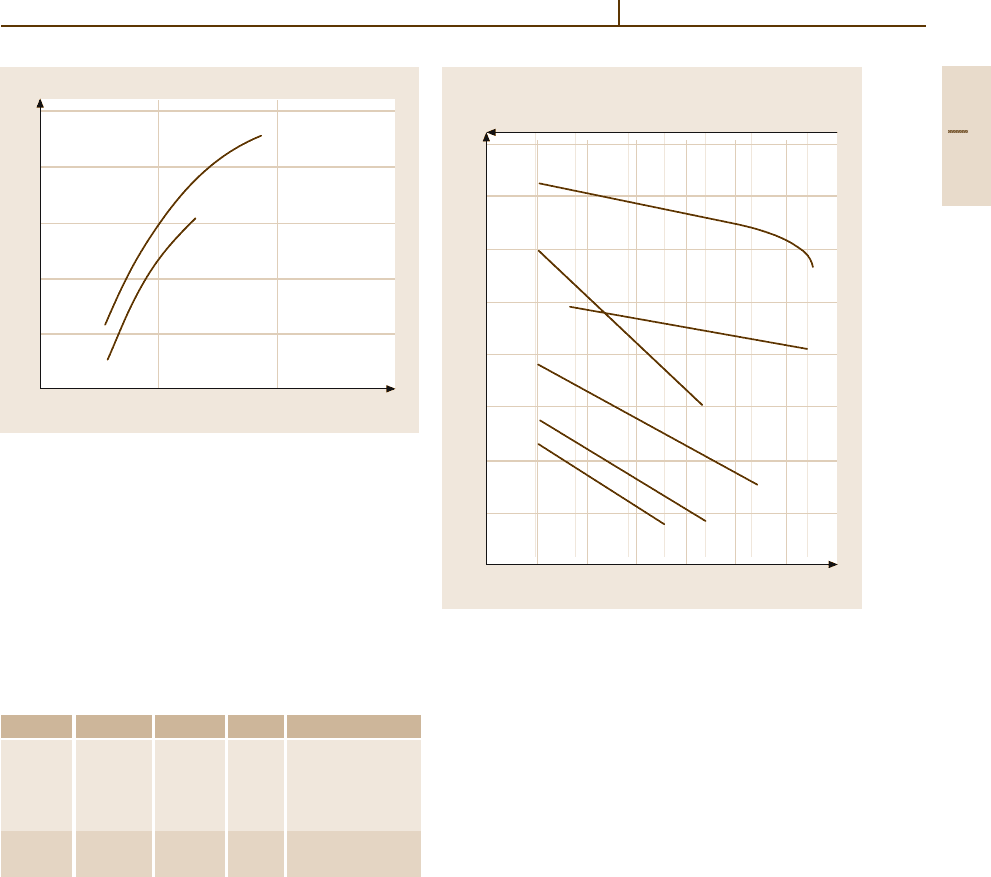
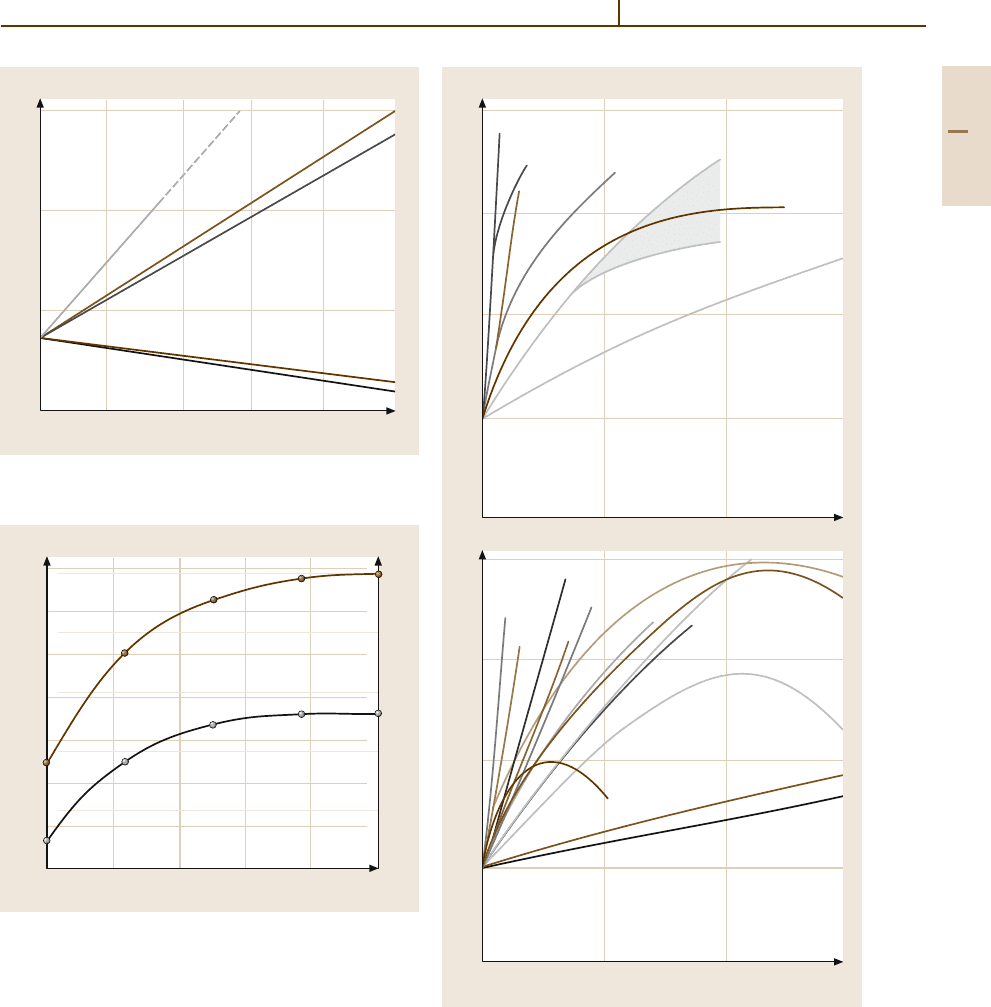
Fig. 3.1-282 Modulus of elasticity of binary Pt al-
loys [1.217, p. 222]
1750
1500
1250
1000
750
500
250
0
420
Nickel (%)
250
200
150
100
50
0
Pt 8 12 16
Tensile strength (MPa) Tensile strength (ksi)
Hard
Annealed
Fig. 3.1-284 Tensile strength of Pt
−
Ni alloys as a function
of Ni content [1.228, p. 695]
200
x (mass %)
0 10 20 30
150
100
50
200
150
100
50
0
0
Hardness (Hv)
a)
b)
Hardness (Hv)
Hardness (Hv)
Pd
Rh
Fe
Co
Ni
Mn
Ir
Cr
Re
Ru
Ma, W, Os
Ti,
V,
Zr
Nb
Ta
Ge, Be
Sn
Ga, In
Sb
Cu
Ag
1)
Au
2)
Au
Pt
1–x
M
x
Pt
1–x
M
x
Fig. 3.1-283a,b Solid solution hardening of binary Pt al-
loys
(a) de-alloyed at 900
◦
C; ( b) solution annealed at
1200
◦
C [1.217, p. 223]
Part 3 1.10
380 Part 3 Classes of Materials
1250
1000
750
500
250
0
010
Ruthenium (%)
160
120
80
40
0
Pt 468
Tensile strength (MPa) Tensile strength (ksi)
Hard
Annealed
Fig. 3.1-285 Tensile strength of Pt
−
Ru alloys as a function
of Ru content [1.228, p. 694]
2500
2000
1500
1000
500
0
2
Tungsten (%)
350
300
250
200
150
100
50
0
Pt 4 6 8
Tensile strength (MPa)
Tensile strength (ksi)
or hardness (HV)
Hard
Annealed
Hardness
Hardness
Tensile
strength
Tensile
strength
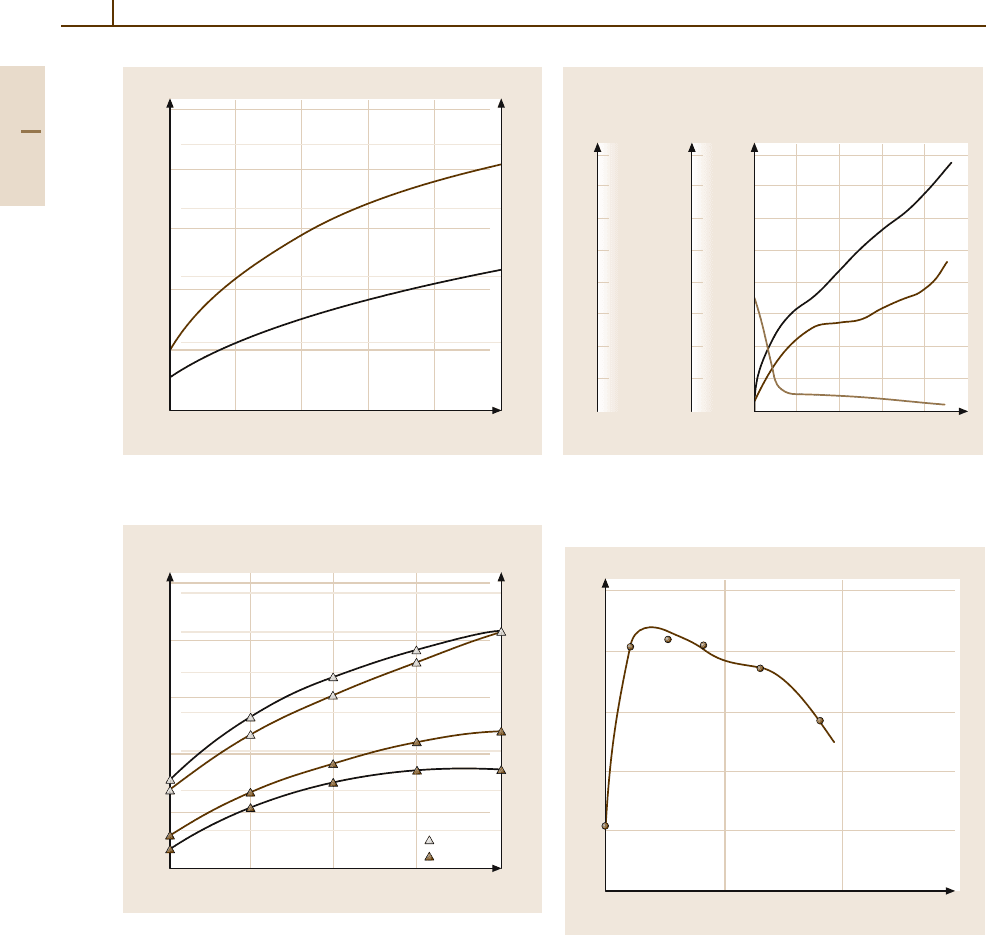
Fig. 3.1-286 Tensile strength of Pt
−
W alloys as a function
of W content [1.228, p. 697]
HV 10
350
330
310
290
270
250
230
210
190
20 100
Cold forming (%)
0406080
64
56
48
40
32
24
16
8
0
1400
1300
1200
1100
1000
900
800
700
600
Vickers
hardness
HV 10
Elongation
δ (%)
Tensile
strength
σ
B
(N/mm
2
)
σ
B
δ
Fig. 3.1-287 Mechanical properties of PtNi8 by cold form-
ing as a function of reduction of cross section [1.231,
p. 69]
400
350
300
250
150
0
1.0 100.0
Time (h)
0.1 10.0
Vickers hardness (kg/mm
2
)
Quenched
value
Fig. 3.1-288 Order hardening of stoichiometrc CuPt al-
loy [1.285, p. 49]
Part 3 1.10
Metals 1.10 Noble Metals and Noble Metal Alloys 381
440
400
360
320
280
240
200
160
120
80
40
0
1200
Temperature (°C)
RT 200 400 600 800 1000
Tensile strength (MPa)
Pt
*16 Pt
Pt Rh10
*16 Pt Rh 10
*40 Pt
Fig. 3.1-289 Tensile strength of dispersion hardened Pt and
PtRh10 (∗ grain stabilized with 0.16 and 0.40 vol.%ZrO
2
,
respectively) [1.217, p. 222]
0.35
0.30
0.25
0.20
0.15
0.10
0.05
0
1 1000
Time (h)
10 1000
True creep strain
Pure
platinum
10 % Rhodium –
Platinum
Dispersion – Strengthened Pt
Fig. 3.1-290 Creep curves of TiC-dispersion-strengthened
Pt and PtRh wire at 1400
◦
C in air [1.277]
450
400
350
300
250
200
150
100
216
Alloying element (%)
046810 12 14
Resistivity at 20 °C (68 °F) (nΩ m)
W
Cu
Ru
Os
Ni
Ir
Pd
Rh
Fig. 3.1-291 Effect of various alloying additions on the
electrical resistivity of binary Pt alloys [1.231, p. 67]
Electrical Properties.
Characteristic data are shown
in Tables 3.1-203, 3.1-205, 3.1-227 [1.217], and
Figs. 3.1-292 – 3.1-294 [1.217,228,231]. Mo–28 at.%Pt
(A15 structure) shows superconductivity at T
c
≈
4.2–5.6 K [1.286].
0.5
0.4
0.3
0.2
0.1
0
420
Ni (%)
400
300
200
100
0
Pt 8 12 16
Coefficient (%/K) Resistivity (nΩ m)
Hard
Annealed
Electrical resistivity
20 °C (68 °F)
Temperature coefficient
of resistivity
0 to 100 °C (32 to 212 °F)
Fig. 3.1-292 Electrical resistivity and temperature coeffi-
cient of resistivity (TCR) of Pt
−
Ni alloys as a function of
composition [1.228, p. 696]
Part 3 1.10