Martienssen W., Warlimont H. (Eds.). Handbook of Condensed Matter and Materials Data
Подождите немного. Документ загружается.

342 Part 3 Classes of Materials
Diffusion
Data for self-diffusion of Ag in Ag alloys and diffusion
of tracer impurity elements are shown in Tables 3.1-153–
3.1-158 andFigs. 3.1-210–3.1-212. Diffusionof H andO
is of importance for annealing treatments and dispersion
hardening [1.217,220, 226,235].
Table 3.1-153 Self-diffusion in binary homogeneous
Ag
−
Au alloys [1.217, p. 150]
Au (at.%) T (K) D
0
(10
4
m
2
/s) Q (kJ/mol)
Ag
−
Au (
110m
Ag diffusion)
8 927–1218 0.52 187.5
17 908–1225 0.32 184.4
83 923–1284 0.09 171.7
94 936–1234 0.072 168.5
Ag
−
Au (
198
Au diffusion)
8 991–1213 0.82 202.2
17 991–1220 0.48 198.0
83 985–1274 0.12 180.2
94 991–1283 0.09 176.1
Element D
0
(m
2
/s) Q (kJ/mol) T (K)
Lattice Ag 0.278 181.7 1038–1218
Ag(s)
a
0.67 190.1 913–1221
Au 0.107 176.9 623–733
Au(s)
a
0.027 165 603–866
Surface Ag 1×10
4
264 873–1173 (H
2
)
Ag 3×10
−5
49 580–730 (Vac.)
Au(110) 1×10
2
227 1138–1329 (H
2
)
Au 8×10
2
272 1200–1300 (Vac.)
Grain- Ag 7.24 × 10
−5
190.4 ∼790–680
boundary
Au 9.10 × 10
−6
174.6 625–521
a
(s) = single crystal
Table 3.1-154 Self-
diffusion in pure
Ag and Au [fre-
quency factor
D
0
(10
−4
m
2
/s)],
activation energy Q
(kJ/mol) [1.217,
p. 149]
Table 3.1-155 Diffusion of Ag in Cu and Cu in Ag [1.226, p. 365f.]
Ag in Cu
T (
◦
C) 485 574 625 731 794
D
Ag
4.9×10
−14
8.2×10
−13
2.91× 10
−12
7.7×10
−11
1.65× 10
−10
±0.1 ±0.6 ±0.08
D = D
0
exp(−E
A
/RT ) with D
0
= 0.61 cm
2
/s, E
A
= 46.5 kcal/g-at.
Cu in Ag
T (
◦
C) 498 597 760 800 895
D
Cu
2.87× 10
−13
5.08× 10
−12
3.55× 10
−10
5.9×10
−10
9.4×10
−10
±0.45 ±0.54
D
0
= 1.23 cm
2
/s, E
A
= (46.1 ±0.9) kcal/g-at.
10
12
D (m
2
s
–1
)
0.85
10
–13
6
4×10
–15
0.88 0.91 0.94 0.97
(10
–3
K
–1
)
1.03
8
10
–14
2
4
6
8
2
4
6
8
1.00
1/T
6.56 at. % Cu
4.16 at. % Cu
1.75 at. % Cu
Ag-Cu
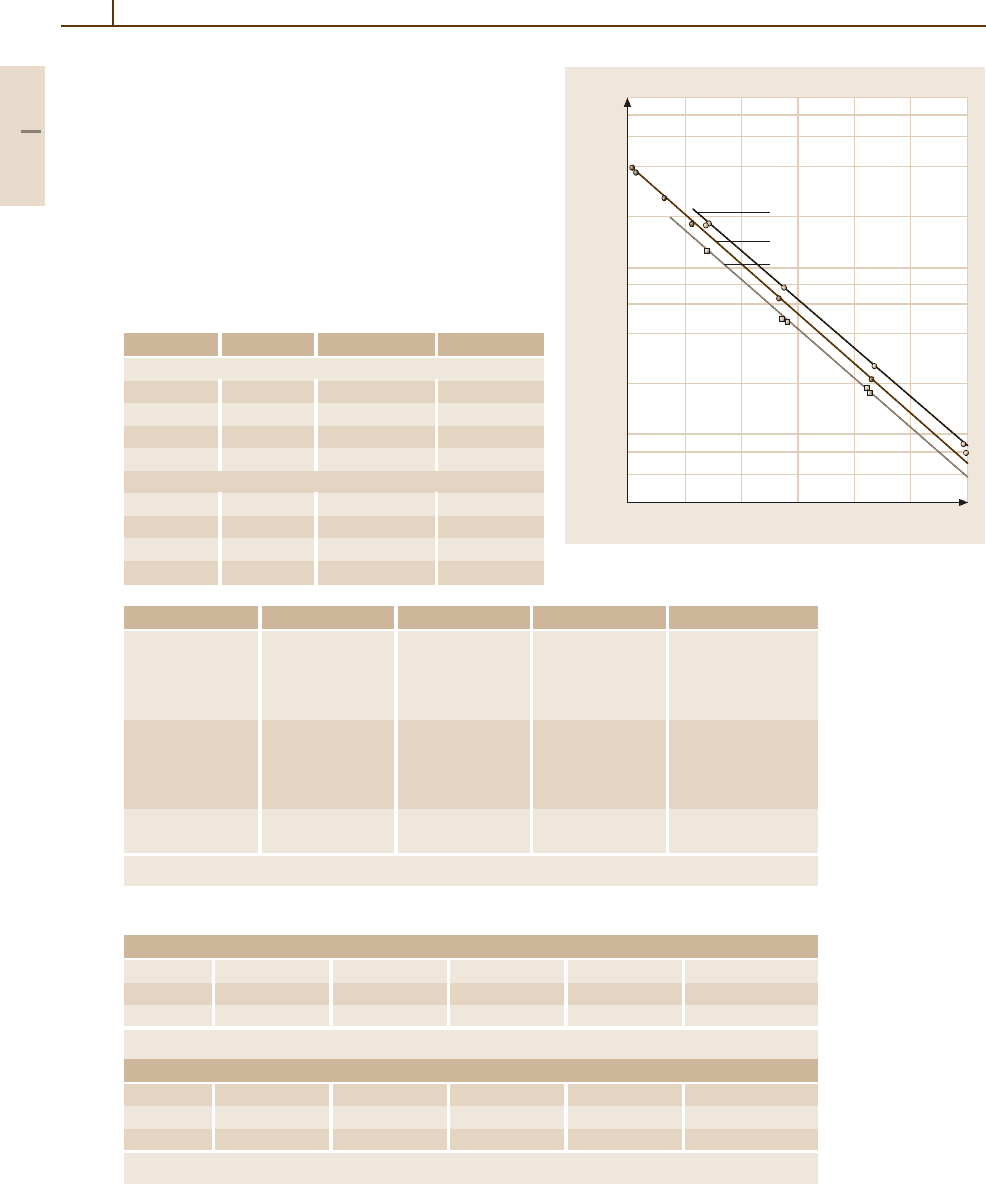
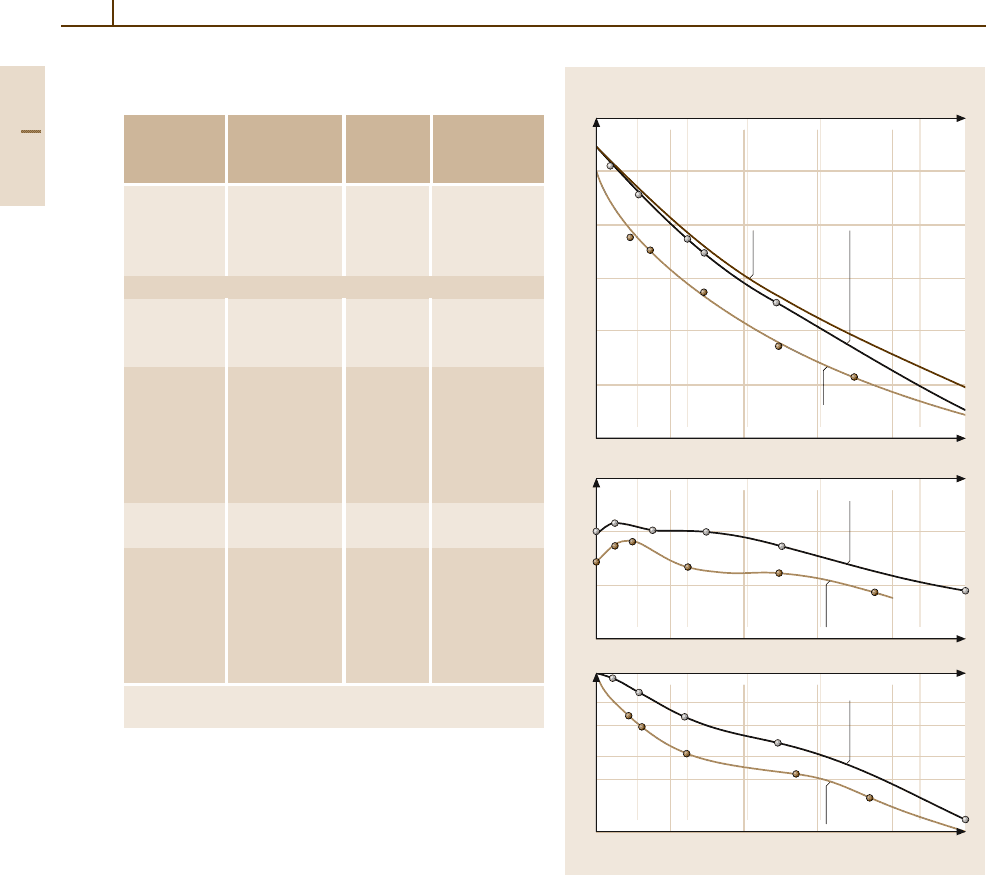
Fig. 3.1-210 Self-diffusion of Ag(110w) in Ag
−
Cu
(1.75–6.56 at.% Cu) alloys [1.238, p. 189]
Part 3 1.10
Metals 1.10 Noble Metals and Noble Metal Alloys 343
Table 3.1-156 Diffusion of impurities in Ag, Au, Pt and Pd [1.217, p. 151]
Tracer D
0
(10
−4
m
2
/s) Q (kJ/mol) T(K) Tracer D
0
(10
−4
m
2
/s) Q (kJ/mol) T(K)
Matrix: Silver (Ag) Matrix: Gold (Au)
Cu 1.23 193.0 990–1218 Pd 0.076 195.1 973–1273
0.029 164.1 699–897 Pt 0.095 201.4 973–1273
Au 0.262 190.5 923–1223 Ag 0.072 168.3 943–1281
0.41 194.3 929–1178 0.08 169.1 1046–1312
0.85 202.1 991–1198 0.086 169.3 1004–1323
0.62 199.0 Hg 0.116 156.5 877–1300
Pd 9.57 237.6 1009–1212 Matrix: Platin (Pt)
Pt 6.0 238.2 923–1223 Ag 0.13 258.1 1473–1873
1.9 235.7 1094–1232 Au 0.13 252.0 850–1265
Ru 180 275.5 1066–1219 Matrix: Palladium (Pd)
Fe 0.18 260 1373–1523
Table 3.1-157 Grain boundary tracer diffusion in pure
Ag [1.217, p. 150]
Matrix Tracer D
0
Q T
metal
(m
2
/s) (kJ/mol) (K)
Ag Cd 5.04 × 10
4
176.6 772–557
In 5.50 × 10
4
174.8 764–469
Sb 2.34× 10
4
163.5 771–471
Sn 4.72× 10
4
170.9 776–527
Te 2.10×10
4
154.7 970–650
Table 3.1-158 Diffusion of hydrogen and oxygen in Ag,
Pd, Pt, and Au [1.217, p. 151]
Matrix Gas D
0
(10
−4
m
2
/s) Q (kJ/mol) T(K)
Ag H 8.55 ×10
−3
30.11 947–1123
Ag O 3.66 ×10
−3
46.1 680–1140
Pd H 2.9×10
−3
22.19 473–1548
D 1.7×10
−3
19.88 218–233
T 7.2×10
−3
23.8 273–323
Pt H 6×10
−3
24.70 600–900
Au H 5.6×10
−4
23.61 773–1213
1.6
D (10
–13
m
2
s
–1
)
02040
Au (at.%)
10080
1.2
0.8
0.4
0
60
Ag-Au
(10
–3
K
–1
)
4 × 10
–12
0.85 1.30
1/T
2 × 10
–19
0.80
1200 (K)
T (K)
0.90 0.95 1.00 1.05 1.10 1.15 1.20
(m
2
s
–1
)
10
–12
10
–13
10
–14
10
–15
10
–16
10
–17
10
–18
1100 1000 900 800
1.25
T
m
= 1235 K
D
Matrix: Ag
Ge Sb Al
Cr
Ag
Hg
Au
Co
Fe
Pd
Hg
Pt
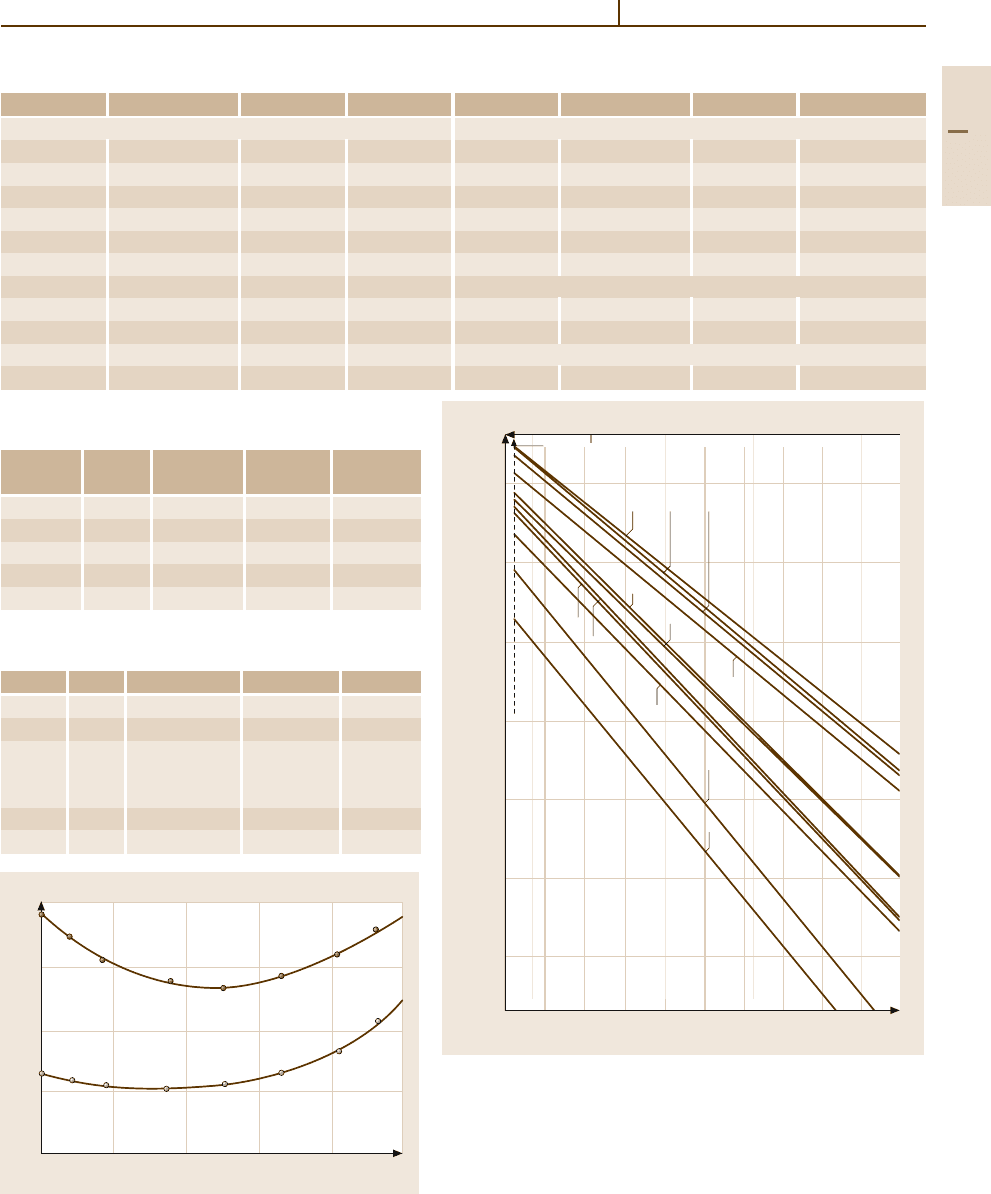
Fig. 3.1-211 Diffusion of impurities in Ag [1.238, p. 244]
Fig. 3.1-212 Self-diffusion of Ag(110w) (brown circles)
and Au(198) (gray circles)inAg
−
Au (8–94 at.%) Ag
−
Au
alloys [1.238, p. 190]
Part 3 1.10
344 Part 3 Classes of Materials
Chemical Properties
Silver has the reduction potential of E
0
=+0.8V for
Ag/Ag
+
. It is resistant against dry oxygen, air, non-
oxidizing acids, organic acids, and alkali. Water and
water vapor do not attack Ag up to 600
◦
C. Ag is dis-
solved in alkaline cyanidic solutions in the presence
of oxidizing agents, air, and oxygen. H
2
S attacks Ag
readily at room temperature, forming black Ag
2
S layers
(tarnish) [1.217].
Metallic Ag and Ag
−
Au alloys are heterogeneous
catalysts for oxidation processes, e.g., in the produc-
tion of ethylene oxide and formaldehyde applied as
grids or as powder preparations on Al
2
O
3
or carbon
substrates [1.217].
Ag-Based Materials
Binary alloys (Tables 3.1-159–3.1-161) [1.218]: Ag
−
Ni
alloys are grain-stabilized materials usually containing
0.15 wt% Ni. Ag
−
Cu alloys have manifold applications
in jewelry, silverware, brazes, and solders. Jewelry, sil-
Table 3.1-159 Noble metal containing soft solders [1.217]
Alloy Melting Density Tensile Elongation Eleasticity Thermal Electrical Thermal
(wt%)
range (
◦
C) (g/cm
3
) strength (%) module expansion conductivity conductivity
(N/mm
2
) (N/mm
2
) (10
−6
K
−1
) (m/ mm
2
) (W/mK)
AuSn20 280 14.57 275 < 1 59 200 16 < 5 57.3
AuGe12 356 14.70 150–200 < 1 69 300 13.4 7 44.4
AuSi2 363–740 14.50 500–600
a
0.5–3
a
12.6 33 50
SnAg25Sb10 228–395 7.86 80–120 1–4 23 000 19 6.5 55
SnAg3.5 221 7.38 25–35 20–30 41 100 27.9 7.5 57
PbSn5Ag2.5 280 11.70 25–35 20–30 21 300 29 < 5 44
PbIn5Ag2.5 307 11.60 35–40 28–34 19 900 29 < 5 42
a
Hard rollded condition
Table 3.1-160 Noble-metal-containing brazing alloys [1.217, p. 560]
Alloy Melting Density Tensile Elongation E-Modul. Thermal Electrical Thermal ISO
(wt%)
range (
◦
C) (g/cm
3
) strength (%) (N/mm
2
) expansn. condct. condct. Type 3677
(N/mm
2
) (10
−6
K
−1
) (m/ mm
2
) (W/mK)
AgCu28 779 10.00 250–350 20–28 100 000 19.8 10 B Ag72 Cu780
AgCu27In13 605–710 9.70 400–500 20–30 85 000 17.8 46.1 352 B Ag60CuIn 695-710
AgCu26.6Pd5 807–810 10.10 370–410 12–20 120 000 22 26 215 B Ag68CuPd 807-810
AgCu31.5Pd10 824–852 10.10 500–540 2–5 140 000 17.5 19 150 B Ag58CuPd 824-852
AgCu20Pd15 850–900 10.40 510–550 5–9 140 000 22 15 100 B Ag65CuPd 850-900
AgCu21Pd25 910–950 10.50 540–580 13–21 140 000 17.5 8 80 B Ag54PdCu 901-950
AgPd5 970–1010 10.50 180–220 26–34 40 000 22 25 220 B Ag95Pd 970-1010
CuPd18 1080–1090 9.40 380–420 31–39 135 000 18.9 9.1 100 B Cu82Pd 1080-1090
AgCu28Pd20 879–898 10.30 580–620 6–10 100 000 18.6 9.5 95 B Ag52CuPd 879-898
AuNi18 950 15.96 550–650 8 14.6 5.9 B Au82Ni 950
Table 3.1-161 Physical properties of noble-metal-contain-
ing vacuum braze alloys [1.217, p. 560]
Composition Solidus Liquidus
(
◦
C) (
◦
C)
Ag
−
Cu Ag40Cu19Zn21Cd20 595 630
Ag60Cu27In13 605 710
Ag44Cu30Zn26 675 735
Ag72Cu28 779 E
a
Ag
−
Mn Ag85Mn15 950 950
Ag
−
Pd Ag68.4Pd5Cu26.6 807 810
Ag54Pd25Cu21 901 950
Ag75Pd20Mn5 100 1120
Pd
−
Cu Pd18Cu72 1080 1090
Pd
−
Ni Pd60Ni40 1237 1237
Au
−
Cu Au80Cu20 890 890
Au33Cu65 990 1010
Au
−
Ni Au82Ni18 950 950
a
E = Eutectic composition
Part 3 1.10
Metals 1.10 Noble Metals and Noble Metal Alloys 345
Table 3.1-162 Typical powder grades of Ag, Pd, and Ag
−
Pd preparations for capacitors
Metal Manufacturing Grain Grain size Tap density Specific surface
a
method shape (µm) (g/cm
3
) (m
2
/g)
Ag Chemical reduction Microcrystalline 0.5–2.0 0.8–5.0 0.1–2.0
Electrolytic deposition Dendritic 1–200 4.5–4 0.1–0.5
↓
Ball milling Flakes 2–40 2.5–5 0.2–1.8
Pd Chemical reduction Crystalline < 20 0.8 2.5
spheres < 1.2 4.0 2.3
Ag
−
Pd30 Coprecipitation Spheres < 1.2 3.3 2.2
↓
Flakes < 9 3.4 3.3
a
BET in N
2
adsorption
ver ware alloys, and coins usually contain between
7.5 wt% Cu (“sterling silver”) and 20 wt% Cu. The
material Ag–28 wt% Cu is the most common silver
brazing alloy. Alloys of Ag
−
Mn are special sol-
ders for hard metal and refractory metals (Mo, W).
The alloy Ag–1 wt% Pt is applied in thick film lay-
ers for conductor paths in passive electronic devices.
Ag
−
Pd powderpreparations containing 10 to 30 wt% Pd
form the conductor layers in multilayer capacitors
(Table 3.1-162) [1.217].
Ternary and Higher Alloys
Alloys of the systems Ag
−
Cu
−
Sn, Ag
−
Cu
−
Zn,
and Ag
−
Cu
−
Cu
3
P are used as solders and brazes.
Ag
−
Cu
−
P solder alloys can be applied without flux.
Ti-containing solder alloys (active solders) allow di-
Table 3.1-163 Hardness and electrical conductivity of Ag
−
Ni
−
C (contact) alloys [1.226, p. 436]
Alloy content wt% C 3 2 2.5 2.5 2.5
Alloy content wt% Ni0.5 0.5 0.5 1 5 10
HV (kg/mm
2
)
40.5
43 53 50 53 56–57
Electrical conductivity 63.7 74.8 69.8 67.3 64.5
in % of standard Cu
rect bonding to ceramics (Table 3.1-162) [1.239].
Alloys of the systems Ag
−
Au
−
Cu, Ag
−
Au
−
Ni, and
Ag
−
Cu
−
Pd are applied in jewelry and dentistry (Ta-
bles 3.1-186, 3.1-187).
The oxide AgO forms the cathode of AgO/Zn button
type batteries with a cell voltage of 1.55 V and with en-
ergy densities in the range of 80–250 W h/dm
2
[1.218,
240–242].
Composite materials with SnO
2
, CdO, carbon,
Ni, and refractory carbides as dispersoids are base
materials of electrical (Tables 3.1-163, 3.1-164, and
Fig. 3.1-213) [1.226, 231, 243]. Extruded powder com-
posites show preferred alignment of the dispersoid
particles along the rod axes. Silver–nickel fiber com-
posites are magnetic. Their coercivity increases with
decreasing diameter of the Ni fibers [1.244].
Part 3 1.10
346 Part 3 Classes of Materials
Table 3.1-164 Silver bearing composite contact mater-
ials [1.243, p. 156]
Type Composition Hardness Electrical
(at.%) HV conductivity
(m/ mm
2
)
Alloys AgNi(0.15) 100 58
AgCu(3) 120 52
↓
AgCu(20) 150 49
Composites with:
Metals Ag
−
Ni(10) 90 54
↓
Ag
−
Ni(40) 115 37
Oxides Ag
−
CdO(10) 80 48
↓
Ag
−
CdO(15) 115 45.5
Ag
−
ZnO(88) 95 49
Ag
−
SnO
2
(8) 92 51
Ag
−
SnO
2
(12) 100 42
Carbon Ag
−
C(2) 40 48
Ag
−
C(5) 40 43.5
Refractory Ag
−
W(20) 240 26–28
metal
↓
compounds Ag
−
W(80) 80 42
Ag
−
WC(40) 130 24–30
↓
Ag
−
WC(80) 470
a
Composite made by infiltration of liquid silver into a tungsten
skeleton
Fig. 3.1-213 (a) Density, (b) hardness, and (c) electrical
conductivity of Ag
−
C alloys [1.231, p. 44f.]
11
10
9
8
7
6
5
Graphite (at. %)
10 20 30 40 50
60
40
20
0
60
40
20
0
048121620
1
2
3
2
2
Graphite (vol. %)Density (gcm
–3
)
a)
Calculated Extruded
material
Pre-pressed, sintered,
pressed at 40 kNcm
–2
Vickers hardness HV10
b)
Electrical conductivity
c)
Extruded
material
Pre-pressed, sintered,
pressed at 40 kNcm
–2
Extruded
material
Pre-pressed, sintered,
pressed at 40 kNcm
–2
Part 3 1.10
Metals 1.10 Noble Metals and Noble Metal Alloys 347
3.1.10.2 Gold and Gold Alloys
Application
Gold and gold alloys are used for electrical contacts,
bonding wires and conductor paths in semiconduc-
tor devices, chemical and corrosion resistant materials,
thin surface coatings for optical and heat reflecting
mirrors, special thermocouples, and catalysts for or-
ganic chemical reactions. Classical applications are
jewelry, dentistry, monetary bars, and coins. Com-
mercial grades: Table 3.1-165. The purity grades of
gold bars are standardized in the range of 99.9to
99.999 wt% (ASTM B 562-86), Tables 3.1-165, and
3.1-166 [1.217].
Production
Elementary gold is extracted from ores by cyanide
leaching and precipitated with zinc, and by electroly-
sis. Refining is achieved by application of chlorine gas
up to 99.5%,andto99.9% and higher by electroly-
sis. Bars, sheets and wires are made by casting, rolling
and drawing; powder is formed by chemical and by elec-
trolytic precipitation from solutions; and nanocrystalline
powders are formed by dispersion in organic solutions.
Coatings are produced by cladding; electroplating; and
applying powder preparations followed by firing. Thin
films are produced by evaporation and cathode sput-
tering. Very fine gold leaves are made by traditional
hammering to a thickness of ∼ 0.2µm, or by cathode
sputtering.
Phases and Phase Equilibria
Selected phase diagrams are shown in Figs. 3.1-214–
3.1-223 [1.245, 246]. Continuous solid solutions are
Table 3.1-165 Specifications of fine gold [1.217, p. 52]
Designation Grade (wt%) Impurity Maximum content (ppm)
“Good delivery” gold 99.5 any, total 5000
Fine gold 99.99 Ag/Cu/others/total 100/20/30/100
Fine gold, chemically pure 99.995 Ag/others/total 25/25/50
Fine gold, high purity 99.999 Ag/Fe/Bi/Al/Cu/Ni/Pd +Pt/total 3/3/2/0.5/0.5/0.5/5/10
Table 3.1-166 Standard fineness of noble metal alloys and corresponding carat of jewelry [1.217, p. 52]
Fineness (wt‰)
Au 375 585 750 916,999
Ag 800,925,999
Pd 500 850,900,950,999
Pt 500 950,999
333 375 585 750 1000
Carat 8 9 14 18 24
1800
1700
1600
1500
1400
1300
1200
1100
1000
900
800
700
600
Co (at. % )
135 10 15 202530 405060
70 90
7
80
10 20 30 40 50 60 70 80 90
T (K) Co (wt %)
Au-Co
Au
Magnetic
transformation
1337 K
24.8
23
(Au)
1768 K
1395 K
1269 K 98.1
(α – Co)
(ε – Co)
≈ 695K
Fig. 3.1-214 Binary phase diagram of Au
−
Co [1.245]
formed with Ag, Co, Cu, Fe, Ni, Pd, and Pt. Mis-
cibility gaps occur with Be, Ni, Pt, Rh, and Ru.
Thermochemical data are listed in Tables 3.1-167,
Part 3 1.10
348 Part 3 Classes of Materials
1400
1300
1200
1100
1000
900
800
700
600
500
400
Cu (at. %)
135 10 15 202530 40 5060
70 90
7
80
10 20 30 40 50 60 70 80 90
T (K) Cu (wt %)
Au
Au-Cu
1337 K
1358K
1183 K
≈ 43.7
(Au, Cu)
Au
3
Cu AuCu AuCu
3
683 K
658 K
663 K
(?)
558 K
64
513 K
38.5 K
Fig. 3.1-215 Binary phase diagram of Au
−
Cu [1.245]
1800
1700
1600
1500
1400
1300
1200
1100
1000
900
800
700
600
Ni (at % )
135 10 15 202530 405060
70 90
7
80
10 20 30 40 50 60 70 80 90
42.5
1083 K
70.6
T (K) Ni (wt %)
Au
1337 K
Au-Ni
(Au, Ni)
1728 K
Fig. 3.1-216 Binary phase diagram of Au
−
Ni [1.245]
and 3.1-168 [1.217, 222]. Compositions, crystal struc-
tures and lattice parameters of selected intermetallic
compounds are given in Table 3.1-169 [1.217] and
in Figs. 3.1-224 and 3.1-225 [1.245]. Primary solid
solutions have the fcc structure of Au. The lattice pa-
rameters of the substitutional solid solutions correspond
roughly to Vegard’s law with a few exceptions [1.247].
2000
1800
1600
1400
1200
1000
800
600
400
200
Pd (at. % )
51015202530 405060
70 90
80
10 20 30 40 50 60 70 80 90
T (K) Pd (wt %)
Au
Au-Pd
1828 K
1337 K
(Au, Pd)
1123 K
(Au
3
Pd)
1143 K
(AuPd
3
)
373 K
(AuPd(?)
Fig. 3.1-217 Binary phase diagram of Au
−
Pd [1.245]
2100
2000
1900
1800
1700
1600
1500
1400
1300
1200
1100
1000
900
800
700
Pt (at. % )
10
10 20 30 40 50 60 70 80 90
20 30 40 50 60 70 80 90
T (K) Pt (wt %)
Au
2042 K
Au-Pt
1337 K
1533K
61
Fig. 3.1-218 Binary phase diagram of Au
−
Pt [1.245]
Part 3 1.10
Metals 1.10 Noble Metals and Noble Metal Alloys 349
Table 3.1-167 Thermodynamic data of Au [1.217, p. 107]
T (K) c
p
(J/K mol) S (J/K mol) H (J/mol) G (J/mol) p (at)
300 25.303 47.645 0.047 −14.247 6.87× 10
−58
500 26.158 60.757 5.188 −25.191 2.82× 10
−32
700 27.028 69.701 10.509 −38.282 2.49 × 10
−21
T = Temperature, c
p
= specific heat capacity, S = Entropy, H = Enthalpy, p = partial pressure of the pure elements
1800
1600
1400
1200
1000
800
600
400
Si (at. % )
135 1015203040507
80
10 20 30 40 50 60 70 80 90
T (K) Si (wt %)
Au
1607 K
Au-Si
1337 K
16.6
(Si)
636 K
Fig. 3.1-219 Binary phase diagram of Au
−
Si [1.245]
T (K)
1400
1200
1000
800
600
400
200
Sn (at. % )
51015202530 40 50 60
70 90
80
10 20 30 40 50 60 70 80 90
Sn (wt %)
Au
Au-Sn
(Au)
1337 K
6.8 1.4 756 K
17.5
18.5
10
11
9.1
≈ 23
29
463 K
551K
ξ
ξ
β
δδ
ε
692 K
582 K
50.5 525 K 72
88.5
505 K
93.7
≈ 99.8
286 K
η (β - Sn)
(α – Sn)
4.90K
Fig. 3.1-221 Binary phase diagram of Au
−
Sn [1.245]
20
40
60
8020
40
60
80
20 40 60 80
Ag Cu
Au
1050° C
1000°C
950°C
900°C
850°C
800°C
1050°C
1000 °C
950°C
wt %
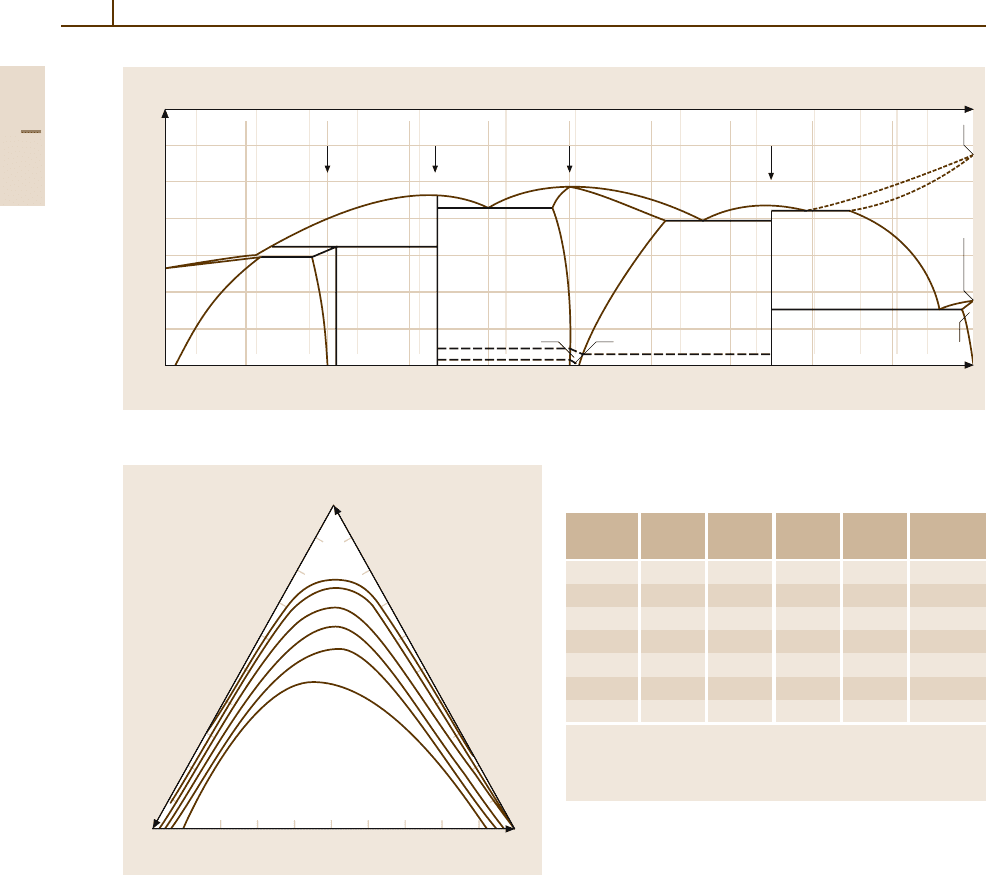
Fig. 3.1-220 Liquidus sections through the miscibility gap
of the Au
−
Ag
−
Cu system [1.246]
Part 3 1.10
350 Part 3 Classes of Materials
T (K)
1337
1396 K
1445 K
(Au)
Au
4
Ti
1728 K
1658 K
1768 K
1583 K
1668 K
1640 K
1943 K
1155 K
1105 K
2200
2000
1800
1600
1400
1200
1000
800
Ti (at. % )
1 3 5 7 10 15 20 30 40
50 80
60
10 20 30 40 50 60 70 80 90
70
Au
2
Ti AuTi
Au
3
Ti
Ti (wt %)
Au
Au-Ti
(β -Ti)
(α -Ti)
(β -AuTi) (α-AuTi)
Fig. 3.1-222 Binary phase diagram of Au
−
Ti [1.245]
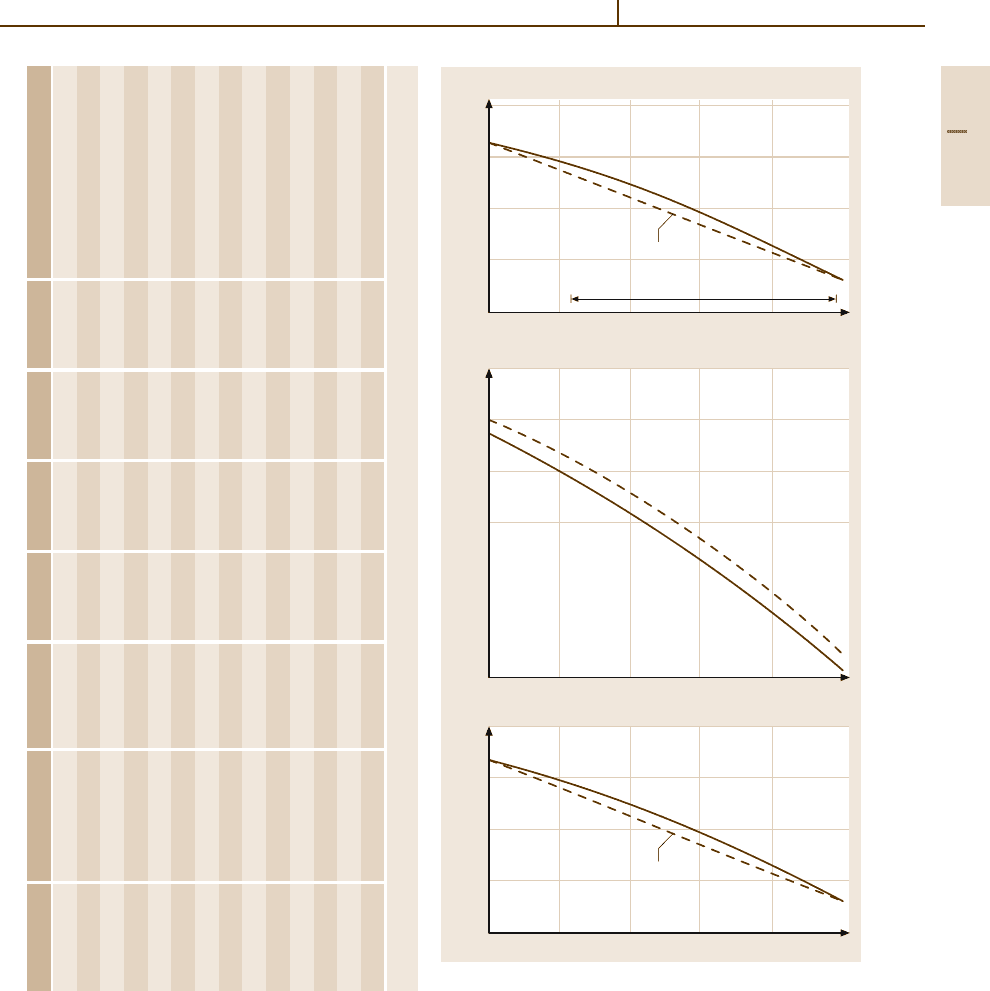
20 40 60 80
20
40
60
8020
40
60
80
Ag Cu
Au
wt%
Miscibility gap
after solidification
350°C
400°C
500°C
600°C
700°C
Fig. 3.1-223 Isothermal sections through the miscibility
gap of the Au
−
Ag
−
Cu system [1.246]
Superlattice phases occur in alloys with Cd, Cu, Mn,
Pd, Pt, Rh, Ru, and Zn. The superlattice structures
have tetrahedral or rhombohedral symmetry. Typ-
ical compositions are AB
3
and A
3
B [1.218]. If they
are not precipitated as second phases, superlattice
Table 3.1-168 Heats, entropies and free energies of forma-
tion of Au compounds [1.222, p. 196]
Phase N
2
T H G S
(
◦
C) (J/mol) (J/mol) (J/K mol)
AuCu s.s. 0.58 500 5.32 9.67 5.65
Au
3
Cu 0.26 25 4.03 4.90 2.97
AuCu I 0.50 25 8.96 8.96 −
AuCu II 0.50 400 6.03 8.79 4.10
AuCu
3
0.75 25 6.87 7.24 1.26
AuNi s.s. 0.53 877 −7.5 − 8.71
AuSn 0.50 25 14.24 − −0.4
N
2
= mole fraction of second compound,
∆S = entropy of formation, s.s. = solid solution
s.s. = solid solution
phases form antiphase domains on different sublattices
separated by antiphase domain boundaries. Intermetal-
lic compounds are formed with numerous elements
with different and complex crystal structures [1.225].
Metastable phases exist with Ni and Pt. Alloys with
B-metals form intermetallic phases at compositions
corresponding to e/a values of 3/2, 21/13, and 7/4
(Hume-Rothery phases). Structural types of intermetal-
lic compounds of gold with rare earth metals are listed
in [1.248].
Part 3 1.10
Metals 1.10 Noble Metals and Noble Metal Alloys 351
Table 3.1-169 Structure and lattice parameters of selected intermediate Au compounds [1.217, p. 113]
Phase Pearson Symbol a (nm) b (nm) c (nm) c/a Remarks Concentration (A/1−x )B(x)
AuAl mPs 0.6415 0.3331 0.6339
Au
2
Al oP30 0.8801 1.6772 0.3219 LT 0.664–0.667
Au
5
Al cP20 0.69208 LT
Au
−
Al
2
cF12 0.59973 0.334
AuCu oI40 0.3676 0.3972 773 K
AuCu oP8 0.456 0.892 0.283
AuCu tP4 0.3966 0.3673 0.9261 0.46–0.54
Au
3
Cu cP4 0.39853
Au
−
Pd cP4 0.3991 0.552
Au
−
Pt cF4 0.3996 0.5
Au
−
Sn hP2 0.29228 0.47823 1.6329 0.14
AuSn hP4 0.43218 0.5523 1.2779
AuSn
4
oC20 0.6502 0.6543 1.1705 475 K
Au
4
Ti tI10 0.6485 0.4002 0.6171
LT = low-temperature modification
0.42
0.40
0.38
0.36
0.34
20
Co (at. % )
40 60 80Au
0.42
0.41
0.40
0.39
0.38
0.37
0.36
20 40 60 80Au
Cu (at. % )
0.42
0.40
0.38
0.36
0.34
20 40 60 80Au Ni (at. % )
Lattice parameter a (nm)
Au-Co
fcc
Vegard’s law
Metastable
Au-Cu
T = 748 K
RT
(Au, Cu)
Au-Ni
Vegard’s law
T = 298 K
(Au, Ni)
b)
a)
c)
Fig. 3.1-224a–c Lattice parameter versus composition in
the systems
(a) Au
−
Co, (b) Au
−
Cu, (c) Au
−
Ni [1.245]
Part 3 1.10