Martienssen W., Warlimont H. (Eds.). Handbook of Condensed Matter and Materials Data
Подождите немного. Документ загружается.

702 Part 4 Functional Materials
Table 4.2-5 Critical temperature T
c
of superconductivity of V compounds [2.1], cont.
Compound Crystal T
c
Compound Crystal T
c
structure (K) structure (K)
VNi
2
a
Rhomb. <4.2 V
3
Ti
a
Cub. A15
b
<4.2
VNi
3
Tetr. DO
22
<4.2 V
4
Zn
5
Tetr. <4.2
V
4
O
a
Tetr. <4.2 VZn
3
Cub. L1
2
<4.2
V
2
O
a
Hex. <4.2 VZn
16
d
− −
VO
a
Cub. B1 <0.07 V
2
Zr
d
Cub. C15 8.8–6.5
V
2
O
3
Rhomb. <1.28 Rhomb.
j
8.5
a
Compound with a range of homogeneity
b
Metastable phase
c
“<” means that no superconductivity was found above the temperature indicated
d
Supposed compound
e
Superconducting properties not investigated
f
Unstable in the absence of carbon
g
Non-stoichiometric composition
h
Low-temperature modification
i
High-temperature modification
j
Formed by martensitic transformation
8
6
2
51015
T
C
(K)
C (at.%)C (at.%)
51015
Ge
Os, Ru
Cu
Sb
Ga
Al Au
Sn
Si
H
O
Pt
N
Sc
Ti
Zr
Nb
Ta
Hf
C
Mo
Cr
Mn
Fe
W
Ir
Ni
V
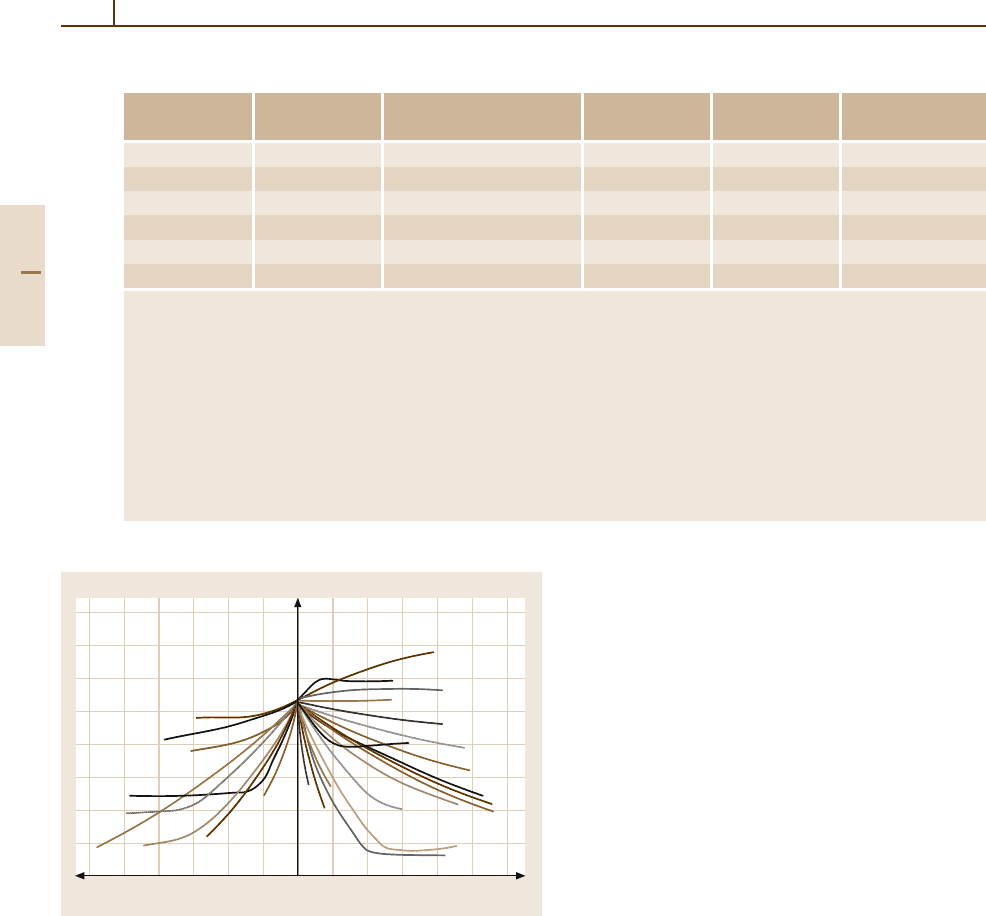
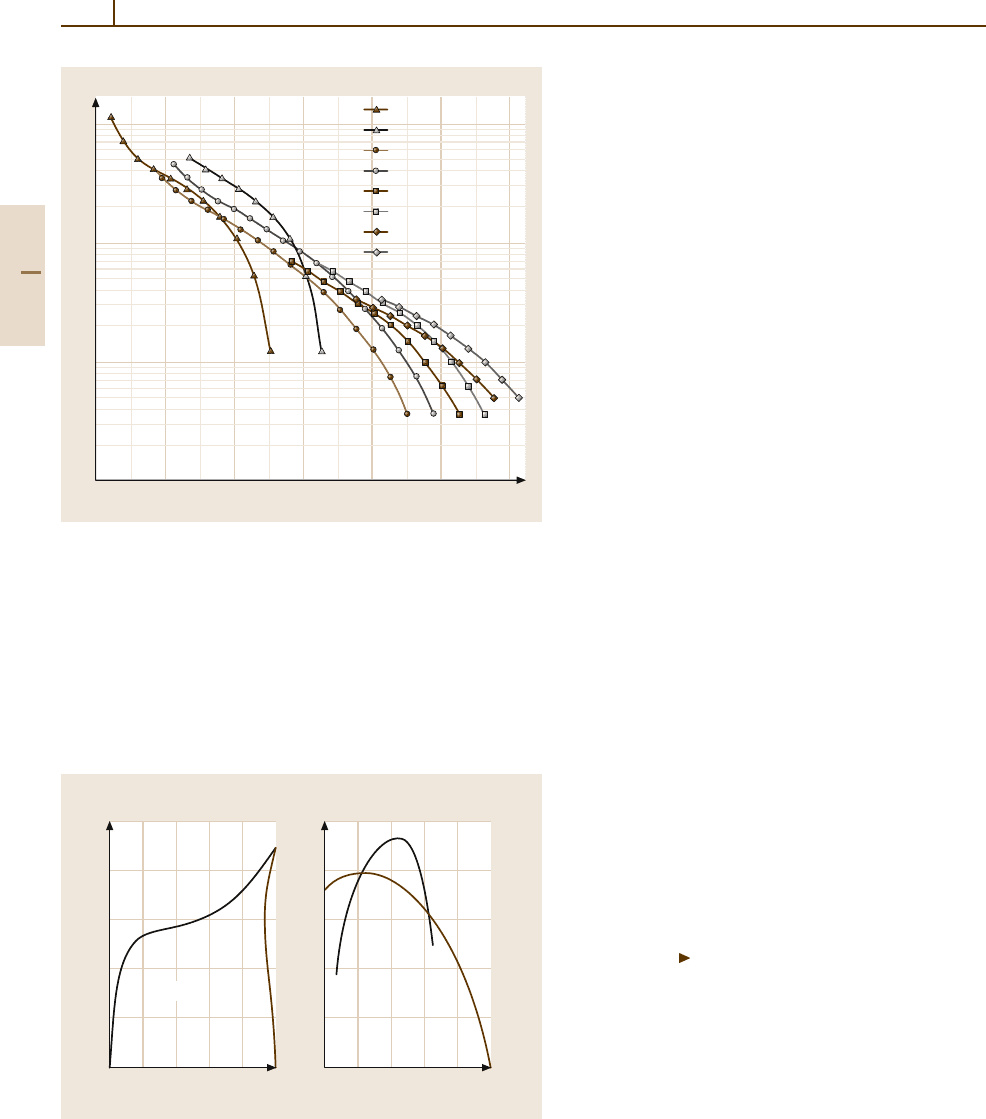
Fig. 4.2-3 Composition dependence of T
c
of superconductivity in
V solid solution alloys [2.1]
Nb Alloys
Based on its highest T
c
among all elements Nb has been
considered the most likely base metal for superconduct-
ing materials from the beginning and its alloys and
intermetallic compounds have been investigated most
extensively. Table 4.2-6 shows T
c
values for binary Nb
compounds, where Nb
3
Al, Nb
3
Ga, Nb
3
Ge, and Nb
3
Sn
with the cubic A15 type crystal structure stand out for
their particularly high T
c
.Ofthese,Nb
3
Sn has been de-
veloped into a high-field superconducting material (see
Sect. 4.2.1.2). Figure 4.2-4 shows the effect of alloying
additions on T
c
in Nb solid solutions. The Nb
−
Ti alloys
have, finally, been selected to form the most versatile
and widely applied high-field superconducting material
for present applications (see Sect. 4.2.1.2).
Part 4 2.1
Superconductors 2.1 Metallic Superconductors 703
Table 4.2-6 Superconductivity of Nb compounds [2.1]
Compound Crystal T
c
Compound Crystal T
c
structure (K) structure (K)
Nb
3
Al Cub. A15 18.8–15.0 Nb
3
Os Cub. A15 1.5–0.5
NbOAl Tetr. D8
b
0.74 Nb
3
Os
2
Tetr. D8
b
1.86–1.40
NbAl
3
Tetr. D0
22
0.64 NbOs
2
Cub. A12 2.86
d
–2.52
Nb
3
As Tetr. Ti
3
P 0.31 Nb
3
P Tetr. Ti
3
P 2–1.83
(7.5–6.0)
g
NbAs
2
Monocl. <0.012
a
Nb
3
Pb
e
Cub. A15 9.6<1.5
Nb
3
Au Cub. A15 11.5–8.99 Nb
3
Pd
2
Cub. A12 2.47–1.7
Nb
3
B
2
Tetr. <1.0 NbPd Tetr. D8
b
2.0
NbB
b
Rhomb. B
f
8.25 Nb
3
Pt Cub. A15 10.9–6.0
NbB
c
− <0.05 Nb
2
Pt Tetr. D8
b
4.2–3.73
Nb
3
B
4
Rhomb. D7
b
<1.28 NbPt(α) Rhomb. B19 2.4–<1.39
NbB
2
Hex. C32 6.4
d
–<1.0 NbPt
2
Rhomb. <1.46
Nb
3
Be
2
Tetr. 2.3 Nb
7
Re
9
Tetr. D8
b
3.8–2.5
NbBe
2
Cub. A15 2.15 NbRe
4
Cub. A12 2.45–9.7
NbBe
3
Rhomb. <1.15 Nb
3
Rh Cub. A15 2.64–2.4
Nb
2
Be
17
Rhomb. 1.47–<1.38 Nb
5
Rh
3
Tetr. D8
b
4.1–4.04
10.2
g
NbBe
12
Tetr. <1.38 NbRh(γ) Tetr. L1
o
3.76
Nb
3
Bi
e
Cub. A15 3.05 (4.2–2) NbRh(γ) Rhomb. 3.07
Nb
2
C Hex. 9.11– < 1.98 NbRh(ε) Rhomb. B19 3.00
NbC Cub. B1 11.7– < 1.15 (14
f
) Nb
3
Rh
5
(ξ) Monocl. Sm 2.7
Nb
3
Ga Cub. A15 16.8–14.1 (20.7)
g
NbRh
3
Cub. L1
3
<1.43
Nb
5
Ga
3
Tetr. 1.35 Nb
3
Ru
2
Tetr. 1.2
Nb
3
Ga
2
h
Tetr. <2 Nb
2
Ru
3
1.2
Nb
5
Ga
4
Hex. <2 NbS Hex. B8
1
<1.28 (3.3–3.8)
g
NbGa
h
− <2 NbS
2
i
Hex. C7 6.15–5.4
Nb
2
Ga
3
− <2 Nb
3
Sb Cub. A15 1.95–0.2
Nb
5
Ga
13
Rhomb. <2 Nb
3
Sb
2
<1.02
NbGa
3
Rhomb. <2 NbSb Hex. B8
1
<4.2
Nb
3
Ge Cub. A15 6.91 (23.2)
g
Nb
4
Sb
5
Tetr. 4.2–<1.15
Nb
3
Ge Tetr. Ti
3
P <0.2 NbSb
2
Monocl. 4.2–<1.15
Nb
2
Ge Hex. D8
8
1.90 Nb
3
Se
4
Hex. 1.61
Nb
5
Ge
3
Tetr. <1.02 NbSe
2
Hex. C7 7.5–5.4(8.5–9)
g
NbGe
2
Hex. C40 2.23–2.09 NbSe
3
Monocl. <1.0
NbH Cub. <1.30 Nb
4
Si
h
Hex. ε −Fe
3
N <1.5
NbH
2
Cub. <0.47 Nb
3
Si Tetr. 0.29(5.45)
e
Nb
3
In Cub. A15 9.2–4 Nb
3
Si
e
Cub. A15 19–13
Nb
3
Ir Cub. A15 1.76–1.63 Nb
5
Si
3
(α) Tetr.
b
<1.02
Nb
5
Ir
3
Tetr. D8
b
9.8
i
–2.4
d
Nb
5
Si
3
Hex. D8
8
<1.02
NbIr
1+x
Tetr. L1
o
4.75 NbSi
2
Hex. C40 <1.20
Nb
2
Ir(α
2
) Rhomb. 4.6 Nb
3
Sn Cub. A15 18.5–4.0
NbIr
3
Cub. L1
2
<1.2 Nb
6
Sn
5
Rhomb. 2.07
Part 4 2.1
704 Part 4 Functional Materials
Table 4.2-6 Superconductivity of Nb compounds [2.1], cont.
Compound Crystal T
c
Compound Crystal T
c
structure (K) structure (K)
Nb
2
N(β) Hex. 9.5–<1.2 NbSn
2
Rhomb. 2.68
Nb
4
N
3
(γ ) Tetr. 12.2–7.8 NbTc
3
Cub. A12 12.9–10.5
NbN(δ
) Tetr. 7.2 Nb
3
Te
g
Cub. A15 <2.5
NbN(δ) Cub. B1 16.5–9.7 Nb
5
Te
4
− <1.1
NbN(ε) Hex. <1.20 Nb
3
Te
4
Hex. 1.49
Nb
5
N
6
Hex. <1.77 NbTe
2
Hex. C7 0.74–0.5
Nb
4
N
5
Tetr. 8.0–8.5 NbTe
4
− <0.025
NbO Cub. B1 1.61–1.38 Nb
3
Tl
b
Cub. A15 9.0
NbO
2
Tetr. <1.2 NbZn
3
Cub. L1
2
<1.02
a
“<” means that no superconductivity was found above the temperature indicated
b
Low-temperature modification
c
High-temperature modification
d
Non-stoichiometric composition
e
Metastable phase
f
Extrapolated maximum T
c
g
Under extreme conditions
h
Stabilized by adding interstitial elements
i
Phase is stable at >850
◦
C only
Ge
Cu
Sb
Al
Au
Sn
Si
H
O
Pt
N
Sc
Ti
Zr
Ta
Hf
C
Mo
Cr
Fe,Ni
W
Ir
Co
Ru
Pd
Rh
Os
Tc
Re
MaMa
Ma
V
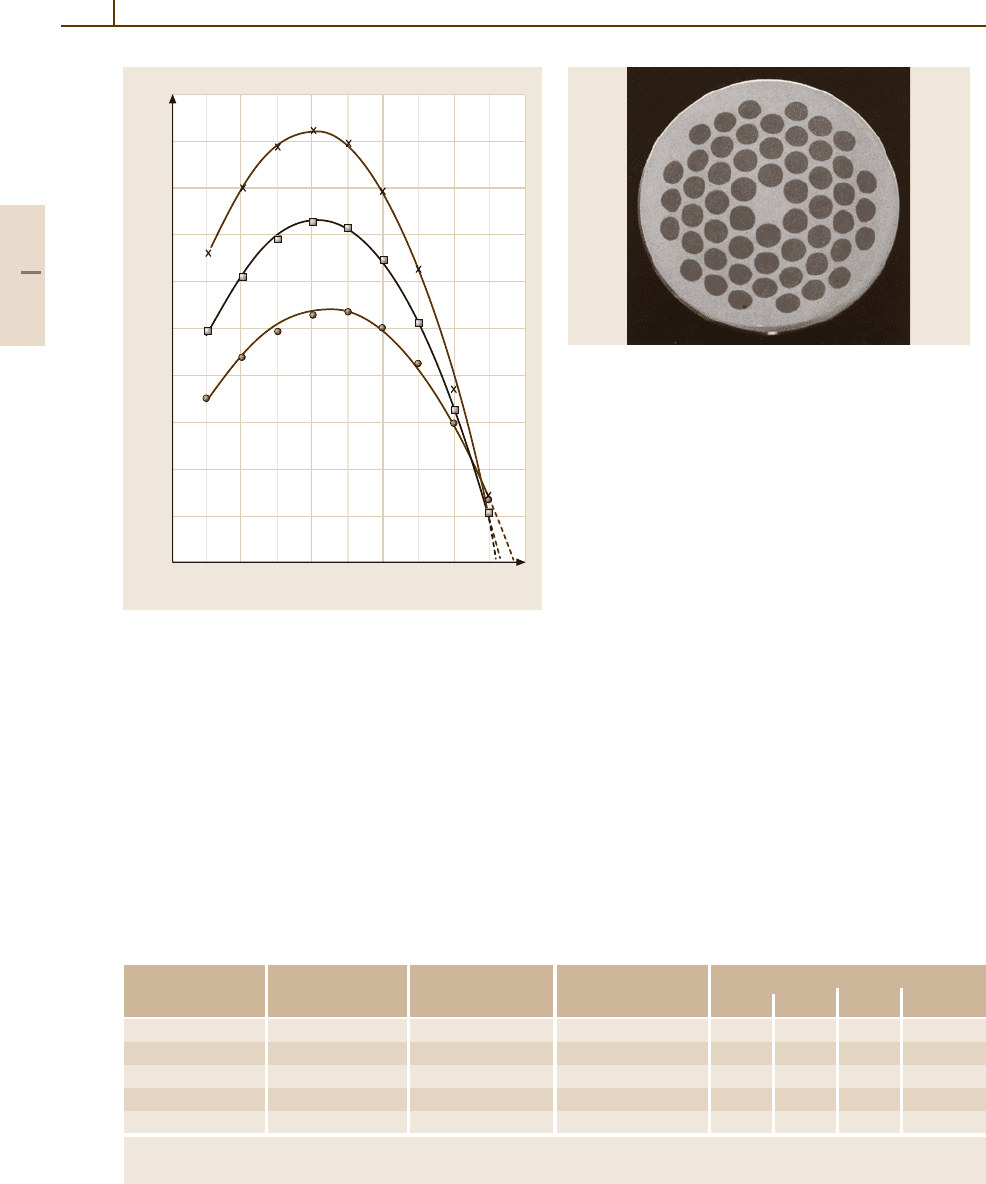
Fig. 4.2-4 Composition dependence of T
c
of superconduc-
tivity in Nb solid solution alloys [2.1]
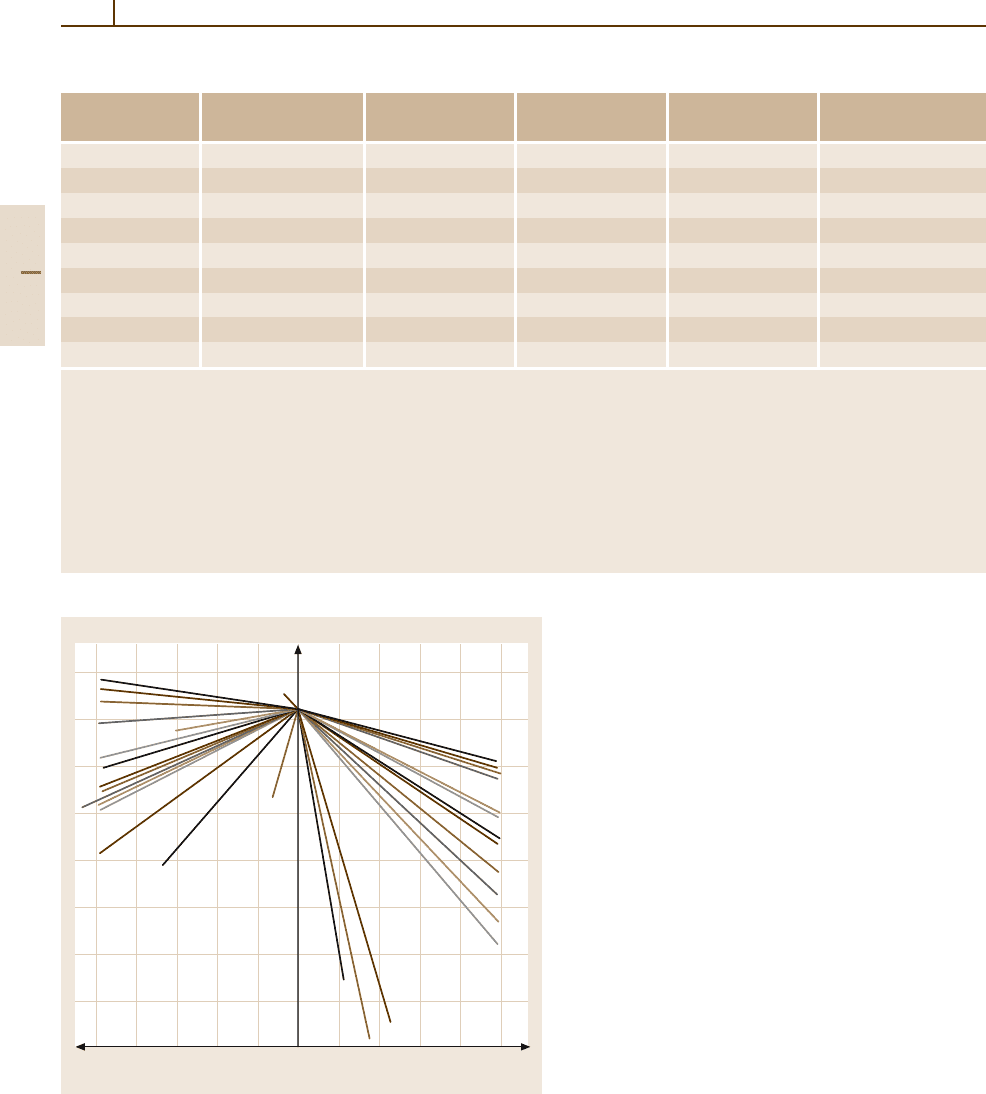
Tc Alloys
Since Tc is rare and difficult to prepare in the alloy
form, its superconducting properties have been studied
to a limited extent only (see Table 4.2-7 and Fig. 4.2-5).
4.2.1.2 Practical Metallic Superconductors
Practical metallic superconductors for DC or AC
applications are invariably composite wires with super-
conducting filaments which are embedded in a normal
conducting matrix, usually Cu. They have a high longitu-
dinal conductivity and may contain further components
such as low conductivity barriers consisting of a Cu
−
Ni
alloy, or diffusion barriers of Nb or Ta. Accounts of
combining the aspects of the physics of superconductiv-
ity, materials science and technology, and electrical and
mechanical performance criteria which have to be taken
into account and are mastered in producing supercon-
ducting wires are given in [2.4–8].
Part 4 2.1
Superconductors 2.1 Metallic Superconductors 705
Table 4.2-7 T
c
of superconductivity of Tc compounds [2.1]
Compound Crystal T
c
Compound Crystal T
c
structure (K) structure (K)
Tc
3
As
7
Cub. D8
f
<0.3
a
Tc
6
Ti
b
Cub. A12 8.10–7.73
TcBe Cub. 5.21 TcTi Cub. B2 <1.7
TcBe
22
Cub. ZrZn
22
5.25 Tc
2
Th Hex. C14 5.3
c
TcC Cub. 3.85 Tc
3
V(δ) Cub. 7.8–4.0
Tc
2
Hf Hex. C14 5.6 TcV(ε) Cub. B2 <1.39
Tc
7
Mo
3
Tetr. D8
b
15.8–14.7 Tc
3
W
2
Tetr. D8
b
7.88–8.35
Tc
2
Mo
3
Cub. A15 14–12 Tc
6
Zr Cub. A12 9.7
Tc
3
Nb Cub. A12 12.9–10.5 Tc
2
Zr Hex. C14 7.6
Tc
3
SN
d
Hex. 5.92
a
“<” means that no superconductivity was found above the temperature indicated
b
Formed as an ordered phase by extended annealing of the solid solution phase
c
Non-stoichiometric composition
d
Compound not determinded definitely; T
c
may be related to the solid solution
Only two superconducting metallic phases are used
routinely in superconducting wires for applications: the
Nb
−
Ti solid solution phase and the Nb
3
Sn intermetallic
phase. Due to the difference of their intrinsic supercon-
ducting properties T
c
and B
c2
, they have different ranges
of application as indicated in Table 4.2-8.
The critical current density J
c
(T, B) obtained by ap-
plying optimal microstructural pinning of the flux lines
in conductors of different composition and at different
temperatures is shown in Fig. 4.2-6. Two factors of influ-
ence may be applied to obtain a higher critical current
density J
c
(T, B) through effects of the intrinsic prop-
erties: either a decrease in temperature of application,
e.g., from 4.2 to 1.8 K, or an increase of B
c2
by alloying
as shown for (Nb, Ta, Ti)
3
Sn in both Table 4.2-8 and
Fig. 4.2-6. It should be noted that the intrinsic properties
are affected only marginally by differences in processing
of the conductors.
Table 4.2-8 Characteristic properties of practical metallic superconductors (After [2.8])
Superconducting phase Composition T
c
(K) B
c2
(T) Magnetic field in application B(T)
Nb
−
Ti 46–52 wt% Ti, ≈ 10 ≈ 10.5(4.2K) ≤9(4.2K)
≈ 47 wt% Ti optimal > 9(1.8K)
Nb
3
Sn 25 at.% Sn, ≈ 18 ≈ 23 (4.2K): ≤ 20 T (4.2K)
(Nb, Ta, Ti)
3
Sn ≤ 7.5wt%Ta, ≈ 26–29 (4.2K) several T (< 4.2K)
≤ 0.2wt%Ti
12
10
6
T
C
(K)
C (at.%)C (at.%)
01234512345
Nb
Ti
V
Mo
W
Cr
Ni
Pd
Re
Ru,Os,Rh
Co
Fe
Fig. 4.2-5 Composition dependence of T
c
of superconductivity in
Tc solid solution alloys [2.1]
Part 4 2.1
706 Part 4 Functional Materials
10
6
10
5
10
4
10
3
0 4 8 12 16 20 24
B (T)
J
C
non-Cu
(A/cm
–2
)
0.1 µV/cm
NbTi
Nb
3
Sn
(NbTa)
3
Sn
(NbTaTi)
3
Sn
4.2K
2KNbTi
Nb
3
Sn
(NbTa)
3
Sn
(NbTaTi)
3
Sn
4.2K
2K
4.2K
2K
4.2K
2K
Fig. 4.2-6 Non-Cu J
c
versus B characteristics of Nb
−
Ti, binary
Nb
3
Sn, alloyed (Nb, Ta)
3
Sn, and alloyed (Nb, Ta, Ti)
3
Sn multifil-
amentary superconductors [2.8]
Nb–Ti Superconductors
Extensive accounts are given in [2.4, 6, 7]. The
Nb
−
Ti alloy phase diagram combined with the low-
temperature T
c
(c
Ti
) and B
c2
(c
Ti
) relations of the
0 20406080100
Ti content (at.%)
1000
800
600
400
200
0
12.5
10.0
7.5
5.0
2.5
0
12.5
10.0
7.5
5.0
2.5
0
0 20406080100
Ti content (at.%)
Temperature (C°)
a) b)
T
C
(K) B
C2
(T)
β
β+α
α
B
C2
(4K)
T
C
Fig. 4.2-7a,b Phase relations and superconducting properties in the
Nb
−
Ti alloy system.
(a) Nb
−
Ti phase diagram in the solid state.
(b) T
c
and B
c2
(4 K) of the metastable β phase
superconducting β phase (Fig. 4.2-7a and b), provide
the basic features of both the intrinsic superconducting
properties of the β phase and of the potential for flux pin-
ning by precipitation of the α phase induced by suitable
heat treatment in the α +β two-phase range.
The subsequent characteristic data are taken from
systematic treatments and measurements of a Cu sta-
bilized Nb–46.5 wt% Ti superconductor [2.9] which is
in the range of optimum composition according to
Table 4.2-8 and Fig. 4.2-7b. The processing of the com-
posite consists essentially of a succession of deformation
treatments, usually by wire drawing to different strains
(true strain ε
t
= 2ln(d
i
/d), where d
i
is the initial rod
diameter and d is the filament diameter at the draw-
ing strain considered), followed by heat treatments for
20 h to 40 h, mainly at temperatures in the range 360 to
380
◦
C, but also up to 420
◦
C. The first stage of defor-
mation of the homogeneous metastable β phase leads
to the formation of a high density of dislocations, thus
providing a high density of heterogeneous nucleation
sites for the precipitation of a fine dispersion of α phase
particles during the first heat treatment. During the sub-
sequent cycles of deformation and heat treatment the
α particles previously formed are elongated and partially
broken up. Additional particles may be newly formed
along dislocation cell walls and subgrain boundaries.
The particle spacing transverse to the drawing direc-
tion is reduced. These variations of the dispersion are
strongly affecting the pinning behavior and, thus, the J
c
values obtained, referring to a composite resistivity of
10
−14
Ω m.
The diagrams of Fig. 4.2-8a–e show J
c
as a function
of the true drawing strain ε
t
. The parameters are different
thermal treatments, and different conditions (magnetic
field, temperature) of measurement.
From measurements such as those shown in
Fig. 4.2-8e, the effective bulk pinning force F
p
can be
evaluated as shown in Fig. 4.2-9.
Fig. 4.2-8a–e Critical current variations as a function of
different thermal treatments, final drawing strain and field
of measurement, respectively, of an Nb–46.5 wt%Ti super-
conductor at 4.2 K [2.9].
(a) 160 h at 405
◦
C, ◦ 80 h at
405
◦
C; ×40 h at 375
◦
C. — B = 5T, --- B = 8T.(b) All
treatments for 80 h: 375
◦
C, ◦ 405
◦
C, 420
◦
C, ♦435
◦
C.
— B = 5T, --- B = 8T.
(c) All treatments at 420
◦
C:
×160 h, 80 h, ◦ 40 h, 10 h, ♦5h. B = 5T.
(d) 160 h
at 420
◦
C: ◦ two heat treatments, three heat treatments.
B = 5T.
(e) Full field optimum: ×80 h at 420
◦
C, 40 h at
375
◦
C, ◦ 5 h at 405
◦
C
Part 4 2.1
Superconductors 2.1 Metallic Superconductors 707
3000
2500
2000
1500
1000
500
0
8234567
3000
2000
1000
0
23 4 5
3500
3000
2500
2000
1500
1000
2345
6
3000
2000
1000
0
23456
9111357
J
C
(A/mm
–2
)
7000
6000
5000
4000
3000
2000
1000
0
Field (T)
J
C
(A/mm
–2
)
Strain ε
t
J
C
(A/mm
–2
)
J
C
(A/mm
–2
)
Strain ε
t
J
C
(A/mm
–2
)
Strain ε
t
a) b)
Strain ε
t
c) d)
e)
Part 4 2.1
708 Part 4 Functional Materials
9111357
F
P
(GN/m
–3
)
20
18
16
14
12
10
8
6
4
2
0
B (T)
Fig. 4.2-9 Bulk pinning force F
p
versus magnetic field,
corresponding to the J
c
data shown in Fig. 4.2-8e. Typical
particle spacings for the optimum J
c
is d ≈ 20 nm and d ≈
3–5 nm, respectively [2.9]
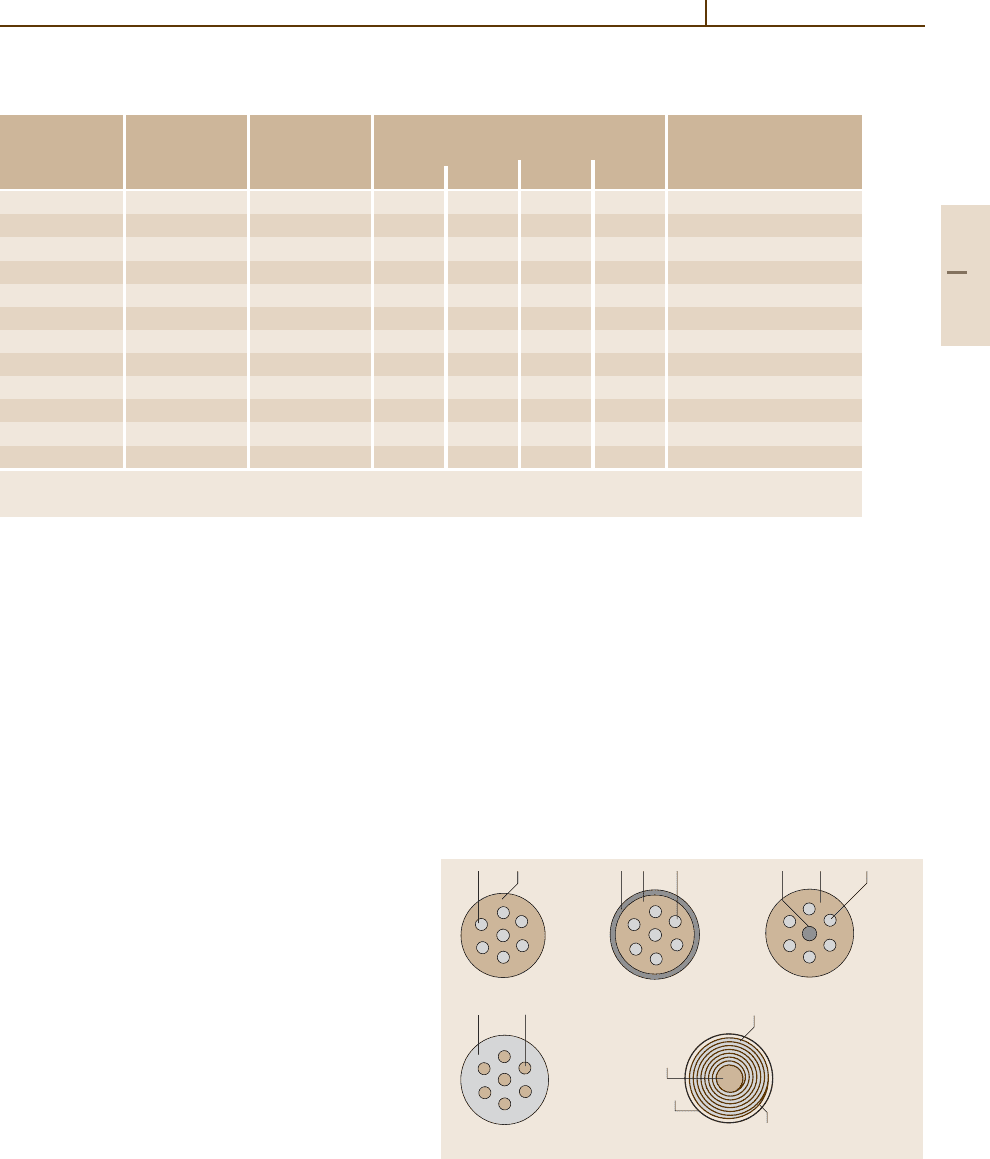
Based on systematic variations and optimizations
such as those shown in Fig. 4.2-8, commercial Nb
−
Ti
superconducting composite wires are provided for
a wide range of specifications. Figure 4.2-10 shows
a typical wire cross section and Table 4.2-9 lists some
characteristic data.
Table 4.2-9 Characteristic data at 4.2 K of commercial Nb
−
Ti superconductors, round wires
Filaments A
Cu
/A
NbTi
a
Wire diameter Filament diameter Critical current J
c
,(A)atµ
0
H (T)
(mm) (µm) 3T 5T 7T 9T
54 1.35 0.3 27 100 70 45 −
54 1.35 0.6 53 380 265 170 −
54 1.35 0.85 75 − 480 310 140
45 1.8 0.4 36 150 105 70 −
45 1.8 0.7 62 420 295 185 −
a
Ratio of cross sectional area
b
Data extracted from a commercial brochure of Vacuumschmelze GmbH (9/1990)
Fig. 4.2-10 Typical cross section of a Cu-stabilized Nb
−
Ti
superconducting wire
Nb
3
Sn Superconductors
The production of superconductors based on Nb
3
Sn as
the superconducting phase [2.7, 8] is hampered by the
brittle behavior of this intermetallic phase which cannot
be deformed by wire drawing. Consequently the con-
ductors are produced by composing ductile components
first, reducing the cross section of the composite into the
final wire form by extrusion and drawing processes, and
finally forming the Nb
3
Sn phase by a diffusion–reaction
treatment after the specified wire diameter has been
obtained. Fiveroutes of processing havebeen developed:
1. Bronze process: The initial rod composite con-
tains Nb rods surrounded by Cu
−
Sn alloy rods
(13–15 wt% Sn) in a suitable arrangement such
that after processing into wire form the diffusion–
reaction treatment leads to the formation of Nb
3
Sn
at the interface of Nb and Cu
−
Sn. The initial com-
posite, if composed in a suitable configuration, has
excellent deformation properties such that a geo-
Part 4 2.1
Superconductors 2.1 Metallic Superconductors 709
Table 4.2-10 Characteristic data at 4.2 K of commercial Nb
3
Sn superconductors produced according to the bronze
process; filament diameters 4 to 6 µm
Stabilization Filament Wire diameter Critical current density I
c
(A) Code
a
material (mm) at µ
0
H =
8T 10T 12 T 14 T
None Nb 0.5 202 136 78 − NS 4500 (0.5)
None Nb 0.7 374 252 144 − NS 6000 (0.7)
None Nb 1.0 753 504 289 − NS 10 000 (1.0)
None Nb
−
Ta 0.5 171 123 86 58 HNST 4500 (0.5)
None Nb
−
Ta 0.7 316 228 159 107 HNST 6000 (0.7)
None Nb
−
Ta 1.0 636 456 321 215 HNST 10 000 (1.0)
Cu/Ta core Nb 0.7 305 204 117 − NS 6000 (0.7) Ta I
Cu/Ta core Nb 1.0 623 417 239 − NS 10 000 (1.0) Ta I
Cu/Ta core Nb 1.25 973 652 373 − NS 13 000 (1.25) Ta I
Cu/Ta core Nb
−
Ta 0.7 258 185 130 87 HNST 6000 (0.7) Ta I
Cu/Ta core Nb
−
Ta 1.0 526 378 266 178 HNST 10 000 (1.0) Ta I
Cu/Ta core Nb
−
Ta 1.25 822 591 416 279 HNST 13 000 (1.25) Ta I
a
According to the VACRYFLUX
r
designations of Vacuumschmelze GmbH (1990); the figures without parentheses indicate the
approximate number of filaments
metrically well controlled wire results, in which
decoupling of the filaments can be optimized and
no bridging of filaments occurs. Table 4.2-10 shows
the characteristic data of commercial Nb
3
Sn su-
perconductors produced according to the bronze
process.
2. External Sn diffusion process: Nb filaments in a Cu
matrix are produced from a mechanical compos-
ite of rods by processing into wire form; at its
final diameter the wire is coated with Sn; during
a series of heat treatments with increasing tem-
perature, Sn and Cu react to form a Cu
−
Sn alloy
and this alloy reacts with the Nb filaments to form
Nb
3
Sn. This processis limited to wire with diameters
≤ 0.2mm.
3. Internal Sn diffusion process: Pure Sn or dilute Sn
alloys with Cu or Mg are incorporated in the ini-
tial rod composite: after processing into wire form
the Nb
3
Sn phase is formed by a diffusion–reaction
process with the Nb filaments. However, due to the
low melting point of Sn and its low yield stress, the
processing cannot use hot extrusion and the draw-
ing processes can readily lead to inhomogeneous
deformation and mechanical instabilities.
4. Jelly roll process: Nb foil or mesh and Cu foil are
wound into a roll as a starting rod which yields an Nb
filament bundle after processing into wire form. In
combination with the bronze or internal-Sn process
this results in Nb
3
Sn filaments with extremely low
diameter. It is difficult to scale the process to large
quantities and wire cross-sections.
The four processes mentioned require a final
diffusion–reaction treatment at 650 to 700
◦
C for 50 to
200 h. Since the stabilizing Cu constituent in the com-
posite must not be exposed to Sn interdiffusion in order
to maintain its high conductivity, a diffusion barrier is
incorporated in the composite which usually consists of
Ta in the form of a tube.
Nb Cu-Sn
Bronze process
Sn Cu Nb
External diffusion Internal diffusion
Solid–liquid diffusion Modified jelly roll
Sn Cu Nb
Nb Sn-Cu Nb foil
Cu-Sn foil
Cu
Sheath
Fig. 4.2-11 Processing routes of Nb
3
Sn superconductors [2.7]
Part 4 2.1
710 Part 4 Functional Materials
a) b)
Fig. 4.2-12a,b Examples of cross sections of superconductors pro-
duced by the internal-Sn (
(a) 0.8 mm diameter) and Nb-tube
(
(b) 0.5 mm diameter) processes [2.8]
a) b)
Fig. 4.2-13a,b Superconductors produced according to the bronze
process (Vacuumschmelze).
(a) Non-stabilized, 10 080 Nb filaments
inaCu
−
Sn matrix.
(b) Internally stabilized by Cu in a Ta tube, 6156
Nb filaments in a Cu
−
Sn matrix
5. Nb-tube process: The need of an extra barrier elem-
ent can be avoided by using Nb tubes, filled with Sn
or with a Sn compound such as NbSn
2
, embedded in
a Cu matrix. During heat treatment, a Nb
3
Sn layer
is formed inside the tube while its outer part acts
as a diffusion barrier. This processing route leads
to wires with high critical current densities but is
difficult to scale up for industrial production.
Schematic drawings of the composites according to
these five processing routes are shown in Fig. 4.2-11.
Examples of cross sections of superconductors pro-
duced by the internal-Sn, bronze, and Nb-tube processes
are shown in Figs. 4.2-12 and 4.2-13.
In Nb
3
Sn superconductors the flux lines are pinned
by the grain boundaries in the Nb
3
Sn filaments. The de-
pendence of the effective volume pinning force F
p
on the
grain size is shown in Fig. 4.2-14. This leads to the re-
quirement that the reaction temperature is optimized not
only regarding the rate of the diffusion–reaction process
but also regarding the resulting grain size.
Moreover, the critical current density depends
strongly on the state of strain in Nb
3
Sn, in particular
close to B
c2
. Figure 4.2-15 shows the strain sensitiv-
8
6
4
2
0
(N/m
3
×10
10
)
Grain size (nm)
100 50 33 25∞
0 0.01 0.02 0.03 0.04
1/Grain size (nm
–1
)
Fig. 4.2-14 Dependence of the volume pinning force F
p
in
Nb
3
Sn on the grain size
Intrinsic strain (%)
J
c
= J
cm
1.0
0.8
0.6
0.4
0.2
0 0.2 0.4 0.6– 0.4 – 0.2
4T
6
8
10
12
14
16
B=4T
6
8
10
12
14
16
Nb
3
Sn
Temperature = 4.2 K
Fig. 4.2-15 Strain sensitivity J
c
(ε) of Nb
3
Sn superconduc-
tors [2.10]
Part 4 2.1

Superconductors 2.2 Non-Metallic Superconductors 711
ity J
c
(ε) for binary Nb
3
Sn under uniaxial longitudinal
strain. In its state of formation, i. e., in the absence of
an externally applied strain, the Nb
3
Sn phase as formed
has an intrinsic compressive strain of ε
i
= 0.2–0.3%,
depending on the conductor design and processing pa-
rameters. Thus, applying a tensile strain will first lead
to an increase in J
c
. However, degradation sets in irre-
versibly if strains of a few tenths of one per cent are
exceeded due to crack formation in the brittle Nb
3
Sn
phase.
Table 4.2-10 lists characteristic data of commercial
Nb
3
Sn superconductors.
4.2.2 Non-Metallic Superconductors
4.2.2.1 Oxide Superconductors
Low-T
c
Superconducting Oxides
Only a few oxides with critical temperatures above
the boiling temperature of liquid helium (4.2 K) were
known up to 1986. Their T
c
did not exceed 14 K.
The stoichiometric composition of nearly all of these
compounds (T
c
> 4.2 K) is related to one of the for-
Table 4.2-11 Electrical and structural data of selected low-T
c
oxide superconductors
Compound Structure T
c
(K) µ
0
H
c2
(T) µ
0
H
c1
(mT)
Lattice parameters
a,b, c (nm)
BaPb
1−x
Bi
x
O
3
8–12
x = 0.2–0.3
a
Polycrystalline Orthorhombic (x =0.30) For x = 0.25: For x = 0.25:
a =0.6075, b = 0.610, 5.4 (1.8K) 23 (4.2K)
c =0.857 2.3 (8 K)
Tetragonal (x =0.275) For x =0.2:
a =0.6055, c = 0.8633 7.0 (1.15 K)
2.3 (6 K)
Single crystal Orthorhombic (x ≈0.25) For x =0.27:
a =0.6058, b = 0.6081, 3.8 (1.5K)
c =0.8552
Tetragonal (x ≈0.25) For x = 0.2:
a =0.6045, b = 0.8613 1.75 (3.5K)
Ba
0.9
K
0.1
Pb
0.75
−
Bi
0.25
O
3
11.5
BaSn
0.01
Pb
0.74–0.69
−
Bi
0.25–0.3
O
3
10–11
Li
1...1.3
Ti
2–1.67
O
4
Cubic 9.6–12 3.3 (0 K)
a =0.841–0.836
Li
2.6
Ti
1.5–2.7
O
4
Cubic 10.9–11.4 9.6–16.2(4.2K)
Rb
0.3
WO
3
Hexagonal 7.5–0.6
Cs
0.1
WO
2.9
F
0.1
Hexagonal ≈ 4.9 0.13–0.36
(Single crystal) a = 0.74;c =0.76 (dependent on
temperature and
crystal orientation
relative to H)
a
The electrical and structural data of BaPb
1−x
Bi
x
O
3
are values of different authors published in [2.2]
mulas:
BaPb
1−x
Bi
x
O
3
, Li
1+x
Ti
2−x
O
4
, or
A
y
WO
3
(y < 0.5;A =Cs;Rb).
Relatively high T
c
valuesof the Ba
−
Pb
−
Bi
−
Ocom-
pounds were also observed after substitution of small
amounts of K and Sr for Ba, respectively, and after
substitution of Sn for Pb (Table 4.2-11).
Part 4 2.2