Martienssen W., Warlimont H. (Eds.). Handbook of Condensed Matter and Materials Data
Подождите немного. Документ загружается.

722 Part 4 Functional Materials
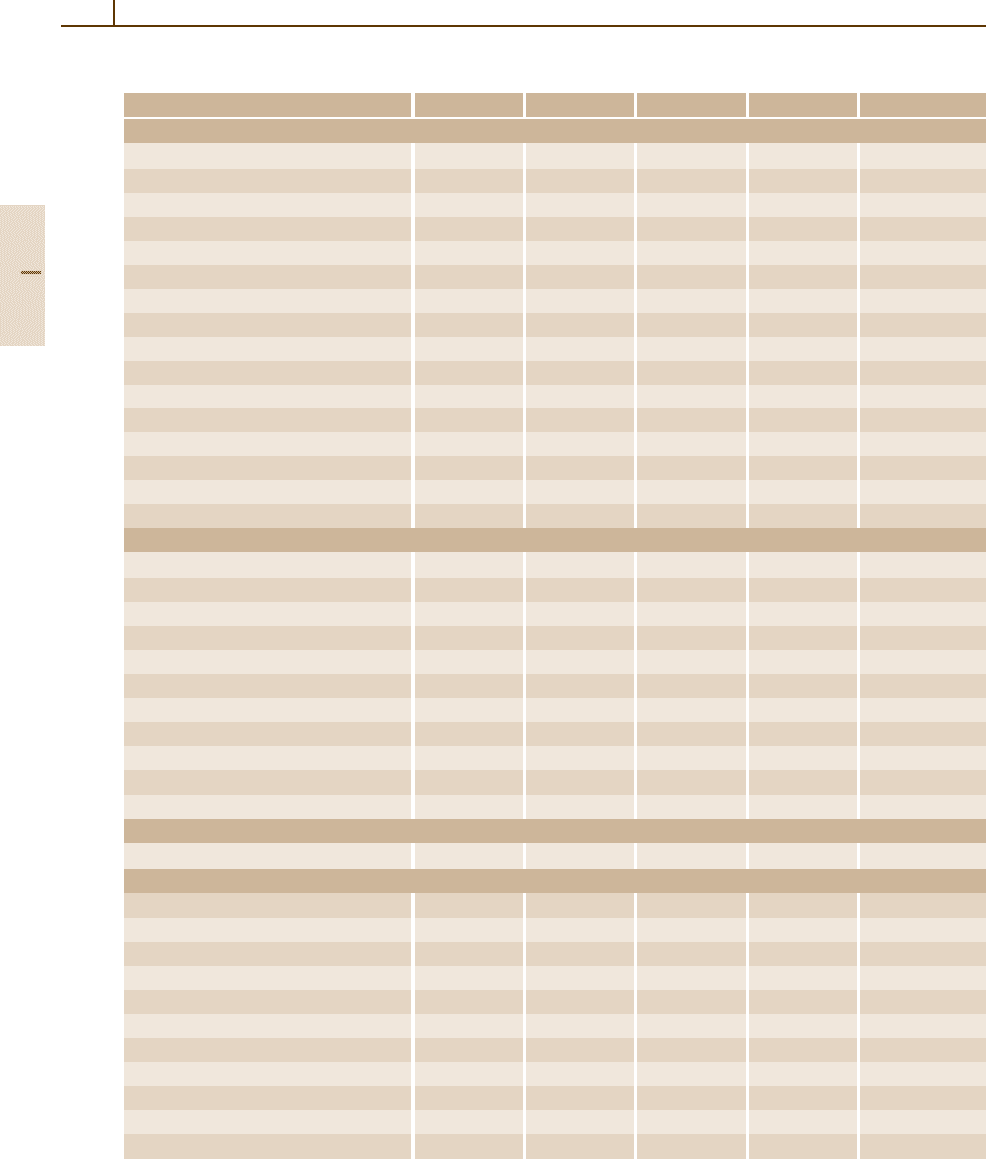
Table 4.2-16 Structural data of high-T
c
cuprates, cont.
Compound Space Group a (nm) b (nm) c (nm) Ref.
A
m
E
2
Ca
n−1
Cu
n
O
2n+m+2
family
Bi
2
(Sr
1.6
La
0.4
)CuO
6+x
Cmmm 0.5370 0.5400 0.2450 [2.15]
(Bi, Pb)
2
(Sr
1.75
La
0.25
)CuO
6
Cmmm 0.5282 0.5410 2.462 [2.15]
Bi
2
Sr
2
CaCu
2
O
8
(no-anneal) Pmmm 0.5413 0.5411 3.091 [2.15]
Bi
2
Sr
2
CaCu
2
O
8+x
(O
2
-annealed) Pmmm 0.5408 0.5413 3.081 [2.15]
Bi
2
Sr
2
Ca
2
Cu
3
O
10
Pmmm 0.539 0.539 3.71 [2.15]
(Bi
1.6
Pb
0.4
)Sr
2
Ca
2
Cu
3
O
10
Pmmm 0.5413 0.5413 3.7100 [2.15]
Pb
2
Sr
2
Ca
0.5
Ln
0.5
Cu
3
O
8
C/mmm 0.5435 0.5463 1.5817 [2.16]
Tl
2
Ba
2
CuO
6
I4/mmm 0.3866 0.38662 2.3239 [2.15]
Tl
2
Ba
2
CaCu
2
O
8
I4/mmm 0.38550 0.38550 2.9318 [2.15,16]
Tl
2
Ba
2
Ca
2
Cu
3
O
10
I4/mmm 0.38503 0.38503 3.588 [2.15]
TlBa
2
Ca
2
Cu
3
O
9
P4/mmm 0.3853 1.5913 [2.16]
(Tl
0.5
Pb
0.5
)Sr
2
CaCu
2
O
7
P4/mmm 0.38023 0.38023 1.2107 [2.15]
(Tl
0.5
Pb
0.5
)Sr
2
(Ca
0.8
Y
0.2
)Cu
2
O
7
P4/mmm 0.38075 0.38075 1.2014 [2.15]
(Tl
0.5
Pb
0.5
)Sr
2
Ca
2
Cu
3
O
9
P4/mmm 0.38206 0.38206 1.5294 [2.15]
TlSr
2
Ca
0.5
Y
0.5
Cu
2
O
7
P4/mmm 0.380 1.210 [2.16]
Pb
2
(Y
1−x
Ca
x
)Sr
2
Cu
3
O
8
Cmmm 0.53933 0.54311 1.57334 [2.15]
AE
2
CuO
4−5
family
(Hg
0.8
V
0.2
)Ba
2
CuO
4.3
0.38860 0.9338 [2.14]
(Hg
0.8
Mo
0.2
)Ba
2
CuO
4.4
0.3882 0.9378 [2.14]
(Hg
0.9
Mo
0.1
)Ba
2
CuO
4.2
0.3875 0.9435 [2.14]
(Hg
0.8
W
0.2
)Ba
2
CuO
4.4
0.3871 0.9416 [2.14]
(Hg
0.9
W
0.1
)Ba
2
CuO
4.2
0.3875 0.9450 [2.14]
(Hg
0.8
Ru
0.2
)Ba
2
CuO
4.2
0.3879 0.9473 [2.14]
(Hg
0.7
Cr
0.3
)Sr
2
CuO
4.15
0.3845 0.8683 [2.14]
(Hg
0.8
Mn
0.2
)Ba
2
CuO
4.2
0.3890 0.9343 [2.14]
(Hg
0.8
Nb
0.2
)Ba
2
CuO
4.3
0.3885 0.9461 [2.14]
(Hg
0.8
Mo
0.2
)Sr
2
CuO
x
0.3797 0.8818 [2.14]
(Hg
0.9
Re
0.1
)Sr
2
CuO
x
0.3783 0.8883 [2.14]
A
2
Ca
n−1
Cu
n
O
2n+2
family
La
1.6
Sr
0.4
CaCu
2
O
6
I4/mmm 0.38208 0.38208 1.95993 [2.15]
Other Compounds
YBa
2
Cu
4
O
8
Ammm 0.386 0.386 2.724 [2.15]
HoBa
2
Cu
4
O
8
Ammm 0.3855 0.3874 2.7295 [2.15]
Bi
2
Sr
2
(Ln
1−x
Ce
x
)
2
Cu
2
O
10
P4/mmm 0.3888 1.728 [2.16]
Ca
1−x
Sr
x
Cu
2
O
2
P4/mmm 0.3902 0.335 [2.16]
(Pb, Cu)Sr
2
(Ln, Ca)Cu
2
O
7
P4/mmm 0.3820 1.1826 [2.16]
(Pb, Cu)(Sr, Eu)(Eu, Ce)Cu
2
O
x
I4/mmm 0.3837 2.901 [2.16]
Sr
1−x
Nd
x
CuO
2
P4/mmm 0.3942 0.3393 [2.16]
Tl(Ba, La)CuO
5
P4/mmm 0.383 0.955 [2.16]
Tl(Sr, La)CuO
5
P4/mmm ≈ 0.37 ≈ 0.9 [2.16]
(Tl
0.5
Pb
0.5
)Sr
2
CuO
6
[2.16]
(Tl
0.7
Cd
0.3
)BaLaCuO
5
P4/mmm 0.3844 0.38440 0.916 [2.15]
Part 4 2.2
Superconductors 2.2 Non-Metallic Superconductors 723
4.2.2.2 Superconductors Based
on the Y–Ba–Cu–O System
The first superconducting compound with T
c
above
the boiling point of liquid nitrogen (T ≈ 77 K) was
discovered as a mixed copper oxide representative of
the system Y
−
Ba
−
Cu
−
O at ambient pressure by Wu
et al. in 1987 [2.25], and marked the beginning of the
worldwide high-temperature superconductor (HTSC)
research. Since then, YBa
2
Cu
3
O
7−δ
is one of the com-
pounds studied most frequently. It is often abbreviated
as “Y-123” or “YBCO”.
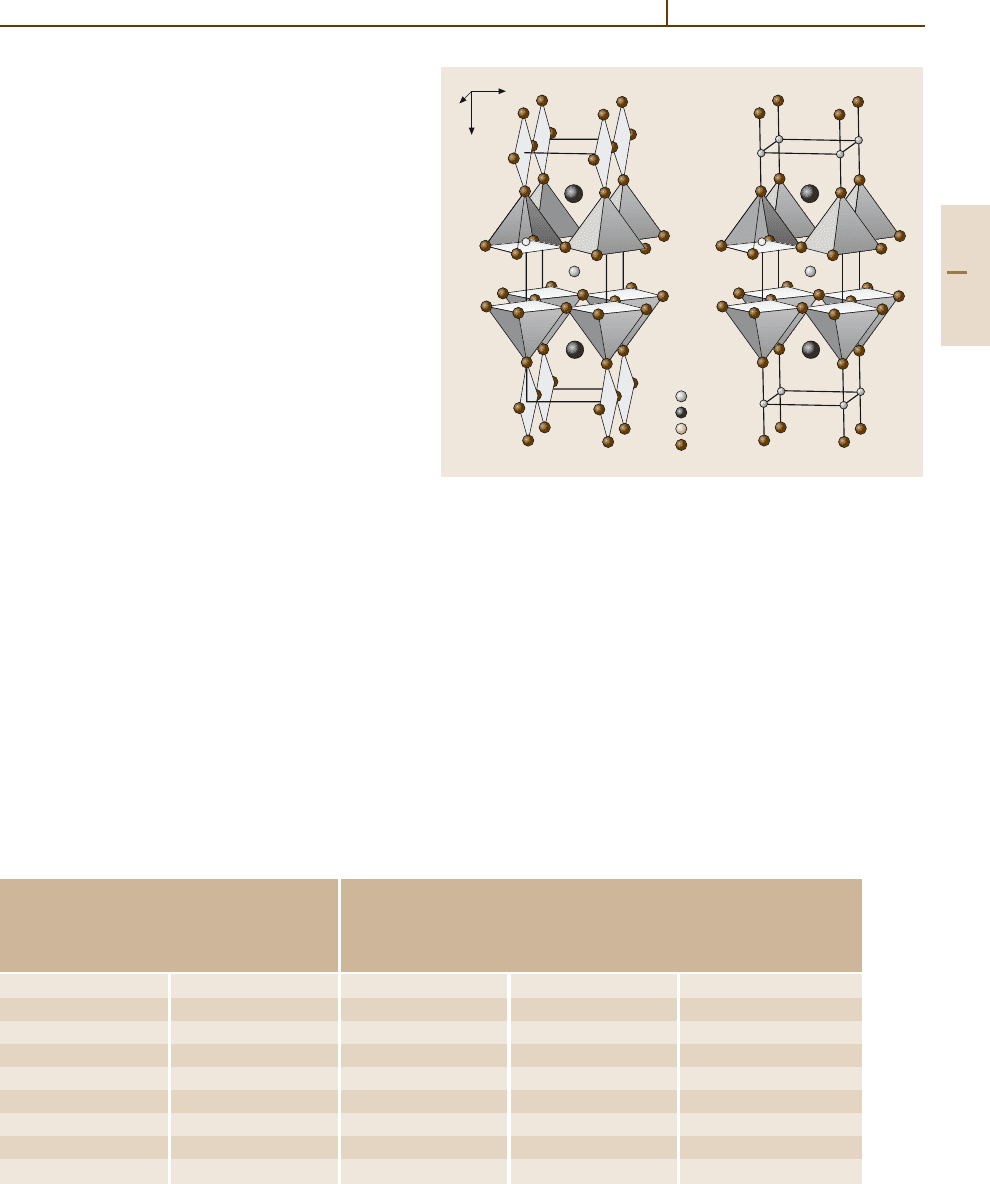
Structural Properties
Crystal Structure. The crystal structureof YBa
2
Cu
3
O
7−δ
has been analysed by diffraction studies and high res-
olution electron microscopy. The structure is of an
orthorhombic perovskite type with oxygen deficiency
and an ordered arrangement of the cations Y and Ba
(Fig. 4.2-23). Compared with octahedral coordination in
the perovskite type structure, 2/9 of the oxygen sites in
YBCO are unoccupied, leading to coordination numbers
CN = 5andCN = 4 for two different Cu sites, respec-
tively. For δ =0 the unit cell contains one Cu atom in
the oxidation state +3 and two Cu atoms in the oxida-
tion state +2. The latter Cu atoms are coordinated by
five O atoms forming a square-pyramidal coordination
sphere (4 shorter Cu
−
O bonds, d(Cu
−
O)<2 Å; one
longer bond to the apex of the pyramid, d ≈ 2.29 Å),
while the remaining Cu atom shows a fourfold, nearly
square-planar coordination (d(Cu
−
O)<2 Å). These
rectangles are connected via vertices forming chains
along the b axis [010]. The pyramids are also connected
via vertices forming a two-dimensional arrangement
Table 4.2-17 Crystal structure data of orthorhombic YBa
2
Cu
3
O
7
at T = 300 K [2.24]
Formula
Space group
Lattice parameters
YBa
2
Cu
3
O
7
Pmmm (No. 47)
a = 3.8206(1) Å
b = 3.8851(1) Å
c = 11.6757(4) Å
Atom Site x y z
Y 1h 1/2 1/2 1/2
Ba 2t 1/2 1/2 0.1841(4)
Cu(1) 1a 0 0 0
Cu(2) 2q 0 0 0.3549(3)
O(1) 1e 0 1/2 0
O(2) 2q 0 0 0.1581(4)
O(3) 2r 0 1/2 0.3777(5)
O(4) 2s 1/2 0 0.3779(4)
b
c
a
Cu
Ba
Y
O
Fig. 4.2-23 Crystal structure of YBa
2
Cu
3
O
7
(δ = 0, left)and
YBa
2
Cu
3
O
6
(δ = 1, right)
within the ab-plane. The O
−
Cu
−
O angles within the
layers are smaller than 180
◦
, thus distorting the planar
character of the layers. Ba atoms are coordinated by ten
O atoms whereas Y atoms show CN = 8.
The high-T
c
compound YBa
2
Cu
3
O
7−δ
crystallizes
in the orthorhombic space group Pmmm (No. 47) with
T
c
≈ 91 K for 0 ≤ δ ≤ 0.2 (Table 4.2-17). The super-
conducting properties depend on the oxygen content
7−δ. Oxygen loss on the 1e site [O(1) in YBa
2
Cu
3
O
7
]
leads to a destruction of the Cu
−
O chains. For
δ = 1 only linear coordinated Cu(1) atoms are present.
Part 4 2.2
724 Part 4 Functional Materials
Table 4.2-18 Crystal structure data of tetragonal YBa
2
Cu
3
O
6
[2.26]
Formula
Space group
Lattice parameters
YBa
2
Cu
3
O
6
P4/mmm (No. 123)
a = 3.865(1) Å
c = 11.852(3) Å
Atom Site x y z
Y 1d 1/2 1/2 1/2
Ba 2h 1/2 1/2 0.1951(2)
Cu(1) 1a 0 0 0
Cu(2) 2g 0 0 0.3609(1)
O(1) 2g 0 0 0.1521(5)
O(2) 4i 0 1/2 0.3793(3)
The non-superconducting YBa
2
Cu
3
O
7−δ
phase with
0.5 ≤ δ ≤1, an antiferromagnetic insulator, crystallizes
in a tetragonal unit cell, space group P4/mmm (No.
123) (Table 4.2-18).
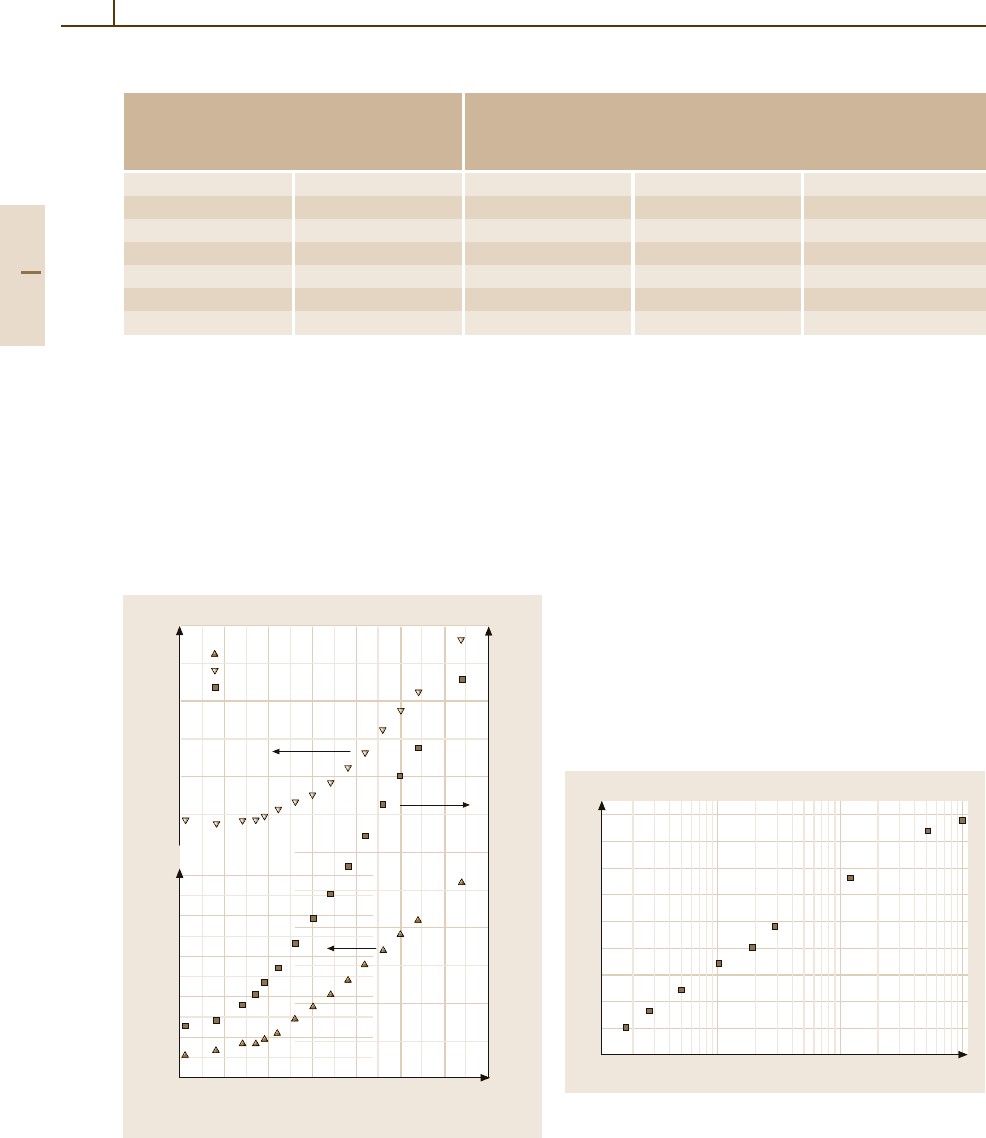
The temperature dependence of the lattice param-
eters of orthorhombic YBa
2
Cu
3
O
6.91
(see Fig. 4.2-24)
was determined [2.27] in the range 5 K ≤ T ≤ 320 K.
With decreasing temperature the lattice contracts mainly
Temperature T (K)
0 50 100 150 200 300250 350
3.884
3.882
3.880
3.818
3.816
3.814
3.812
3.810
3.808
11.69
11.68
11.67
11.66
11.65
11.64
11.63
Lattice parameter b (Å)
Lattice parameter a (Å)
Lattice parameter c (Å)
a
b
c
a
b
c
Fig. 4.2-24 Lattice parameters of YBa
2
Cu
3
O
6.91
as func-
tion of the temperature [2.27].
along [001] perpendicular to the Cu
−
O layers. Small
anomalies of the lattice parameters occur at 90 K.
Oxygen Content in YBa
2
Cu
3
O
7−δ
. The oxygen con-
tent of YBa
2
Cu
3
O
7−δ
depends on temperature and
oxygen partial pressure. YBa
2
Cu
3
O
7
can be prepared
at T < 400
◦
C in an oxygen atmosphere. The oxygen
content can be controlled by annealing in an inert at-
mosphere or vacuum, or by O-gettering with Zr or Ti.
The lower the O partial pressure during annealing of
YBa
2
Cu
3
O
7
, the larger is the weight loss (Table 4.2-19,
Fig. 4.2-25).
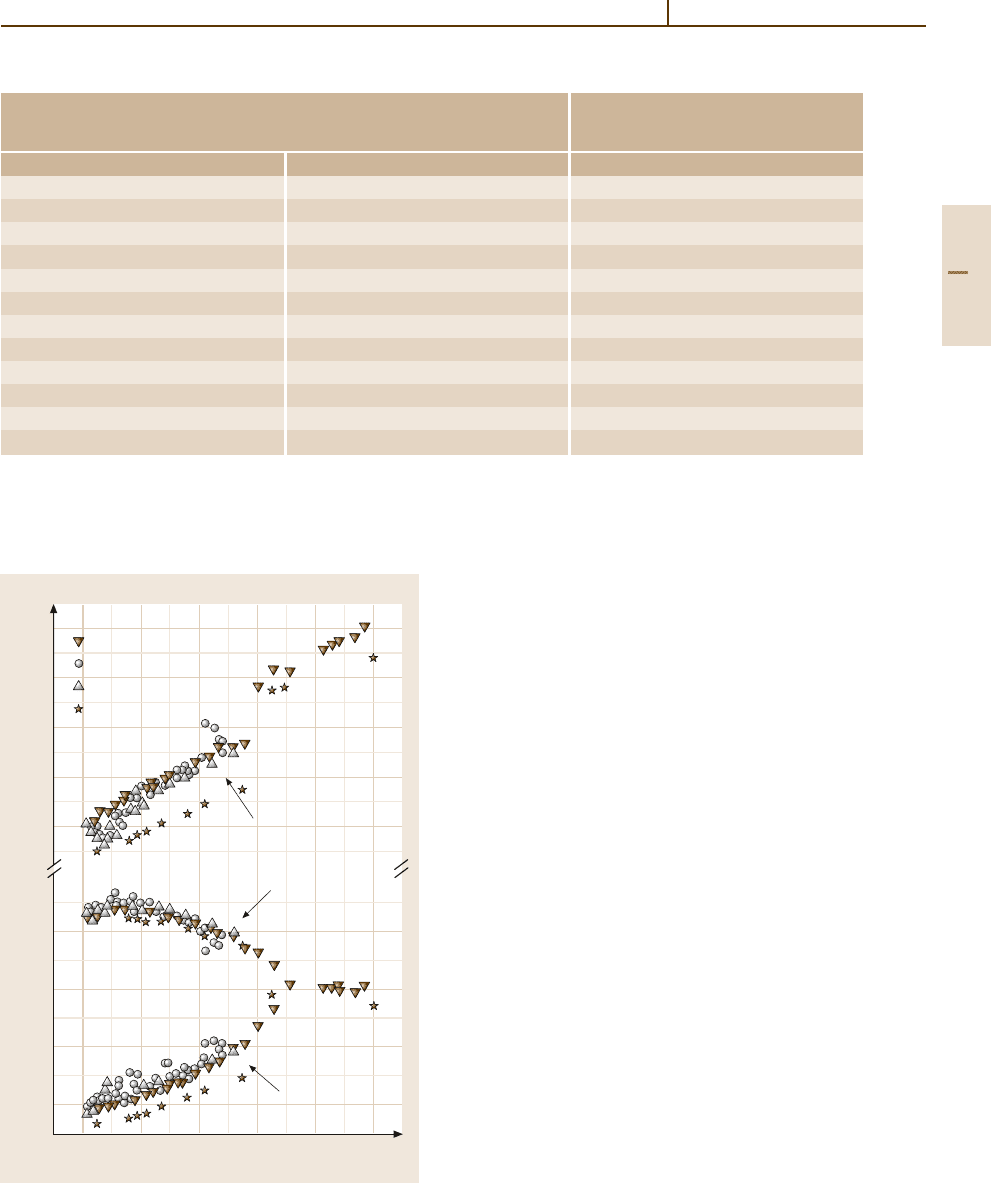
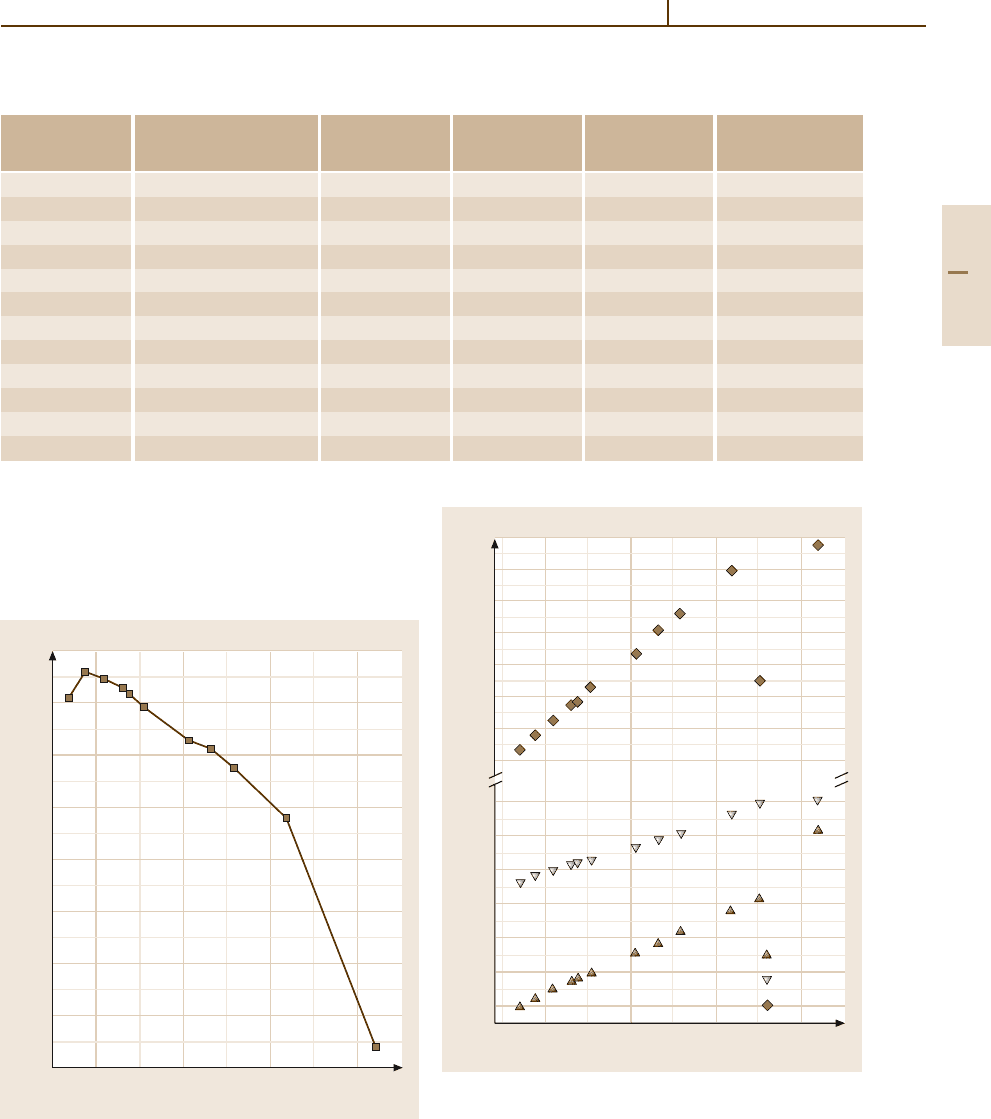
Increasing O loss leads to an increase of the lattice
parameters a and c, whereas b decreases. At the phase
transformation from the orthorhombic to the tetragonal
symmetry (7−δ ≈ 6.35) a discontinuious length change
6.8
6.7
6.6
6.5
6.4
0.01 0.1 1
p(O
2
) (atm)
Oxygen content (7–δ) in YBa
2
Cu
3
O
7–δ
Fig. 4.2-25 Oxygen content (7 −δ) of YBa
2
Cu
3
O
7−δ
de-
termined by weight loss, annealing conditions: T = 520
◦
C,
t between 21 h and 27 h at different oxygen partial pres-
sures p(O
2
) [2.28]
Part 4 2.2
Superconductors 2.2 Non-Metallic Superconductors 725
Table 4.2-19 Annealing conditions according to [2.28] for oxygen-deficient samples YBa
2
Cu
3
O
7−δ
, T = 520
◦
C
Annealing conditions Oxygen
content
(7−δ)
p(O
2
)(atm) t(h) Weight loss
1.00 21 6.84
0.515 25 6.82
0.12 22 6.73
0.29 27 6.64
0.019 23 6.60
0.010 21 6.57
0.005 22 6.52
0.0027 21 6.48
0.00175 22 6.45
0.00107 21 6.40
0.001 22 6.40
0.000415 23 6.34
in the c axis occurs, whereas a and b become equal
(Table 4.2-20, Fig. 4.2-26).
c
b
a
Oxygen content (7–δ) in YBa
2
Cu
3
O
7–δ
Lattice parameter (Å)
7.0 6.8 6.6 6.4 6.2 6.0
11.84
11.80
11.76
11.72
11.68
3.88
3.86
3.84
3.82
Precursor material
Carbonate
Ba-oxide
Ba-metal
BaCO
3
, Oxides
Chemical Substitution. RBa
2
Cu
3
O
7−δ
:R=Y and Rare-
earth Metals; 7 −δ =6 and 7.
The substitution of Y by
trivalent rare earth metals has been studied extensively.
The materials Ce and Tb do not form the orthorhombic
123-phase, and PmBa
2
Cu
3
O
7
has not been synthesized
due to the short lifetime of radioactive Pm. The Lu com-
pound is unstable in the polycrystalline ceramic form,
but can be prepared as thin films.
For RBa
2
Cu
3
O
7−δ
(7 −δ = 6 and 7), the lattice
parameters as well as a large number of interatomic
distances show linear dependence on the ionic ra-
dius of the trivalent rare earth metal according to
the lanthanide contraction, except for PrBa
2
Cu
3
O
7
which is semiconducting, antiferromagnetic and shows
no superconductivity. The superconducting transition
temperature reaches a maximum for the Nd phase (Ta-
bles 4.2-21–4.2-22, Figs. 4.2-27–4.2-29).
Further Substitutions. Calcium atoms can substitute Y.
The higher the Ca content, the lower is T
c
. Substitution
on the Ba site is reported for La, Sr, Nd, as well as for
Na and K. Copper atoms can be substituted by transition
metals M (e.g. M = Ti,V,Cr,Mn,Fe,Co,Ni,Zn,Pd,
Ag) and main group metals (e.g. Li, Mg, Al, Ga). Con-
cerning the substitution of oxygen, only fluorine has
Fig. 4.2-26 Lattice parameters of YBa
2
Cu
3
O
7−δ
as a func-
tion of the oxygen content 7 −δ; samples prepared from
different precursor materials [2.29]; ◦ [2.29]; [2.29];
∗ [2.30]
Part 4 2.2
726 Part 4 Functional Materials
Table 4.2-20 Dependence of the lattice parameters and T
c
on the oxygen content [2.30] (n.d. = not determined)
Oxygen content
(7−δ) in
YBa
2
Cu
3
O
7−δ
T
c
(K) a (Å) b (Å) c (Å) V (Å
3
)
6.95 90 3.8136 3.8845 11.6603 172.73
6.84 88 3.8153 3.8848 11.6692 172.96
6.81 86 3.8163 3.8845 11.6739 173.06
6.78 n.d. 3.817 3.8836 11.6768 173.09
6.73 69 3.8193 3.8835 11.6832 173.29
6.64 59 3.8224 3.8811 11.6912 173.44
6.58 56 3.8252 3.8786 11.6987 173.57
6.45 56 3.8293 3.875 11.7101 173.76
6.35 – 3.858 3.858 11.7913 175.50
6 – 3.8544 3.8544 11.8175 175.57
Table 4.2-21 Lattice parameters of RBa
2
Cu
3
O
7−δ
(orthorhombic, Pmmm) according to Guillaume et al. [2.32] at T =
10 K, superconducting transition temperature T
c
[2.32] and structural phase transformation temperature orthorhombic →
tetragonal T
trans
[2.33]; ionic radii according to Shannon [2.34]
Atom R Ionic radius r of
R
3+
(Å), CN = 8
a (Å) b (Å) c (Å) V (Å
3
) Oxygen
content
(7−δ)
T
c
(K) T
trans
(K)
Y 1.019 3.817(1) 3.883(1) 11.637(1) 172.48 7.00 90(1) 959
La 1.160 3.903(1) 3.920(1) 11.735(1) 179.54 7.06(5) 50(3) 620
Ce 1.143
Pr 1.126 3.863(1) 3.918(1) 11.650(1) 176.33 6.98(3) 0
Nd 1.109 3.856(1) 3.912(1) 11.719(1) 176.78 6.98(3) 96(1) 839
Pm 1.093
Sm 1.079 3.844(1) 3.901(1) 11.692(1) 175.33 6.98(3) 94(1) 888
Eu 1.066 3.836(1) 3.897(1) 11.682(1) 174.63 6.98(3) 95(1) 906
Gd 1.053 3.831(1) 3.893(1) 11.667(1) 174.00 6.99(3) 94(1) 914
Tb 1.040
Dy 1.027 3.820(1) 3.885(1) 11.646(1) 172.83 6.98(3) 92(1) 945
Ho 1.015 3.815(1) 3.882(1) 11.635(1) 172.31 7.02(3) 90(1) 964
Er 1.004 3.810(1) 3.879(1) 11.625(1) 171.81 7.02(3) 90(1) 972
Tm 0.994 3.805(1) 3.876(1) 11.616(1) 171.31 7.02(3) 90(1) 979
Yb 0.985 3.800(1) 3.872(1) 11.607(1) 170.78 7.02(3) 90(1) 954
Lu 0.977 92
Table 4.2-22 Lattice parameters of RBa
2
Cu
3
O
7−δ
(tetragonal, P4/mmm) according to Guillaume et al. [2.32] at T =
10 K, ionic radii according to Shannon [2.34]
Atom R Ionic radius r of
R
3+
(Å), CN = 8
a (Å) c (Å) V (Å
3
) Oxygen
content
(7−δ)
Y 1.019 3.856(1) 11.793(1) 175.35 6.11(3)
La 1.160 3.915(1) 11.850(1) 181.63 6.04(3)
Ce 1.143
Pr 1.126 3.900(1) 11.832(1) 179.96 6.15(3)
Part 4 2.2
Superconductors 2.2 Non-Metallic Superconductors 727
Table 4.2-22 Lattice parametersof RBa
2
Cu
3
O
7−δ
(tetragonal, P4/mmm) according to Guillaume et al. [2.32]at T =10 K,
ionic radii according to Shannon [2.34], cont.
Atom R Ionic radius r of
R
3+
(Å), CN = 8
a (Å) c (Å) V (Å
3
) Oxygen
content
(7−δ)
Nd 1.109 3.893(1) 11.830(1) 179.29 6.12(3)
Pm 1.093
Sm 1.079 3.880(1) 11.815(1) 177.87 6.11(3)
Eu 1.066 3.879(1) 11.811(1) 177.72 6.13(3)
Gd 1.053 3.872(1) 11.807(1) 177.02 6.06(3)
Tb 1.040
Dy 1.027 3.860(1) 11.796(1) 175.76 6.12(3)
Ho 1.015 3.855(1) 11.792(1) 175.24 6.10(3)
Er 1.004 3.850(1) 11.789(1) 174.74 6.08(3)
Tm 0.994 3.843(1) 11.785(1) 174.05 6.10(3)
Yb 0.985 3.839(1) 11.781(1) 173.63 6.14(3)
Lu 0.977
been studied intensively. T
c
decreases with increasing
substitution nearly without exception (see “Supercon-
ducting transition temperature”). For additional partial
substitution possibilities and advanced literature: [2.31].
1000
950
900
850
800
750
700
650
600
Transformation temperature T (K)
Ionic radius r of R
3+
1.00 1.05 1.10 1.15
Fig. 4.2-27 Orthorhombic to tetragonal transformation
temperature T
trans
at an oxygen partial pressure of p =1atm
as a function of the ionic radii of the R
3+
ions (CN = 8)
11.74
11.72
11.70
11.68
11.66
11.64
11.62
11.60
Ionic radius r of R
3+
1.00 1.05 1.10 1.15
Lattice parameter (Å)
3.92
3.90
3.88
3.86
3.84
3.82
3.80
a (Å)
b (Å)
c (Å)
Fig. 4.2-28 Lattice parameters of RBa
2
Cu
3
O
7
(or-
thorhombic, Pmmm) [2.32] at T = 10 K, with ionic
radii according to Shannon [2.34]. Note the large devi-
ation of the lattice parameter c of non-superconducting
PrBa
2
Cu
3
O
7
Part 4 2.2
728 Part 4 Functional Materials
11.85
11.84
11.83
11.82
11.81
11.80
11.79
11.78
Ionic radius r of R
3+
1.00 1.05 1.10 1.15
Lattice parameter (Å)
3.92
3.90
3.88
3.86
3.84
a (Å)
c (Å)
Fig. 4.2-29 Lattice parameters of RBa
2
Cu
3
O
6
(tetrago-
nal, P4/mmm) [2.32] at T = 10 K, ionic radii according
to Shannon [2.34]
Microstructural Features.
Crystal defects in YBCO
grown from the melt may be grouped into crystal de-
fects which are associated with the solidification process
and those which are influenced by volume fraction and
the size of the secondary phase Y
2
BaCuO
5
particles, the
so-called 211-phase. Diko [2.37] specified the groups of
crystal defects as follows:
Crystal defects associated with crystallization from
the melt:
•
Porosity
•
Subgrains
•
211-particles and their inhomogeneity in the sample
•
Shape change of the sample
•
High angle grain boundaries
•
Macrocracks
•
Secondary phases
Crystal defects influenced by the volume fraction and
size of 211-particles:
•
Residual dilation stresses around 211 particles
•
Microcracks in a-b planes
•
Twin structures
211-Particles. Non-superconducting 211-particles may
be formed as a dispersion in the 123-phase as the ma-
trix. These particles have a strong pinning effect on the
magnetic flux lines. In agreement with theory J
c
in-
creases proportionally to V
f
/d, where V
f
is the volume
fraction of the 211-phase particles and d is their average
size, as shown in Fig. 4.2-30.
Macrocracks. The stresses arising between the 123-
grains on cooling lead to the formation of macro-
cracks. These stresses stem from the anisotropy of
the thermal expansion of the lattice of the 123-
phase. The c axis contracts to a higher degree
than the a and b axes and the residual stresses
puts c-grain boundaries under tension. Data of the
temperature dependence of the thermal expansion
coefficient α = d[ln L(T )]/dT at low temperatures
are plotted for all three axes in Fig. 4.2-31 accord-
ing to [2.38]. For further studies on Y-123 up to
T = 500 K and for YBa
2
Cu
3
O
7−δ
,δ=0, and δ = 0.05,
see [2.39].
As an important microstructural feature twinning do-
mains have to be considered. These twinning domains
occur at oxygen-rich compositions. The formation of
twins arises as a strain relief effect during the structural
J
c
(A'/cm
–2
)
40000
30000
20000
10000
0
0 1000 3000
Volume fraction V
f
/d (cm)
2000
77 K,
c//H'
Fig. 4.2-30 Critical current density as a function of V
f
/d
of the 211-phase particles for melt-processed samples [2.35,
36]
Part 4 2.2
Superconductors 2.2 Non-Metallic Superconductors 729
T (K)
0 100 200 300
α (10
–6
K
–1
)
25
20
15
10
5
0
c-axis
a-axis
b-axis
a)
T (K)
∆α (10
–6
K
–1
)
0
1
0
0
75 80 85 90 95 100 105
b)
c-axis
a-axis
b-axis
phase transformation from tetragonal to orthorhombic
symmetry.
Fig. 4.2-31 Coefficient of thermal expansion α of
YBa
2
Cu
3
O
7−δ
at T ≤ 300 K (a) and (b) expanded view
of the change in expansivity ∆α near the transition tem-
perature T
c
obtained by subtracting a linear fit above T
c
from the data
Grain Boundaries.
The critical current density asa func-
tion of the magnetic field strength for a typical sintered
polycrystalline sample and for a single crystal film is
shown in Fig. 4.2-32. The critical current densities of
polycrystalline samples are more sensitive to applied
magnetic fields than those of single crystalline materials.
Furthermore, the maximum critical current densities
measured on epitaxial films exceed 10
6
Acm
−2
, which
is some 10
3
–10
4
times larger than for bulk poly-
crystalline samples. The critical current density of
polycrystalline samples is controlled by the weak link
effect of the grain boundaries. This detrimental effect of
10
7
10
6
10
5
10
4
10
3
10
2
10
1
010.5 1.5
Transport critical current (A/cm
2
)
Thin films
Aligned grain sample
Bulk sample
Magnetic field (T)
2
Fig. 4.2-32 Critical current density on dependence on the
applied magnetic field for a single crystal film and a sintered
sample [2.40]
Part 4 2.2
730 Part 4 Functional Materials
the grain boundaries is also evidenced by the occurrence
of a rapid decrease in J
c
with an applied field (a field of
few mT will reduce J
c
to zero), whereas such fields do
not lower the J
c
values of single crystals significantly.
High-Angle Grain Boundaries. The critical current
density across a grain boundary decreases exponen-
tially with increasing grain-boundary misorientation
angle. At low misorientation angles between 2
◦
and
5
◦
, a plateau without observable reduction of J
c
is
suggested [2.44, 45]. Possible mechanisms could be
connected with the reduction of the current-carrying
cross-section by local suppression of the order parame-
ter at the grain boundaries or by insulating dislocation
cores. Figure 4.2-21 shows the critical current densities
of [001]-tilt grain boundaries in YBCO films [2.21].
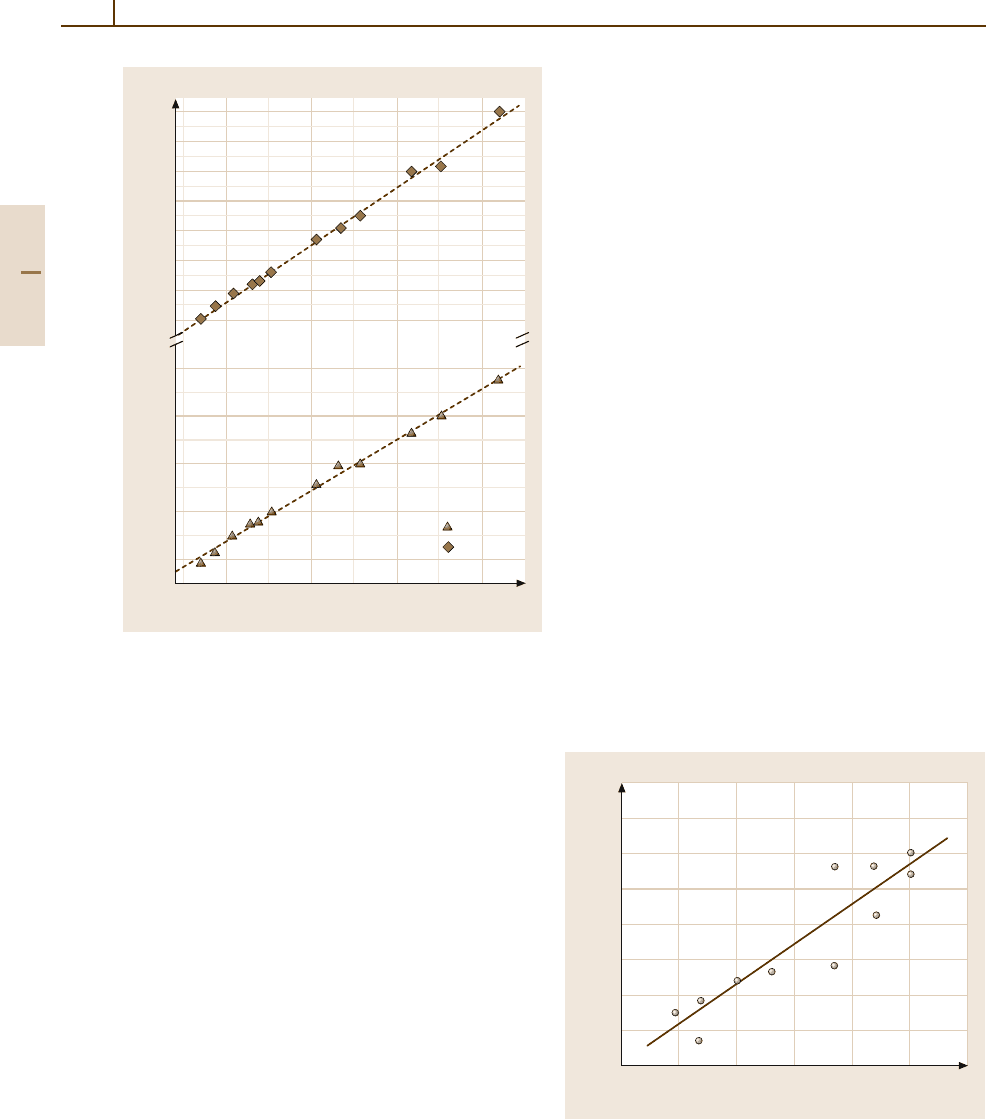
Electrical Resistivity. According to the crystal struc-
ture the electrical resistivity of YBCO is anisotropic.
Figure 4.2-33 shows the temperature dependence of ρ
for a twin-free YBCO single crystal along the or-
thorhombic axes. Resistivity measurements on sintered
YBa
2
Cu
3
O
7−δ
samples with various oxygen defi-
ciencies show a large increase in resistivity with
increasing δ [2.42,43] (Fig. 4.2-34).
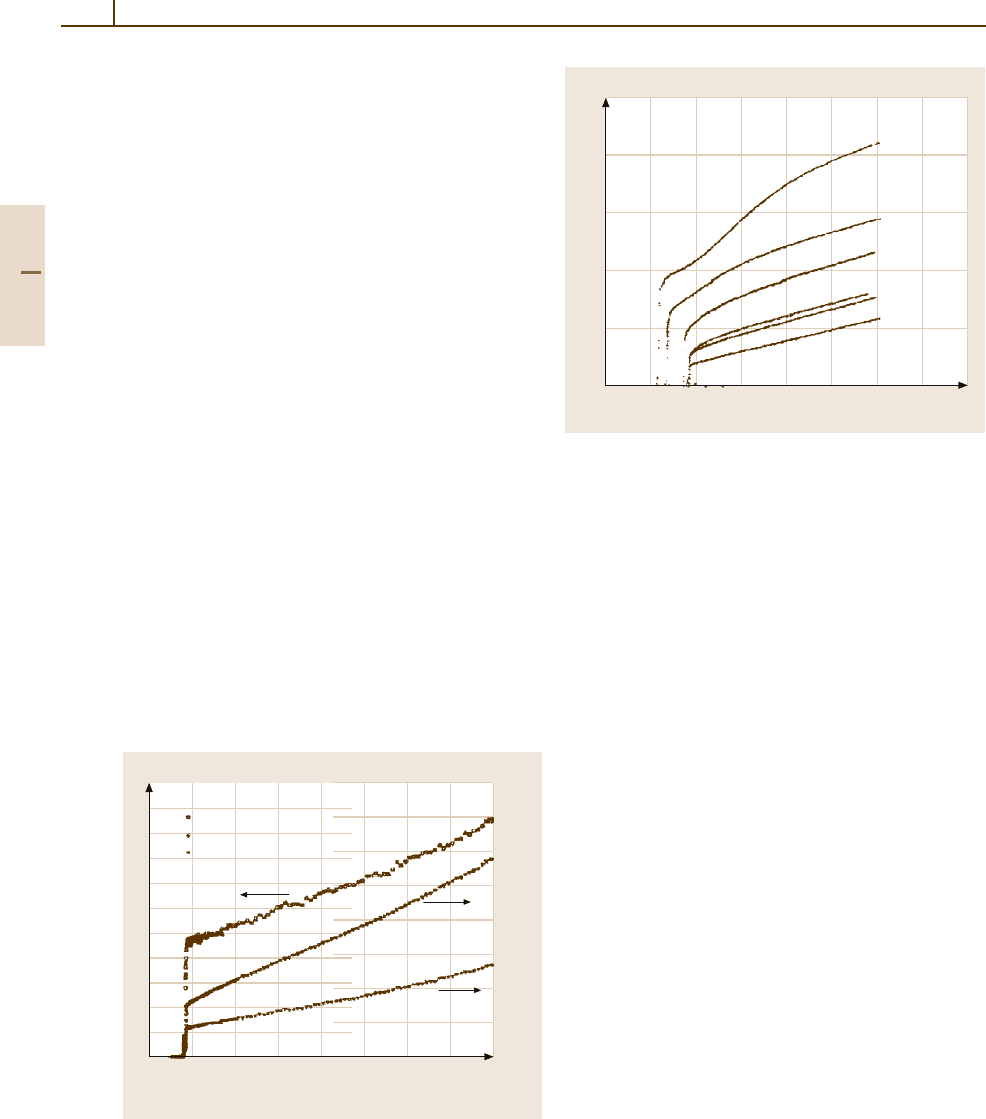
Resistivity as a Function of Temperature and Oxygen
Content.
The in-plane (ρ
a
) as well as the out-of-
plane (ρ
c
) resistivity of detwinned YBCO crystals
5
4
3
2
1
0
T (K)
200
175
150
125
100
75
50
25
0
(µΩ cm)(mΩ cm)
c
75 100 125 150 175 200 225 250 275
ρ
ρρ
a
ρ
b
ρ
Fig. 4.2-33 Anisotropic resistivity of YBCO for a twin-
free single crystal along the orthorhombic axes [2.41]
T (K)
(mΩ cm)
2.5
2
1.5
1
0.5
0
0 50 100 150 200 300 400250 350
ρ
δ=0.4
0.3
0.18
0.1
0.05
0.0
Fig. 4.2-34 Temperature dependence of the resistivity of
YBa
2
Cu
3
O
7−δ
[2.42,43]
decrease with increasing oxygen content. Moreover, the
out-of-plane resistivity shows a crossover from high-
temperature metallic behavior (dρ
c
/dT > 0) to low-
temperature semiconducting behavior (dρ
c
/dT < 0).
The in-plane resistivity (perpendicular to the CuO chain)
deviates in the low-temperature region from linear tem-
perature dependence (Fig. 4.2-35).
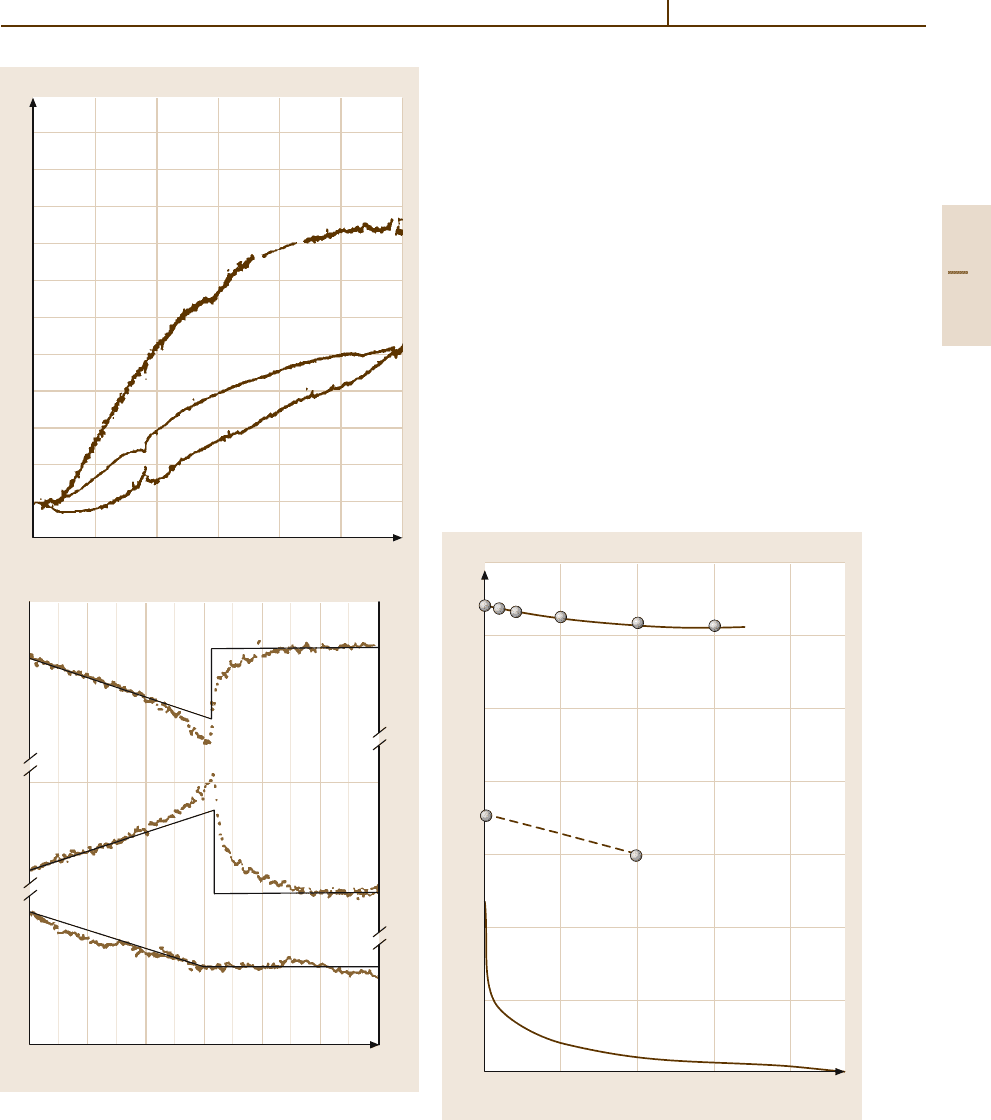
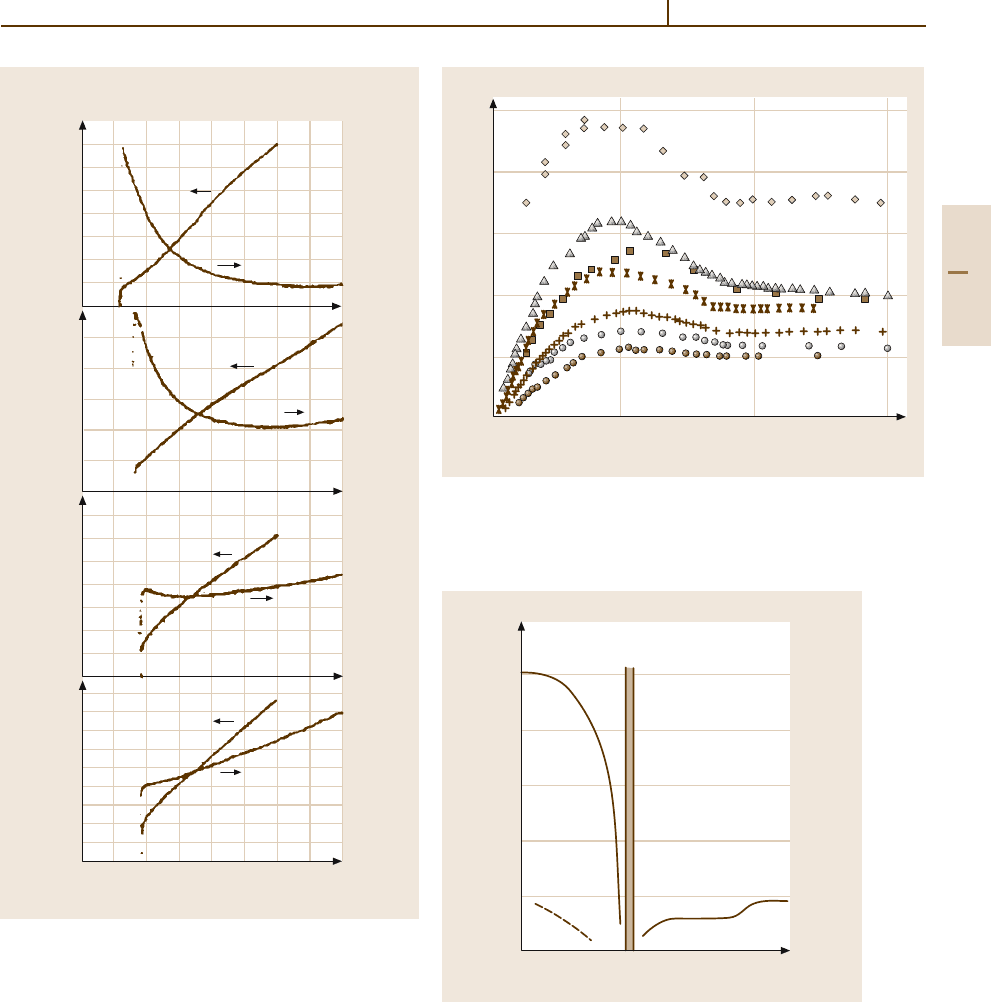
Thermal Conductivity. The thermal conductivity κ(T )
shows a maximum in the temperature range
40 K ≤ T ≤ 90 K and a change of the slope at T
c
,as
shown in Fig. 4.2-36. The experimental data depend on
the sample microstructure, the oxygen content, crys-
talline borders and the admixture.
Phase Diagram. Figure 4.2-37 shows a schematic par-
tial phase diagram for YBa
2
Cu
3
O
7−δ
as a function of
the oxygen content 7 −δ.At7−δ = 6 the compound
is an antiferromagnetic insulator with T
N
≈ 500 K. At
high δ values two antiferromagnetic phases are marked,
with only Cu spins in the plane layers ordered (AFM), or
Cu spins in the chain layers also ordered (AFM
c
). With
decreasing δ the hole concentration increases, while T
N
decreases. At 7 −δ ≈6.45, antiferromagnetism disap-
pears and superconductivity occurs at low temperatures.
For 7−δ ≈ 6.75, a plateau at T
c
≈60 K is reached which
corresponds to a partial ordering of oxygen atoms. At
high temperatures or at high oxygen content the com-
pounds are paramagnetic.
Part 4 2.2
Superconductors 2.2 Non-Metallic Superconductors 731
0 100 200 300 400
Temperature (K)
Resistivity
a
(µΩ cm) Resistivity
c
(mΩ cm)
800
600
400
200
0
400
200
0
300
200
100
0
200
150
100
50
0
400
300
200
100
0
40
20
0
15
10
5
0
6
4
2
0
YBa
2
Cu
3
O
7–δ
ρ
ρ
a)
b)
c)
d)
6.68
6.78
6.88
6.93
Fig. 4.2-35a–d In-plane (ρ
a
) and out-of-plane (ρ
c
) resis-
tivity of YBa
2
Cu
3
O
7−δ
as a function of the temperature for
various oxygen contents [2.46]
Superconducting Properties
The intrinsic superconducting properties which are in-
dependent of the microstructure are the lower and the
upper critical field, H
c1
and H
c2
, respectively and the
superconducting transition temperature T
c
. These su-
perconducting properties depend on the composition,
especially the oxygen content (Table 4.2-23). Further
0 50 100 150
T (K)
12.5
10.0
7.0
5.0
2.0
0.0
(W/m
–1
K
–1
)
κ
Fig. 4.2-36 Thermal conductivity of different YBa
2
Cu
3
O
7−δ
sam-
ples (♦ single crystals, others: polycrystalline samples) according
to [2.47]
67
7–δ
Temperature (K)
500
400
300
200
100
0
Tetragonal
PM
Orthorhombic
Insulator metal
PM
AFM
AFM
C
Superconductor
Fig. 4.2-37 Schematic phase diagram for YBCO
(YBa
2
Cu
3
O
7−δ
) in dependence of the oxygen content
7−δ [2.48]
parameters such as the effective coherence length ξ,the
magnetic penetration depth λ, and the Ginzburg–Landau
parameter that is dependent on the microstructure.
Part 4 2.2