McKinney J.D., Warnick C.C. Microhydropower Handbook Volume 1
Подождите немного. Документ загружается.

..-. ._.
..--.
EXAMPLE:
From the example above, A1 = 28 ft2;
assume that
A2
= 34.5 ft*
A=
28 ft2 + 34.5 ft2
2
A = 31.2 ft2
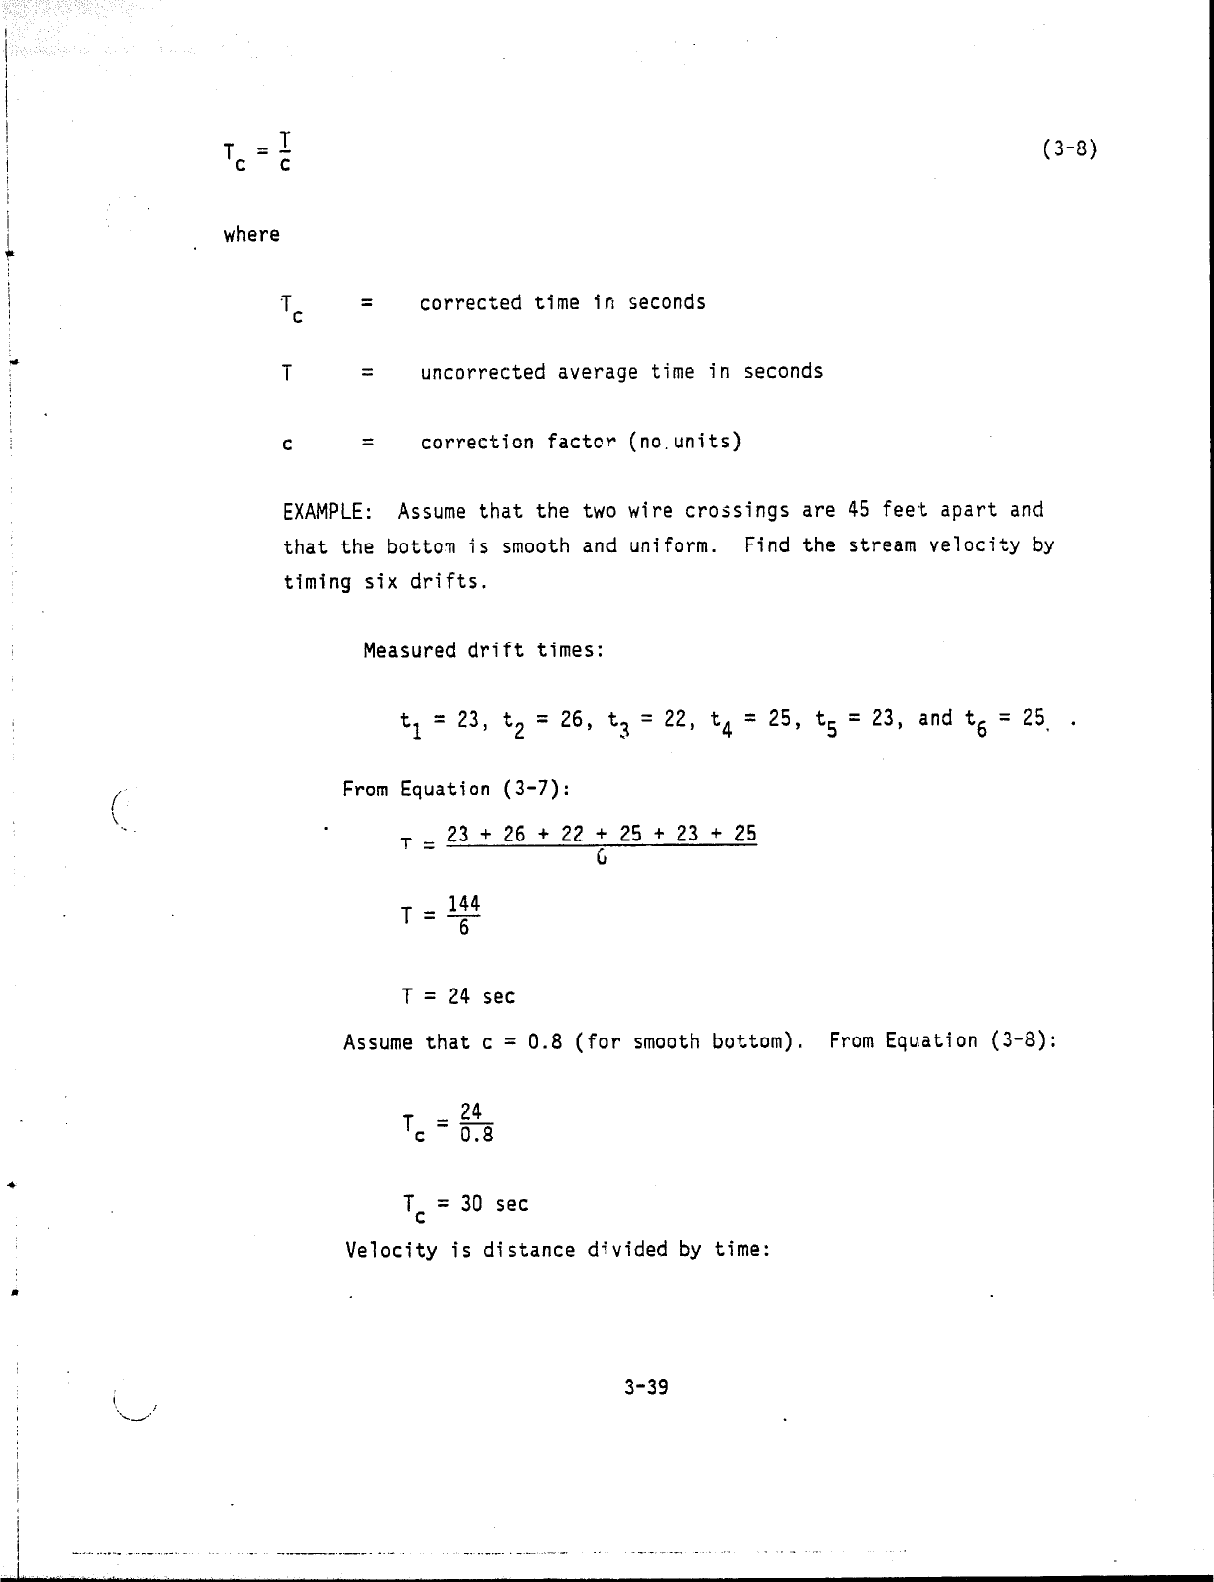
Next you must determine the velocity of the stream flow. Make a float
of light wood, or use a bottle that is weighted to ride like a piece of
wood (Figure 3-10). A small flag can be put on the float so that its
progress can be followed easily.
Yow set the float adrift upstream from
the fi-st wire.
Time its progress down the stream with a stopwatch,
beginning just when the float passes the first wire and st;;pping just as it
passes the second wire.
Repeat the measurement at least six times at
various locations across the stream to obtain an average time.
Perform
this measurement on a calm day since wind will cause errors in your
.
measurements.
T
=
t1 + t2 + t3 + . . . tn
n
where
T
=
average time in seconds
.
t
=
recorded time for each drift in seconds
n
=
number of drifts
(3-7)
Since the water does not flow as fast on the bottom as it does on th2
surface, you must apply a correction factor (c) to the average time.
For a
straight stream with a smooth bottom, use 0.8. For a stream with large
rocks on the bottom, use 0.6.
c
3-38
I
T T
=-
c c
(3-8)
(
. .
where
Tc =
corrected time in seconds
T
=
uncorrected average time in seconds
C
=
correction factcr (no.units)
EXAMPLE: Assume that the two wire crossings are 45 feet apart and
that the bottom is smooth and uniform.
Find the stream velocity by
timing six drifts.
Measured drift times:
9 = 23, t2 = 26, t? = 22, t4 = 25, t5 = 23, and
k
t6 = 25, .
From Equation (3-7):
T=
23 + 26 + 22 + 25 + 23 + 25
G
T = 24 set
Assume that c =
0.8 (for smooth bottom). From Equation (3-8):
T
24
C
=0.8
TC
= 30 set
Velocity is distance d'vided by time:
3-39
I
-. _ _. _ _ __ _ __ _ _
_~ -._--- _--_. ..-
___._._..._ - .--. -. -.-. --.
.
,
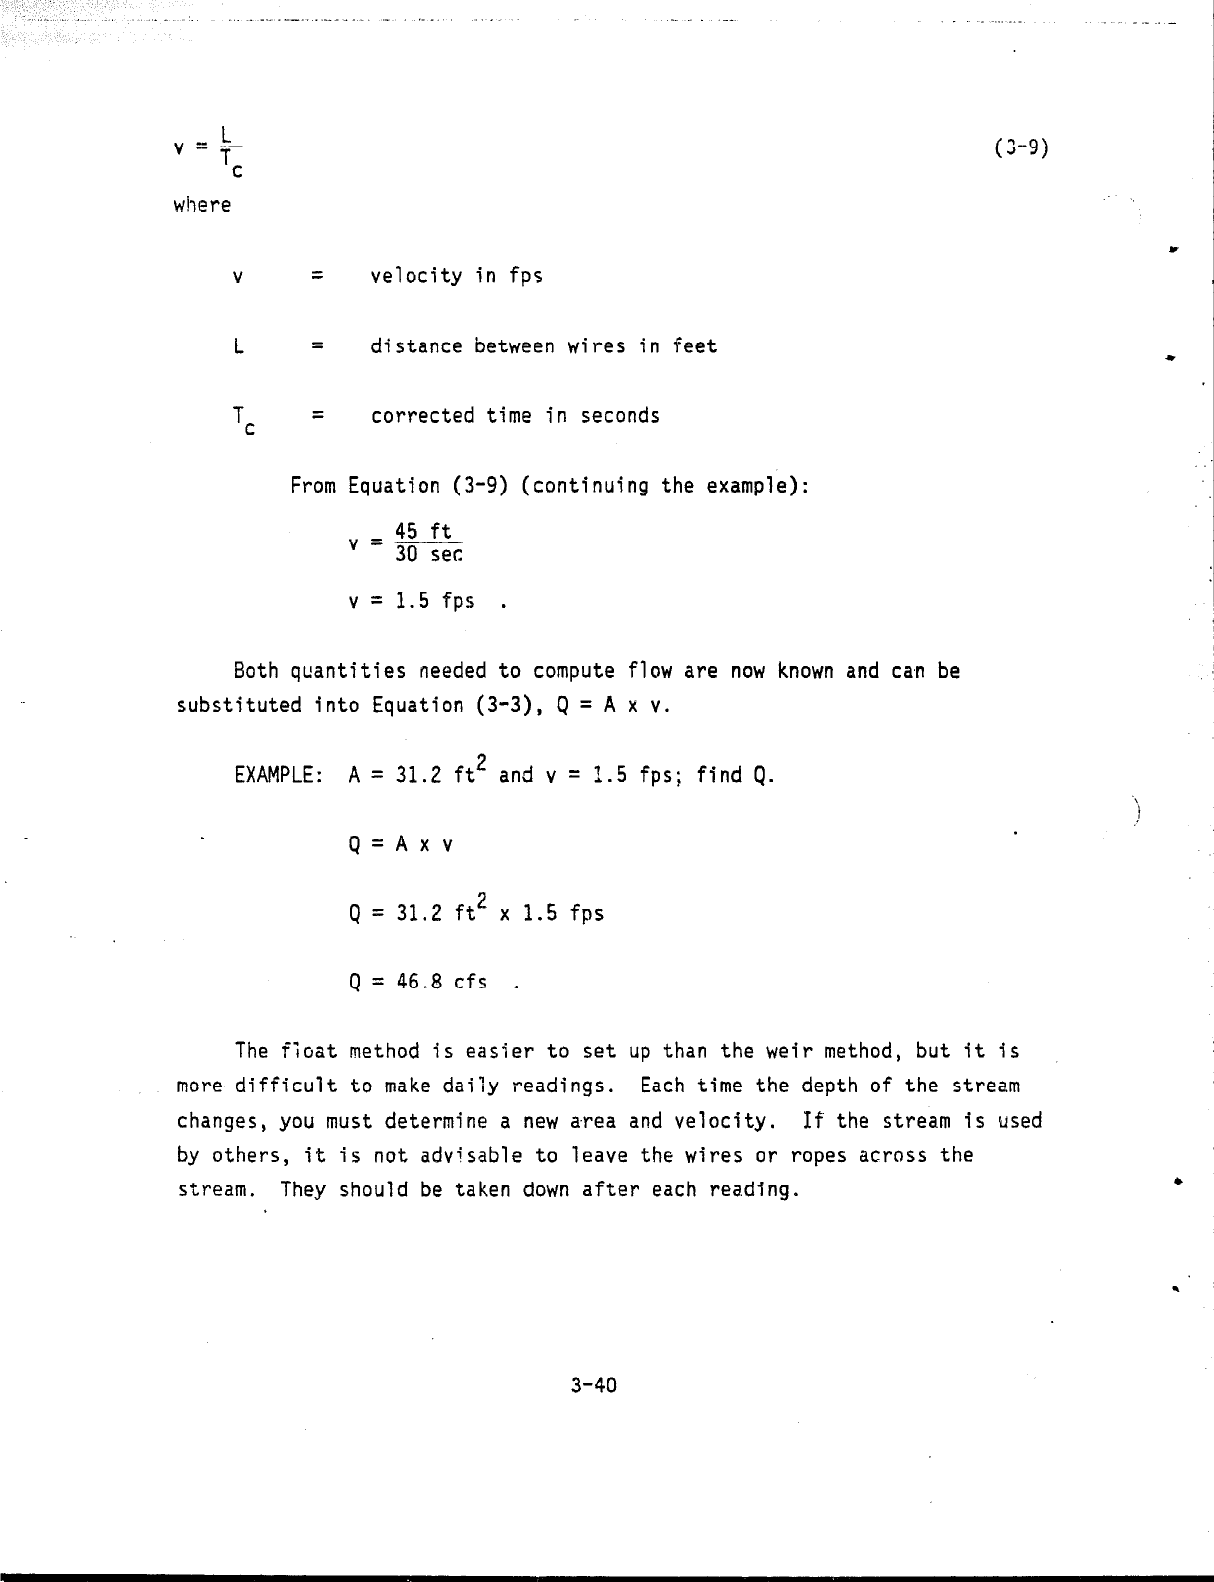
V
E-
i
where
(3-9)
V
=
velocity in fps
L
=
distance between wires in feet
Tc =
corrected time in seconds
From Equation (3-9) (continuing the example):
45 ft
' = 30 set
v = 1.5 fps .
Both quantities needed to compute flow are now known and ca,n be
substituted into Equation (3-3), Q = A x v.
EXAMPLE: A = 31.2 ft* and v = 1.5 fps; find Q.
Q=Axv
Q = 31.2 ft2 x 1.5 fps
Q = 46.8 cfs .
*
I
The fioat method is easier to set up than the weir method, but it is
more difficult to make daily readings.
Each time the depth of the stream
changes, you must determine a new area and velocity.
Xf the stream is used
by others, it is not advjsable to leave the wires or ropes across the
stream.
They should be taken down after each reading.
l
4
3-40
t
l
c
c.-. :
One suggestion that might simplify repeat measurements is to place a
yardstick on a post and drive the post into the stream bed so that the
yardstick can be read.
Each time the measurements are made and the flow
determined, record the depth on the yardstick. Then every time that depth
appears on the yardstick,
the flow is the same as previously determined,
and since different flows are needed for ccrrelation, another day should be
selected tc make further measurements.
In summary,
select the best measurement method for the stlzam, locate
the measurement station near the proposed location for the intake
structure, and begin taking measurements.
3.3.3.2 Flow Computations.
You should now have several days of flow
measurement recorded.
The next step is to determine from'the gage
previously identified as closest to your site the flow readings for the
days on which your flow measurements were made. Record the gage readings
in the appropriate column (Q2) of the flow table (Figure 3-5), and
compute the correlation by dividing the gage reading into the measured.flow.
Ql
c=s
where
.
(3-10)
C
=
correlation number
Q,
=
measured daiiy flow in cfs
Q2 =
gage daily flow in cfs
If a good flow pattern relation exists between the site and the gage, the
correlation value will be approximately the same for each day of
measurement.
EXAMPLE: Assume that four measurements were made at the site and the
flow was computed.
Also assume that the gage readings have been
received and recorded.
3-41
I
--- .____~ _ _

Computed Flow, Q,
Gauge Flow, Q,
Correlation
(cfs) (cfs)
Ql'QZ
. .
26.7
50.3
0.53
'b
30.3
59.6
0.51
33.7
68.9
0.49
*
31.2
65.3
0.48
The variation in the correlation ranges from 0.53 to 0.48, or
0.05 variation. Since the variation is sma?l, the correlation is
good.
If the variation becomes greater than 0.15, the correlation between
the site and the gage may not be sufficient to use the gage exceedance
value to project stream flow at the site.
A developer who cannot obtain a
good correlation should use the procedure given in Appendix A-4, "Stream
Flow Projections Where a Gage Correlation Does Not Exist."
‘\
. 3.3.3.3 Exceedante Value i'low Duration Curve. An example of a flow
duration curve was presented In Figure 3-4. The curve was plotted from
exceedance values obtainzd from the A9-69 printout (Table 3-3).
The
printout !ists flow values for seven exceedance percentages (95, 96, 75,
70, 50, 25, and 10%). The 95% flow value means that that flow will be met
or exceeded 95% of the time. The 70% flow will be met or exceeded 70% of
the time, etc. If other than USGS exceedance values are used, the seven
exceedance percentages may be different, but they can be used to develop a
flow duration curve as easily as the'USGS values.
The iiext step is to construct the flow duration curve. Figure 3-13
shows a reduced copy of standard 8-l/2 x 11 inch graph paper with 20 grid
markings per inch.
Paper with 10 divisions per inch could just as easily
3-42
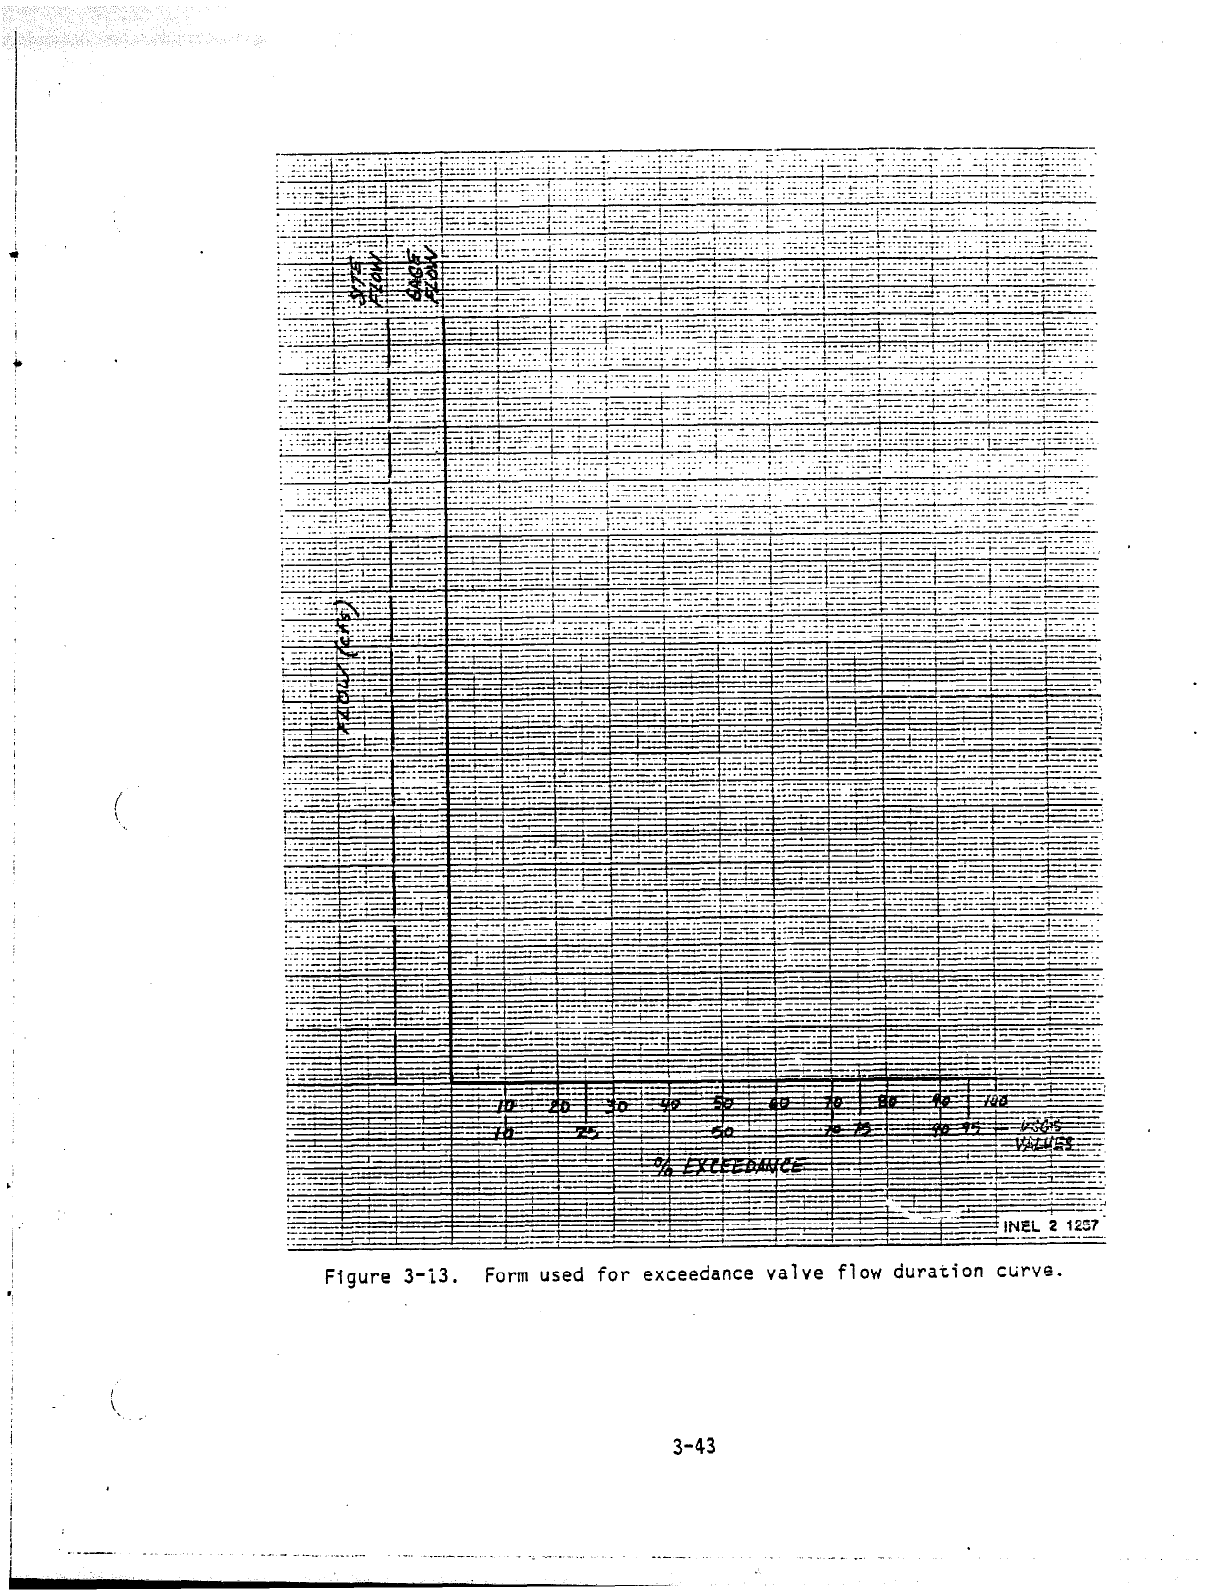
Figure 3-i3.
Form used for exceedance valve flow duration ctirve.
3-43
. --.
_
.-.-...__ .__.....
--..- . . . -- .
_.._..._.
.~ _.-._
!
_- _, ,__
,. .- -~- --~ --
be used. The paper can be obtained at most office supply stores. Two
coordinates are shown on the figure.
The vertical coordinate is for the
flow scales, and the horizontal is for the exceedance percentage. The
seven USGS exceedance values are indicated below the horizontal axis.
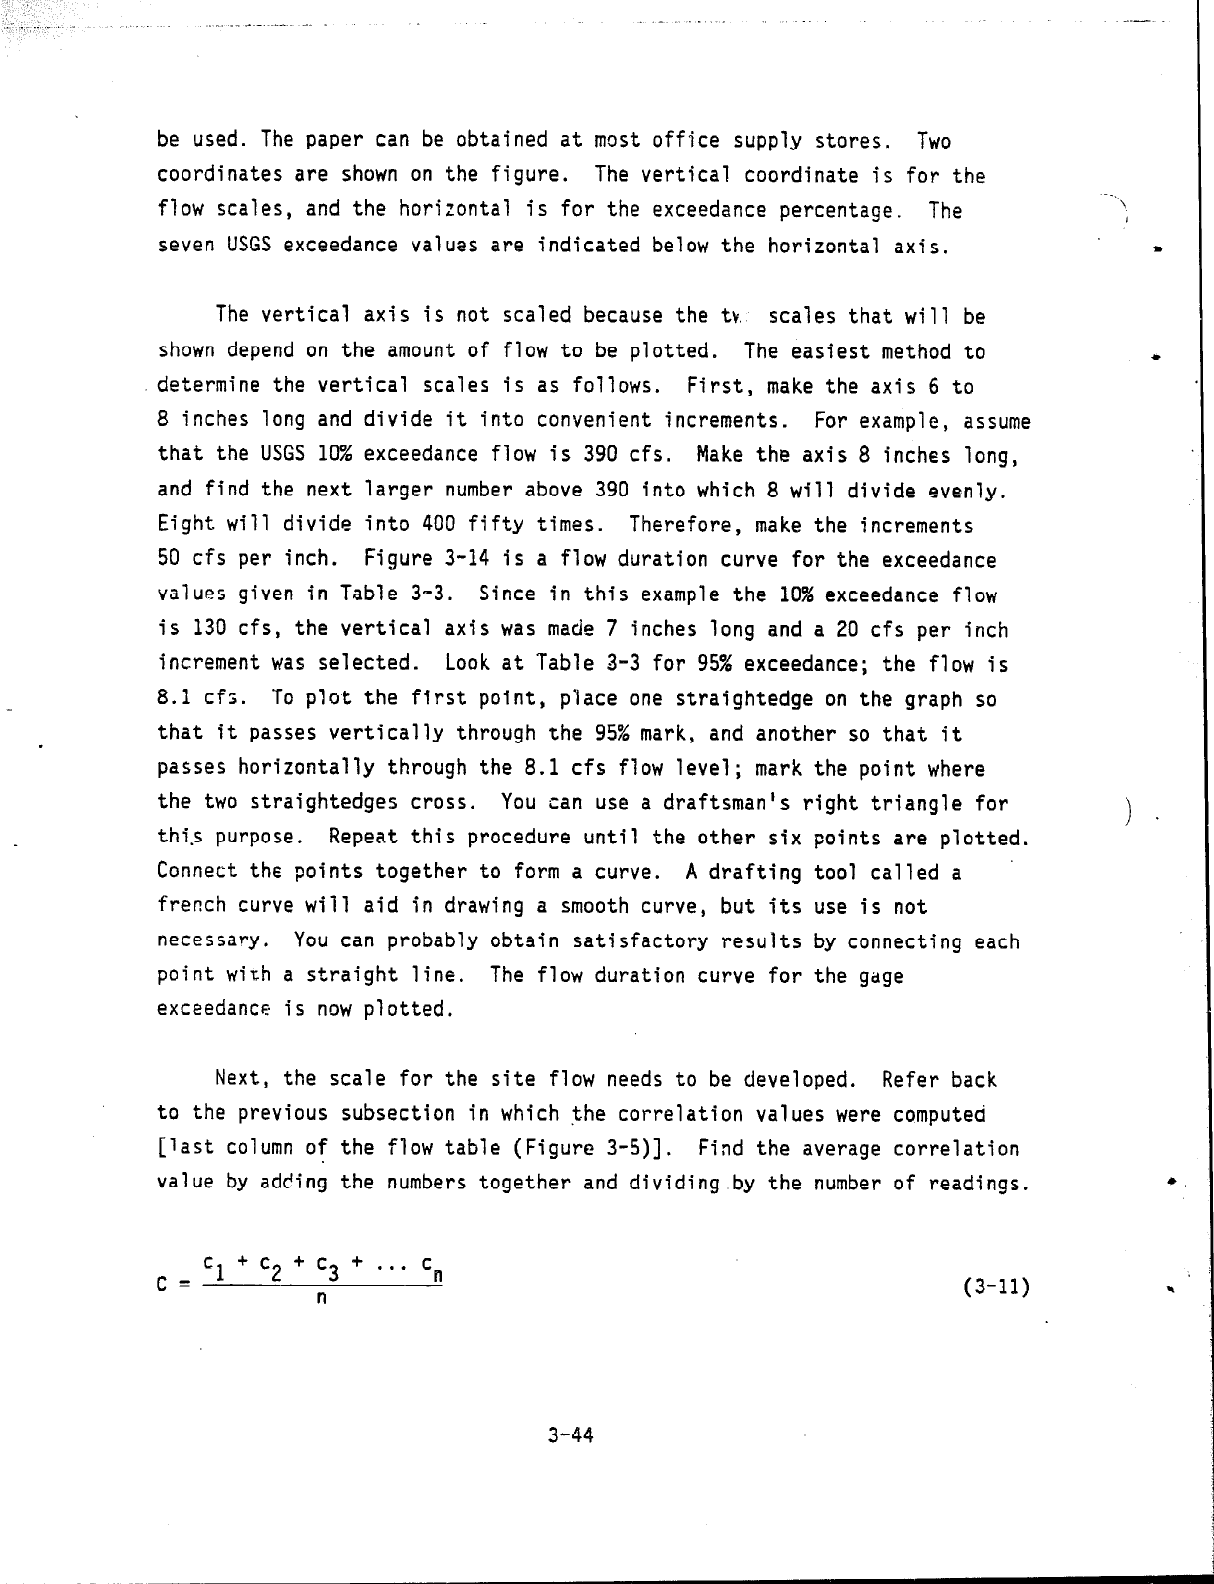
The vertical axis is not scaled because the tt. scales that will be
shown depend on the amount of flow to be plotted. The easiest method to
determine the vertical scales is as follows. First, make the axis 6 to
8 inches long and divide it into convenient increments. For example, assume
that the USGS 10% exceedance flow is 390 cfs. Wake the axis 8 inches long,
and find the next larger number above 390 into which 8 will divide evenly.
Eight will divide into 400 fifty times.
Therefore, make the increments
50 cfs per inch. Figure 3-14 is a flow duration curve for the exceedance
values given in Table 3-3.
Since in this example the 10% exceedance flow
is 130 cfs, the vertical axis was made 7 inches long and a 20 cfs per inch
increment was selected. Look at Table 3-3 for 95% exceedance; the flow is
8.1 cfs.
To plot the first point, place one straightedge on the graph so
that it passes vertically through the 95% mark, and another so that it
passes horizontally through the 8.1 cfs flow level; mark the point where
the two straightedges cross.
You can use a draftsman's right triangle for
thi.s purpose.
Repeat this procedure until the other six points are plotted.
Connect the points together to form a curve. A drafting tool called a
french curve will aid in drawing a smooth curve, but its use is not
necessary. You can probably obtain satisfactory results by connecting each
point with a straight line.
The flow duration curve for the gage
exceedance is now plotted.
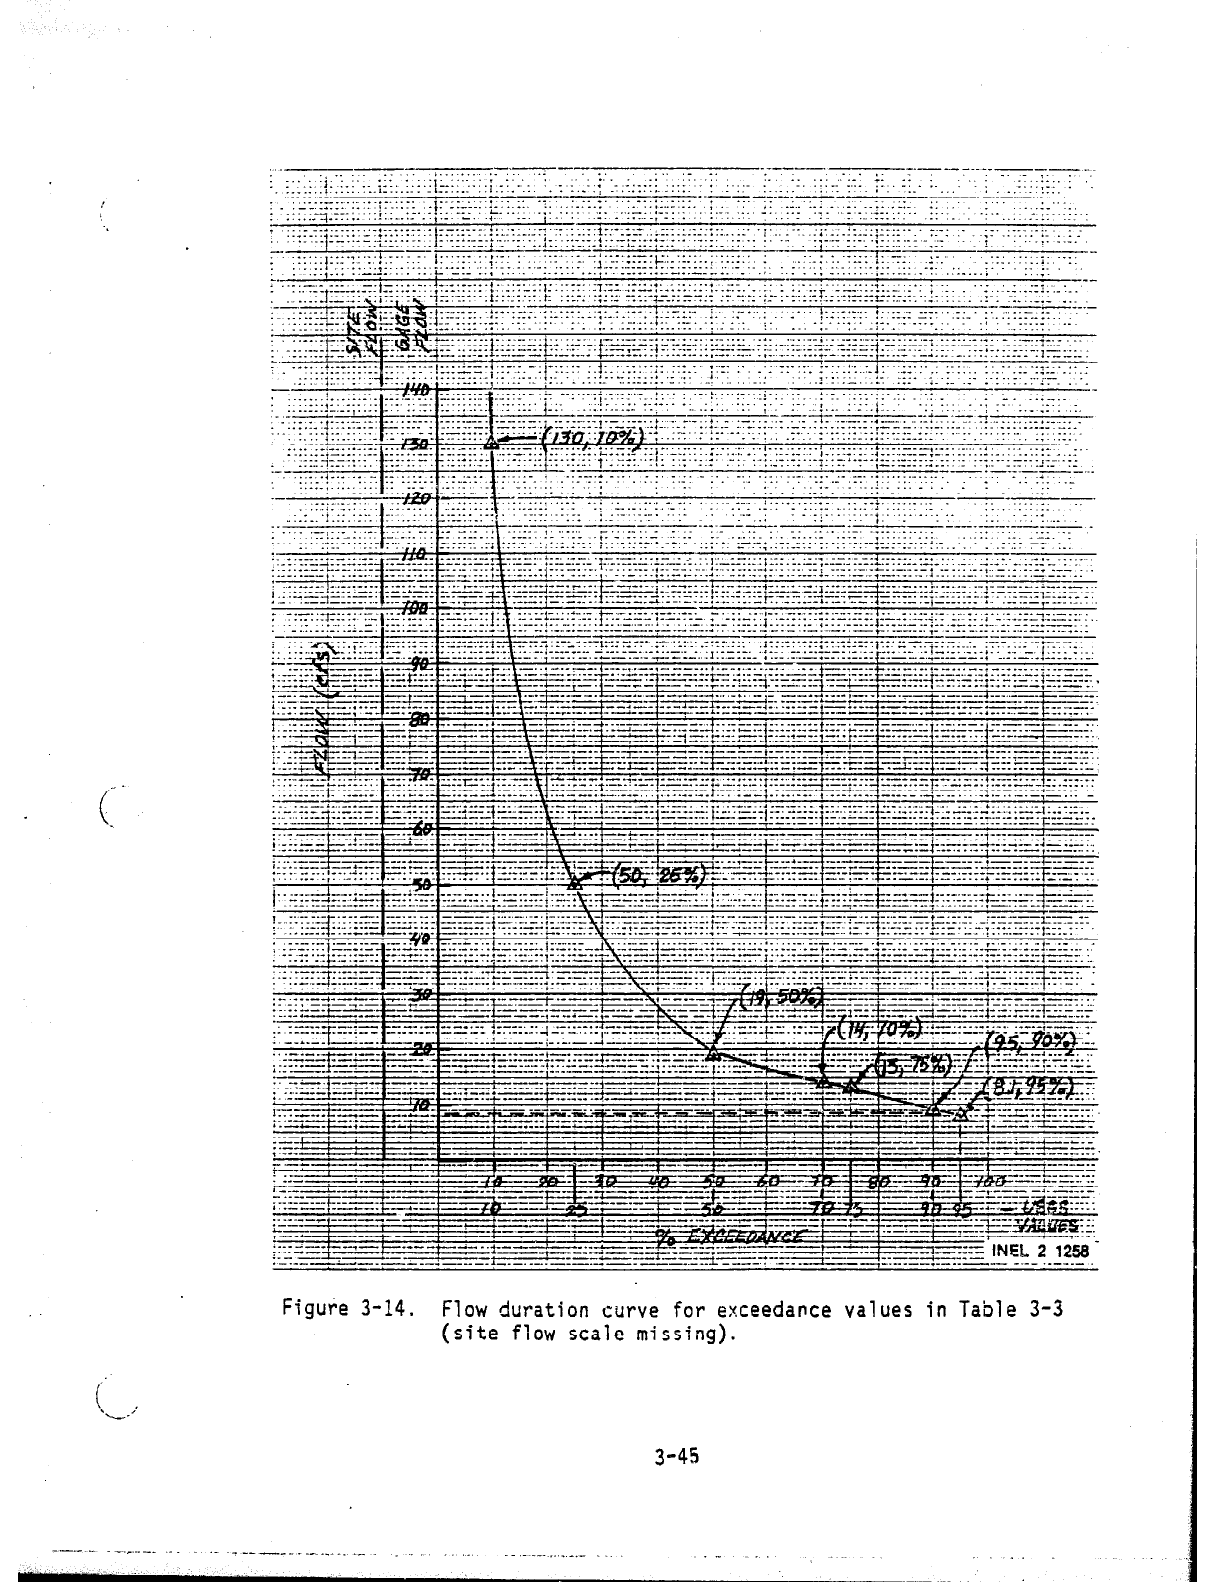
Next, the scale for the site flow needs to be developed. Refer back
to the previous subsection in which the correlation values were computed
[last column of the flow table (Figure 3-5)]. Find the average correlation
value by adding the numbers together and dividing by the number of readings.
C
=
Cl + c2 + c3 + . . . cn
n
(3-11)
3-44
:.. . .._-. .-.. . . .-.-. . ..__ i _._._... I._ . .._ -_.
_ _ _. . _ _ . . __ . _ _
----_ --
. _ . _ . .
_. . . .._..._ .i:::
.-.. ._-._. .*_..
Figure 3-14.
Flow duration curve for exceedance values in Table 3-3
(site flow scale missing).
3-45

.
_..~_
- ..- _ _. --._-.
where
C
=
average correlation
C
=
daily correlation value
n
=
total number of correlations
For the Mill Creek example (Table 3-3, Figure 3-14), assume the
following correlation values: CI = 0.70, c2 = 0.65, c3 = 0.72, and
c4
= 0.74.
From Equation (3-11):
C= 0.70
+ 0.65 + 0.72
+ 0.74 = -I
4
4
C = 0.70
To find the site flow scale, multiply the gage scale by C. Thus,
10 cfs gage x 0.70 = 7 cfs site, 20 cfs gage x 0.70 = 14 cfs site, etc.
Figure 3-15 shows the flow duration curve with the completed site flow
scale:
From the site flow scale, the minimum stream flow is around
5.7 cfs, and the 25% exceedance is 35.1 cfs.
Take another set of flow measurements a month or two after the first
and check for correlation again.
If the average correlation value is close
to the first value, then the correlation is good and the curve
(Figure 3-15) can be used for design. If the average correlation is not
reasonably close (more than 0.15 difference), refer to Appendix A-4,
"Stream Flow Projections Where a Gage Correlation Does Not Exist."
i
4
.
3-46
___-.- _-
__. .--
-_- -...-___ ----..
_. --
--- --
, _. . .
:iI.c.I:r./:i ..,... 1:. i. i :t k
: :. .:,ir.‘:‘~ --....- y..
-.::
. . . . ..i __ :;
. . :__ .;. . :.
_. _: _ . . . . .: ::::: 1.
:: --.” . . . . . . :: ..-..
: -_.: ~~.711~ . ..-. :-..-.
~.--.~---~~‘-‘.-.‘.:
~-_____--.1__.~.____-1___.
. .. .
. . . . ;:..:~::. ,..;.:.
. . 1.
I
‘..‘~ i
: :::r:r-i:-::::-.:,-. _. .:1 _. .,_ : :: .:
i
. .1-.,.:-z ‘I . - .: .’ ‘-
: :..f .,_. i:: j...Y& :j .+::,-
7 ..,.._._. ._ . . . . . . __._.. _._._..._. . . --.. 1.-r
. -.. .--- ,..... -
./” ..
: . . . _--
_ . . .
(___.____._._.. .: ._.. _ . . . . . :yl,.IcII.
1. . . . . IT...
._._._, _ .
. .._
+--A-- -2;-
_.. . . . . . :.:._. I”. c
: .fi]ZZ ‘f;r-:.-
‘...
_
_-.- _____ -
--
.-_1--1-. .~
. .._ -.L---_-_-_- -I----+--- -,--- -_-.---------.--- ^.
._,.. -._---_I .__.-.--__ - __.. i -___ _ ._.. - . . . ..__..
.__,__ _ ,_-_. ._______..__ ~zr;‘;~~ INEL 2 1259
..____, _..-._----- .._.._ - . .._ . . ..__. . ..-. ..______. -.I..
..___. _.__ . ..____
Figure 3-15.
Flow duration curve with completed site flow scale.
i
Le..'