McKinney J.D., Warnick C.C. Microhydropower Handbook Volume 1
Подождите немного. Документ загружается.

If your electric meter does not measure demand, you can determine your
maximum demand by reading the meter hourly.
This method is not as accurate
as using a demand meter,
but it is good enough for estimating purposes. If
electric motors are used, add the starting demand to the hourly reading.
.
Another method of determining maximum demand is to measure electrical
use with a recording ammeter.
This is a device that can plot amperage used
versus time.
If you use a recording ammeter, you should monitor each
current-carrying conductor on equal time.
This will allow an accurate mea-
surement of the maximum current since each current-carrying conductor is
not loaded equally.
The power use in watts can then be determined from
Equation (A6-5) for single-phase power or from Equation (A6-7) for three-
phase power (see Appendix A-6).
P
= E x I (single-phase) (A6-5)
P
= 1.73 x E x I (three-phase)
(A6-7)
3.2 Inspection of Potential Hydropower Development
. Next, you should conduct a site inspection. Although most will be
familiar with site details, an inspection done with a few key points in
mind may bring to light important issues previously overlooked.
You should
review the following outline and make notes on important issues. Also,
before making the site inspection,
review Subsection 2.6, Microhydropower
Sources.
Identify the type of source that most closely resembles the source
for your site. Study the appropriate figure(s) and become familiar with
the major components of your microhydropower system. Then, with these items
in mind, conduct the inspection.
After making the inspection, sketch the
preliminary layout on a sheet of graph paper.
3.2.1 Manmade Sites
While the construction of a new dam for the sole purpose of developing
a microhydropower site is not generally practical economically, there are
.
literally thousands of existing dams,
built for a variety of purposes, that
may be attractive to the daveloper.
The water level is often strictly
3-8
.
0
‘q
When rev
iewing the use of an existing dam, the following items should
*
be considered
0
Dam structure
What is the state of repair?
How much work and material will be required to make the
structure functional?
.
controlled, so that a hydropower project at the site could use only the net
inflow into the reservoir. These factors and their effect on your project
should be determined early on.
Some dams may be usable for only part of
the year, which would also seriously affecting a project's economics.
The reservoir of many older dams will be partially filled with silt.
Any impoundment with silting behind the dam will obviously have less reser-
voir capacity.
The silt level may be a key factor in the dam's structural
stability.
Equilibrum of the dam,
water, and silt may have been changing
over the years.
To remove the silt might upset the balance and cause a dam
failure. Removing the silt also presents environmental problems
because dredging will increase the silt load of the stream, and if the silt
is removed and trucked away, disposal may present a further problem.
Silt
removal can be an expensive way to increase reserve capacity.
Does the dam have a spillway, and is it adequate?
How can the water be direc,ted to the turbine?
Is the powerhouse part of the existing structure? If so,
how much work is needed to repair it?
Can the height of the structure be increased easily? If so,
what will be the effect upstream?
3-9
I
.- --.. ..-_... - -.
__

0
Reservoir pool
What is the depth of the pool at the structure?
How much annual variation occurs in the pool? Will the
variations change if you install a turbine that discharges
water at a uniform rate?
How much.debris is carried by the water, both on the surface
and suspended in the water?
Will the debris clog an intake
trashrack easily?
0
Construction features
Is the site easily reached for construction?
Will you have to divert the water? If so, what will be
involved?
.
Are there any hazards near the construction
site' (overhanging
power lines, etc.)?
3.2.2 Run-of-the-Stream Sites
lhe following items should be cons
stream site.
idered when evaluating a run-of-thi.-
m Identify one or two powerhouse locations (most power'itbI.;cJ ilk
located near the stream that supplies them with water).
How far will the power be transmitted?
Can you identify a high water mark?
Can a vehicle get to the site?
3-10

d
.
a
Would there be any advantage to locating the powerhouse near the
place where the power will be used?
How much shorter would the transmission distance be?
Could the penstock be shorter?
Could a tailrace be constructed easily to carry the water
away from the powerhouse?
0
Investigate potential penstock routing (the ideal penstock routing
would be as short as possible, as straight as possible, and as
steep as possible while still delivering the required flow and
head).
Will the water rights,
soil permeability, etc. allow the use
of a power canal to shorten the penstock?
If the canal is a possibility, look uphill from the power-
house location, identify the steepest slope to which a power
canal can be run, and find several appropriate points on
that slope for such a canal.
If a power canal cannot be built, locate the penstock intake
near the stream.
Walk uphill from the powerhouse, identifying several areas
that could be used for a forebay.
From these locations, what is the straightest or the shortest
routing for the penstock?
a
Walking along the proposed penstock routing, determine if there
are logical areas where a forebay and penstock intake structure
can be built.
3-11
;,’ . ‘. ; 1’
Can equipment be driven to the site (backhoe, cement mixer,
or ready-mix truck, etc.)?
How deep can the forebay be?
If a power canal is used, can the canal be run
the stream to the forebay?
leve
If the canal is more than l/2 mile long, can a sett
be built near the stream?
from
ing
basin
0
Consider placement of diversion works.
Can the diversion works be set at right angles to the stream?
Can a backhoe be used in the area?
Who owns the property?
3.3 Determining Available Flow
Available flow is the flow that can be used in a microhydropower system
I
to generate electricity.
The flow available to generate electricity variec
as the stream flow varies.
In
the spring, most streams are at their highest
level,
and more flow is available to generate electricity; in late s.ummL:.~,
on the other hand, most streams are at their lowest level, and i:'r.s fib,\ 'I-
available to generate electricity.
Category 1 developers, WI-N rc~~~ i *‘i' / c Yr ::
at a constant level year round,
should design their systems for the ~II~II I14!'~~ii
available flow of late summer.
They.do not need the additional power th;i+.
could be produced in the spring because of the larger flow avail?t:le. I.;
egory 2 developers,
however, who are interested in producing thz most c.::
for
the
dollar invested, will use the larger flow available 1;1 L::Y sg:.j
3.3.1 Flow Duration Curve
i
To determine available flow, engineers use statistical ;.L ;.I..': :. .i
ject
fclt,Jre stream activity from past stream flow
records. !‘r,, <..,:: -,.I
3-12
I
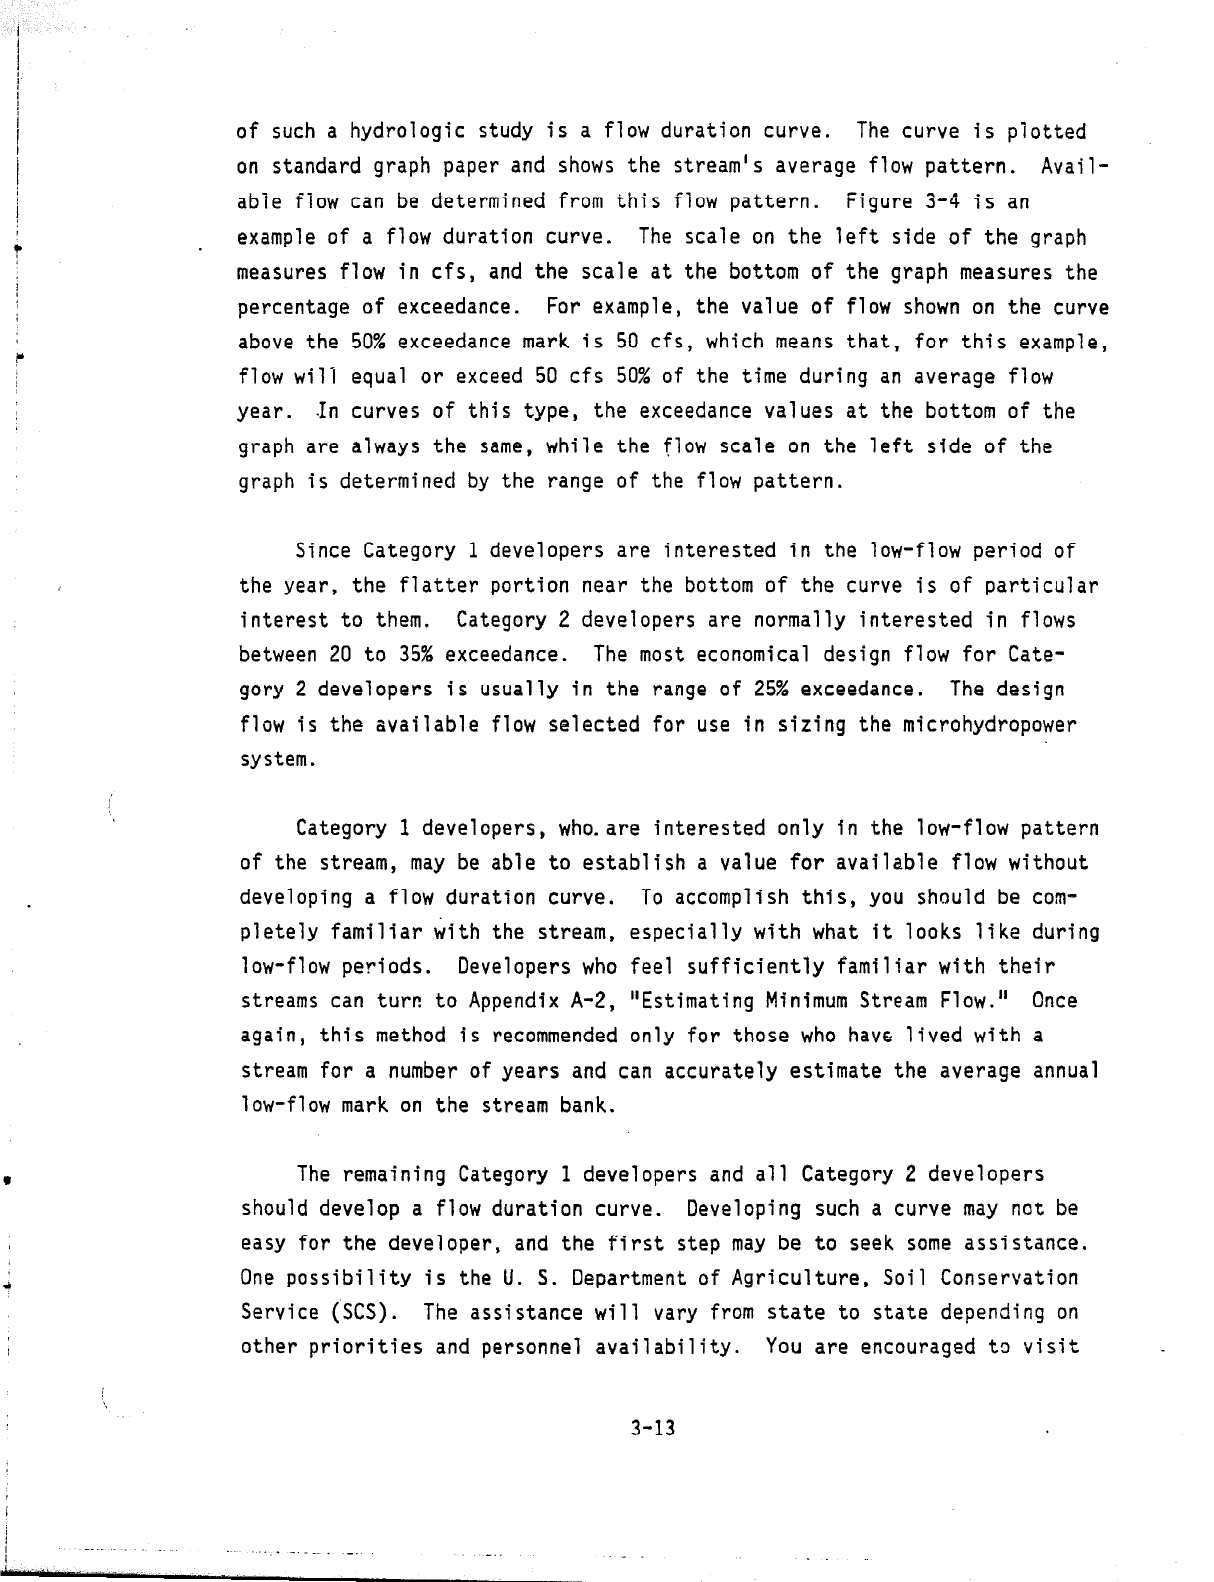
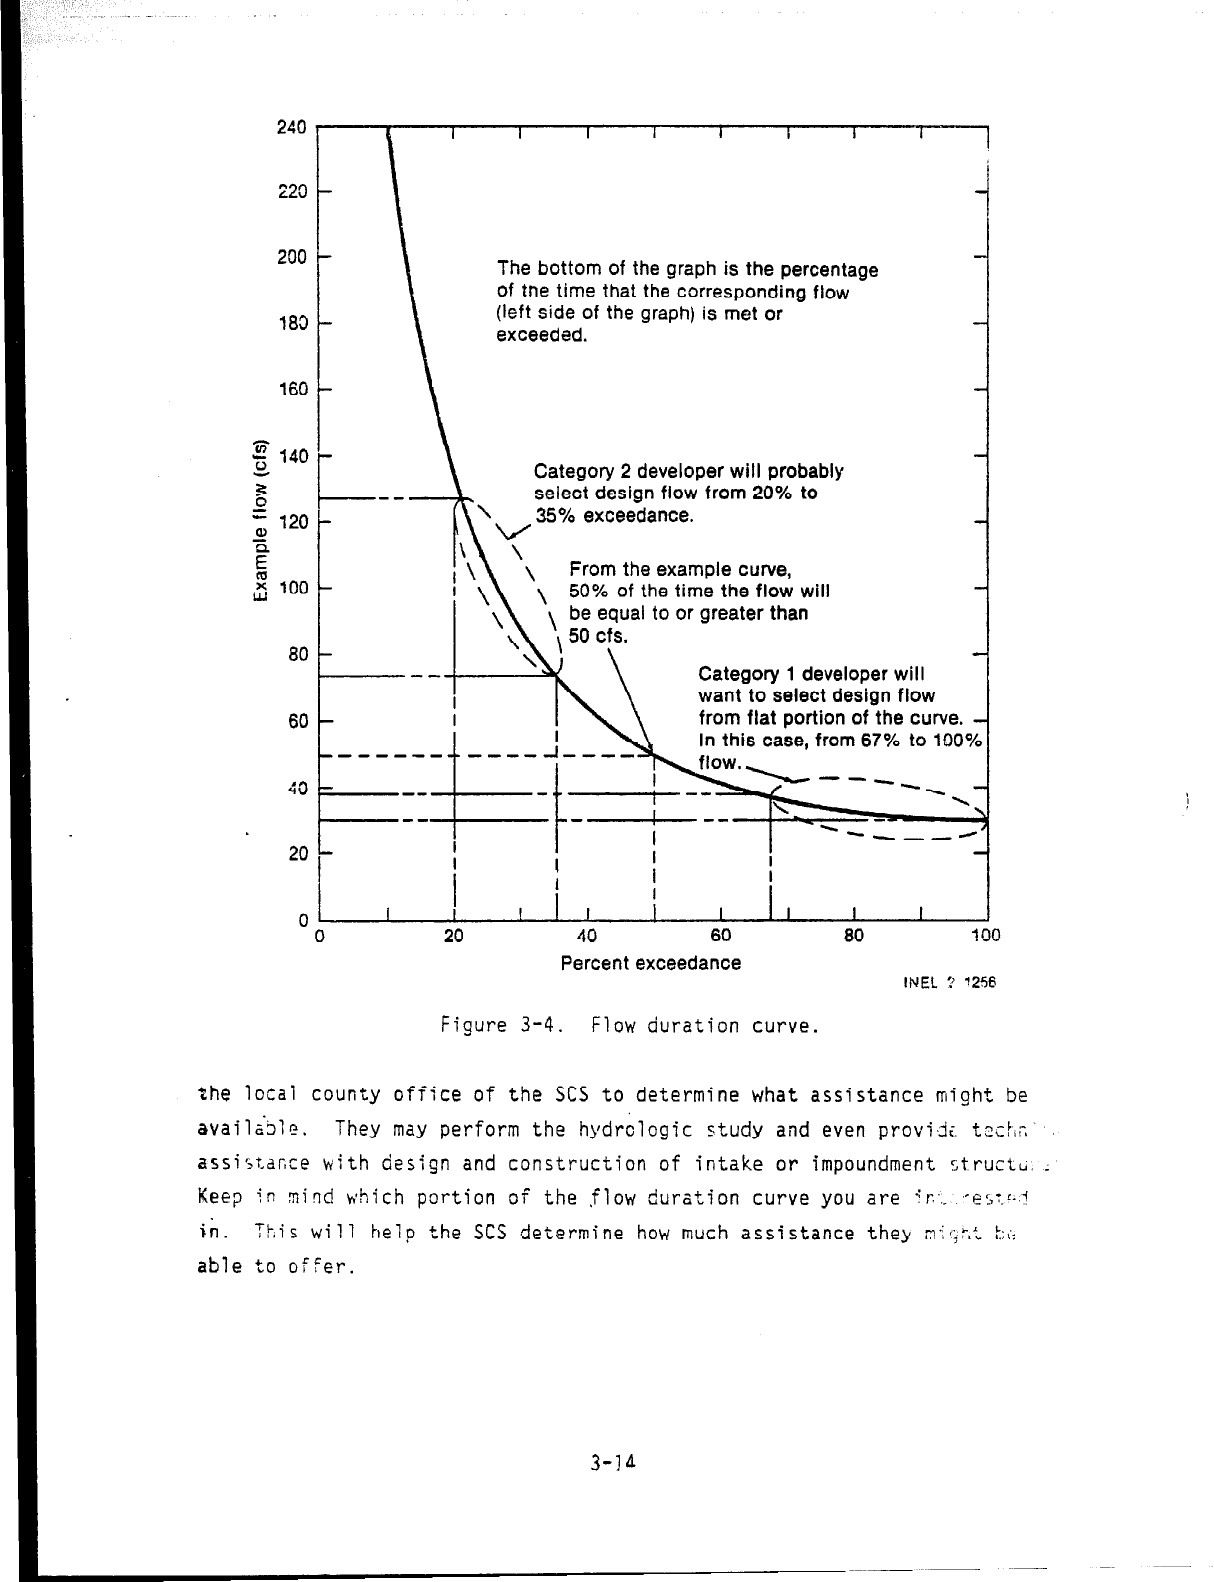
of such a hydrologic study is a flow duration curve. The curve is plotted
on standard graph paper and shows the stream's average flow pattern.
Avail-
able flow can be determined from this fiow pattern. Figure 3-4 is an
example of a flow duration curve. The scale on the left side of the graph
measures flow in cfs, and the scale at the bottom of the graph measures the
percentage of exceedance. For example, the value of flow shown on the curve
above the 50% exceedance mark is 50 cfs, which means that, for this example,
flow
will
equal or exceed 50 cfs 50% of the time during an average flow
year. .In curves of this type, the exceedance values at the bottom of the
graph are always the same,
while the flow scale on the left side of the
graph is determined by the range of the flow pattern.
Since Category 1 developers are interested in the low-flow period of
the year, the flatter portion near the bottom of the curve is of particular
interest to them.
Category 2 developers are normally interested in flows
between 20 to 35% exceedance. The most economical design flow for Cate-
gory 2 developers is usually in the range of 25% exceedance. The design
flow is the available flow selected for use in sizing the microhydropower
system.
Category 1 developers, who-are interested only in the low-flow pattern
of the stream, may be able to establish a value for available flow without
developing a flow duration curve.
To accomplish this, you should be com-
pletely familiar with the stream, especially with what it looks like during
low-flow periods.
Developers who feel sufficiently familiar with their
streams can turn to Appendix A-2, "Estimating Minimum Stream Flow." Once
again, this method is recommended only for those who have lived with a
stream for a number of years and can accurately estimate the average annual
low-flow mark on the stream bank.
l
The remaining Category 1 developers and all Category 2 developers
should develop a flow duration curve. Developing such a curve may not be
easy for the developer, and the first step may be to seek some assistance.
One possibility is the U. S. Department of Agriculture, Soil Conservation
Service (SCS).
The assistance will vary from state to state depending on
other priorities and personnel availability. You are encouraged to visit
3-13
I
_. .
I
_..
i ,^..*/, ,~_~-
240
\
I I
I
I I
I
I I
220
200
183
160
80
60
40
20
0
------- -----l----
L-_
f’ow*\u--.--
---
Cl -3=-
- --&_
_-__ L <--
-\
I
----
-
0
The bottom of the graph is the percentage
of tne time that the corresponding flow
(left side of the graph) is met or
exceeded.
Category 2 developer will probably
select design flow from 20% to
36% exceedance.
From the example curve,
50% of the time the flow will
o or greater than
Category 1 developer will
want to select design flow
from flat portion of the curve.
In this case, from 67% to 100’
I i
I
I I
I
I
I I
20 40 60
Percent exceedance
80 100
INEC ? ?256
Figure 3-4.
Flow duration curve.
the local county office of the SCS to determine what assistance might be
avail05le.
They may perform the hydrologic study and even provi,& tz;f,r,...
assi;ta&ce with design and construction of intake or impoundment structb. ;
Keep ;n
Rind which portion of the flow duration curve you are !r.:. ,-e:rc-.!
in.
?-,is will help the SCS determine how much assistance they n.if;:,t kc:
able to offer.
3-Id
I
I
I
,
!
i
3.3.2 Existing Stream Flow Records
I
I
c.
If you are not able to obtain assistance and have to develop the flow
duration curve yourself, you will have to collect additional information.
First, you should gather information about the existing stream flow records
in the area of the site.
The initial step is to contact the U.S. Geological
Survey (USGS).
To locate the nearest USGS office, look in the white pages
under U.S. Department of the Interior,
Geological Survey, Water Resources
Division, or write the appropriate regional office:
i
.
/
‘L..
Northeastern Region
Central Region
USGS
National Center, Mail Stop #433
12201 Sunrise Valley Dr.
Reston, VA 22092
USGS
Field Center Location
Mail Stop #406, Box #25046
Denver Federal Center
Lakewood, CO 80225
L
Southeastern Region Western Region
USGS
Richard B. Russell Federal Bldg.
75 Spring St., S.W., Suite 772
Atlanta, GA 30303
USGS
Field Center Location
.
345 Middlefield Road
Mail Stop #66
Menlo Park, CA 94025
Present the USGS with the following information:
Section number, township, range, county, and state of the
proposed site.
The name of the stream on which the site will be located, and a
reference to some easily identified landmark.
Give the distance
and direction from the landmark to the site,
The name of any streams that feed into your stream above the
proposed site.
The name of the stream that your stream drains into, and the
distance from the proposed site.
3-15
*!._-..- .,
_ __ ._. _ .--_
When you contadt the USGS, request a
"NAWDEX" for the county in which
the site is located,and the surrounding counties, and the "dur.sL,bn ;.,oiti
from A9-69
prosram
' for the gage that will most closely correlate to the
flow at your site. Important:
The gage must be active (currently operat-
ing) and have daily flow readings year round.
There may be a minfmum charge
for the printouts.
The NAWDEX, or National Water Data Exchange, is a list-
i'ig of all federal and state and some private stream gages placed in the
counties in question.
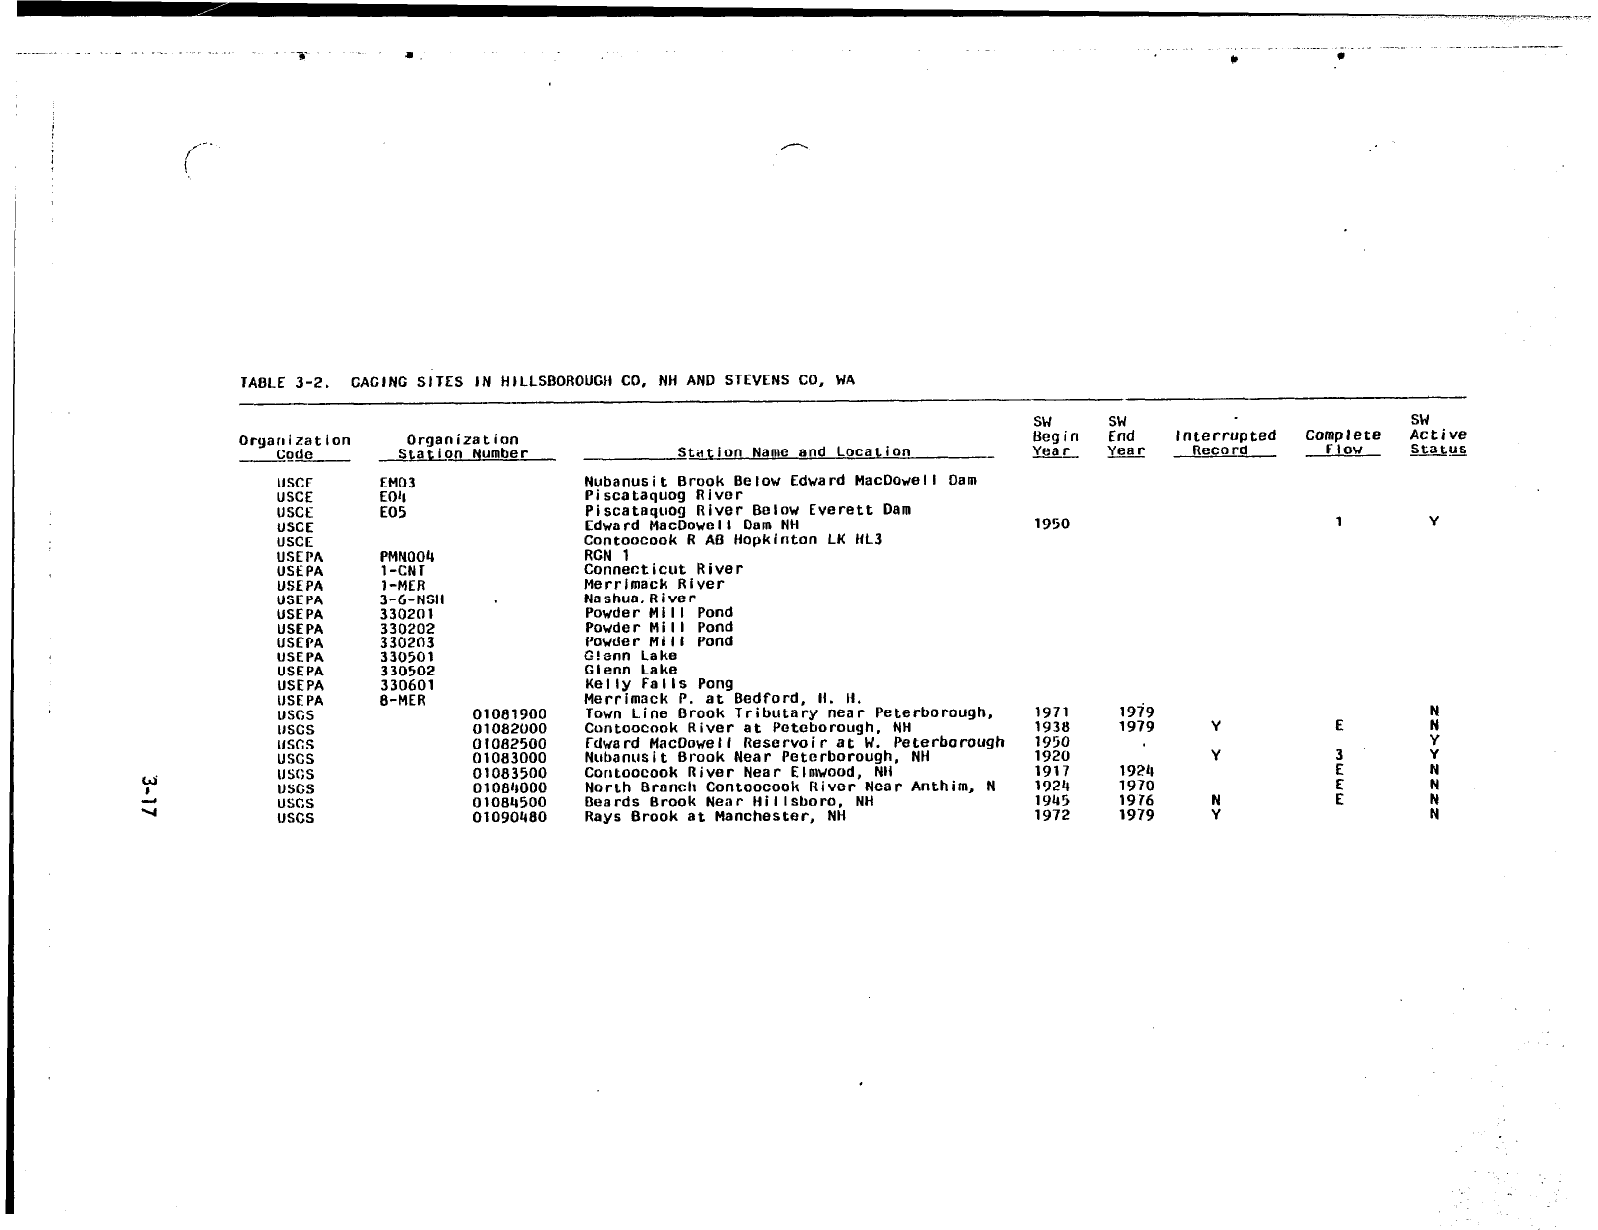
Table 3-2 is a reduced copy of a NAWDEX printout for
Hillsborough County, E;ew Hampshire and for Stevens County, Washington. The
NAWDEX printout lists the following:
0
The agency that placed the gage
a
The station number
0
The station name and location
0
When the gage started and stopped recording
0
Whether the data is interrupted (rather than continuous)
Y
= yes
n = no
0
The measurement (complete flow)
1
= daily year round
2
= daily seasonal
3 = monthly year round
4
= monthly seasonal
.
E
= activity eliminated
3-16
-
TABLE 3-2.
CAGING SITES IN HILLSBOROUGH CO, NH AND STEVENS CO, WA
Organization
Organization
COdl2
Station Number
Station Name and Location
SW
SW
Begin
SLid
Interrupted
Complete
Active
w Year
Rem ro
FIOW
status
USCC
USCE
USCE
USCE
USCE
USEPA
USEPA
USEPA
USEPA
USE PA
USEPA
USEPA
USEPA
USEPA
USEPA
IJSE PA
USGS
USGS
USGS
USGS
II SGS
USGS
USGS
uses
EM03
EOJI
EO5
PMN004
I-CNT
1 -MEJ?
3-6-NSH
330201
330202
3302113
330501
3 30502
330601
8-MER
Nubanusit Brook Below Edward MacDowelI Dam
Piscataquog River
Piscataquog River Below Everett Dam
Edward MacDowol I Dam NH
Contoocook R A5 Hopkinton LK NL3
RGN 1
Connecticut River
Merrimack River
Nashua. River
Powder Ml I I Pond
Powder M i I I Pond
Powder Mi I I Pond
C!enn Lake
Glenn Lake
Kelly Falls Pong
1950
Merrimack P. at Bedford, Ii. Ii.
01081900
Town Line Drook Tributary near Peterborough, 1971
19is
01082lJOO
Contoocook River at Potcborough, NH
1938 1979
Y
01082500
Fdward MacDowelJ Reservoir at W. Peterborough
1950
01083000
Nubanusi t Brook Near Peterborough, NH
1920 Y
01083500
Contoocook River Near Elmwood, NH 1917
19211
0 1 OBLJOOO
North Branch Contoocook River Near Anthim, N
1724
1970
0 1084500
Beards Brook Near Hillsboro, NH
1945
1976
01090480
Rays Brook at Manchester, NH 1972
1979
!