Moss L.T., Atre S. Business intelligence roadmap: The complete project lifecycle for decision-support applications
Подождите немного. Документ загружается.

[ Team LiB ]
Multidimensional Analysis Factors
One of the distinguishing factors of multidimensional OLAP tools, as opposed to
conventional querying tools, is the way they present the information. Measures or
facts are usually presented in a multidimensional format, such as columns in a fact
table or cells in a cube. These columns and cells contain precalculated numeric data
about a functional subject area and are related to business objects (dimension
tables) associated with the subject area. For example, Sales Amount, Net Profit
Amount, Product Cost, and Monthly Account Fee are numeric data (facts)
precalculated by account, by purchase, by customer, and by geography, which are
the associated business objects (dimensions). In contrast, a conventional relational
table would be a flat matrix of rows and columns, containing numeric data about one
and only one business object (dimension). For example, Opening Account Balance,
Daily Account Balance, and Account Interest Rate are numeric data of only one
business object, namely account.
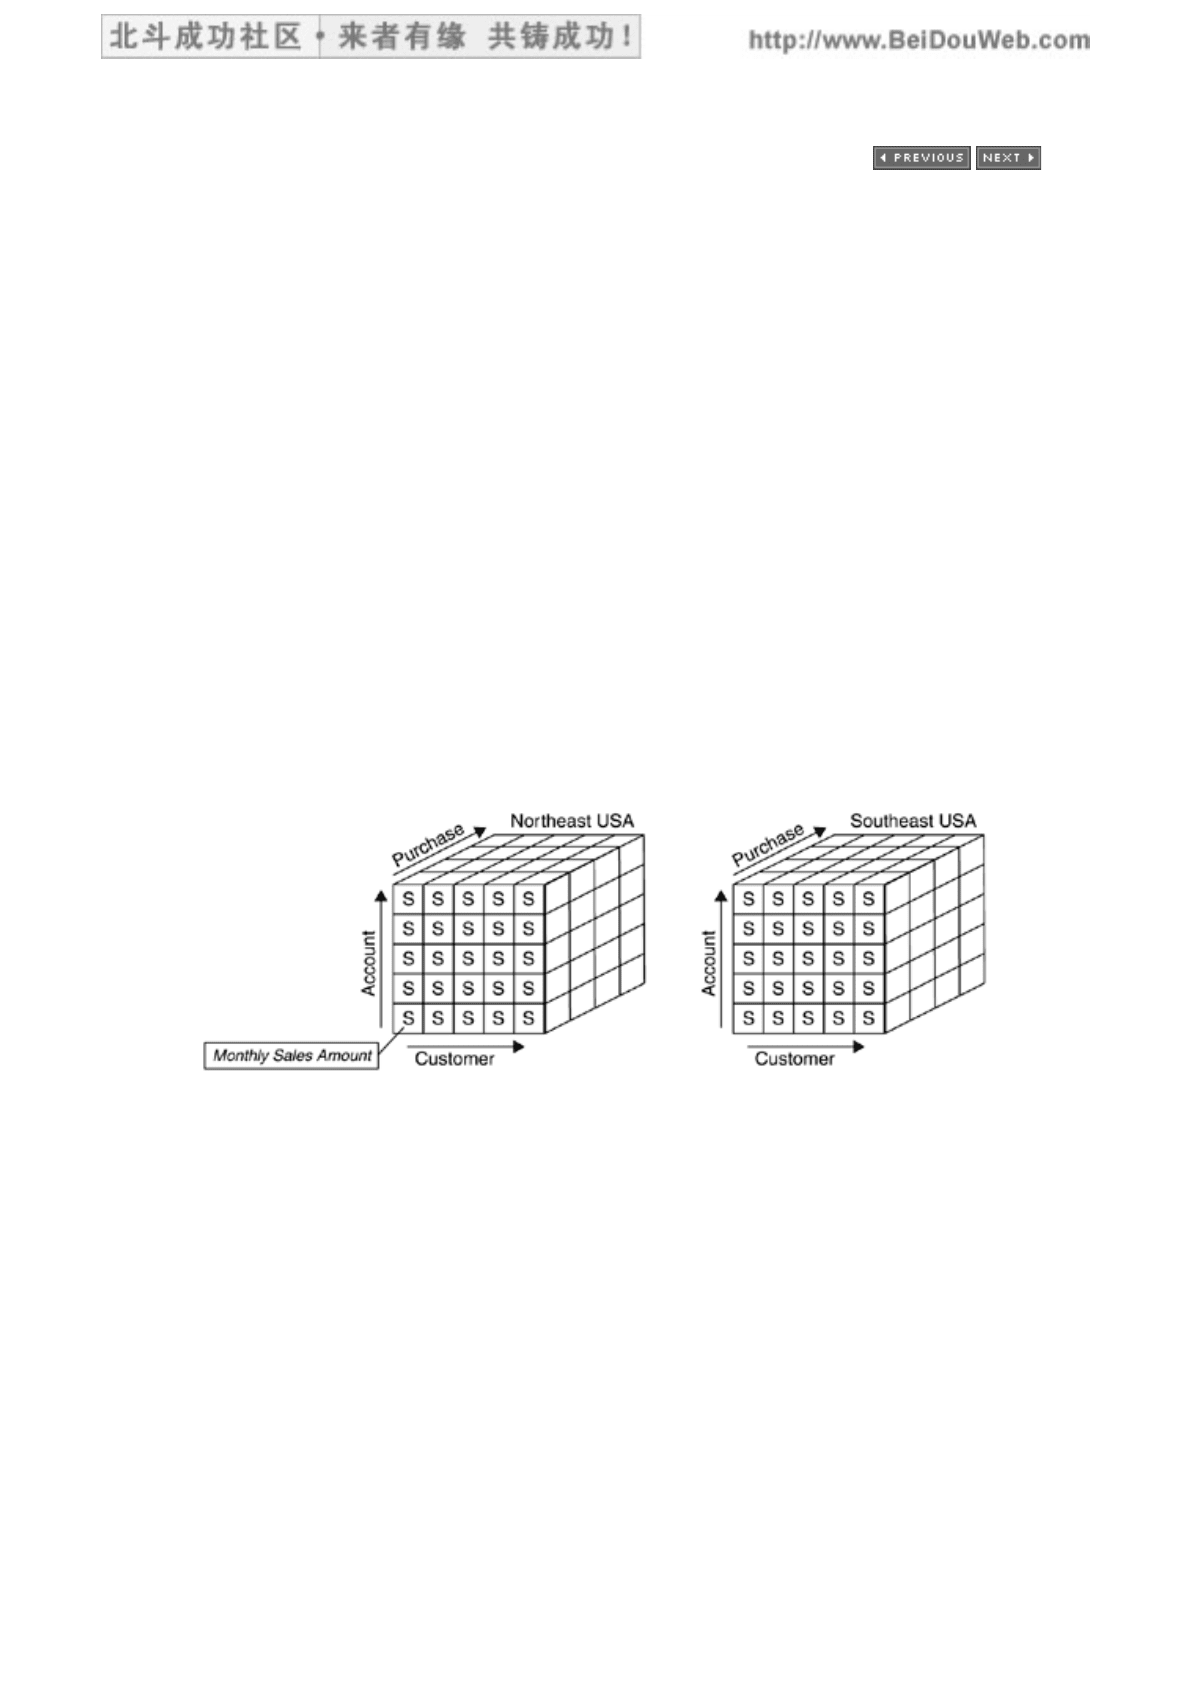
Figure 12.1 illustrates multidimensionality through a four-dimensional cube with the
dimensions customer, account, purchase, and geography. The two examples of
geography in this figure are the regions northeast USA and southeast USA.
Figure 12.1. Four-Dimensional Data Representation
Customer profiling and customer profitability are popular multidimensional BI
applications. The dimensions of a customer profitability example are listed in Figure
12.2.
Figure 12.2. Multidimensional Customer Profitability
北斗成功社区 BeiDouWeb.com 教育音视频/电子书/实用资料文档/励志音乐影视 仅供免费试用/版权原著所有
361/631
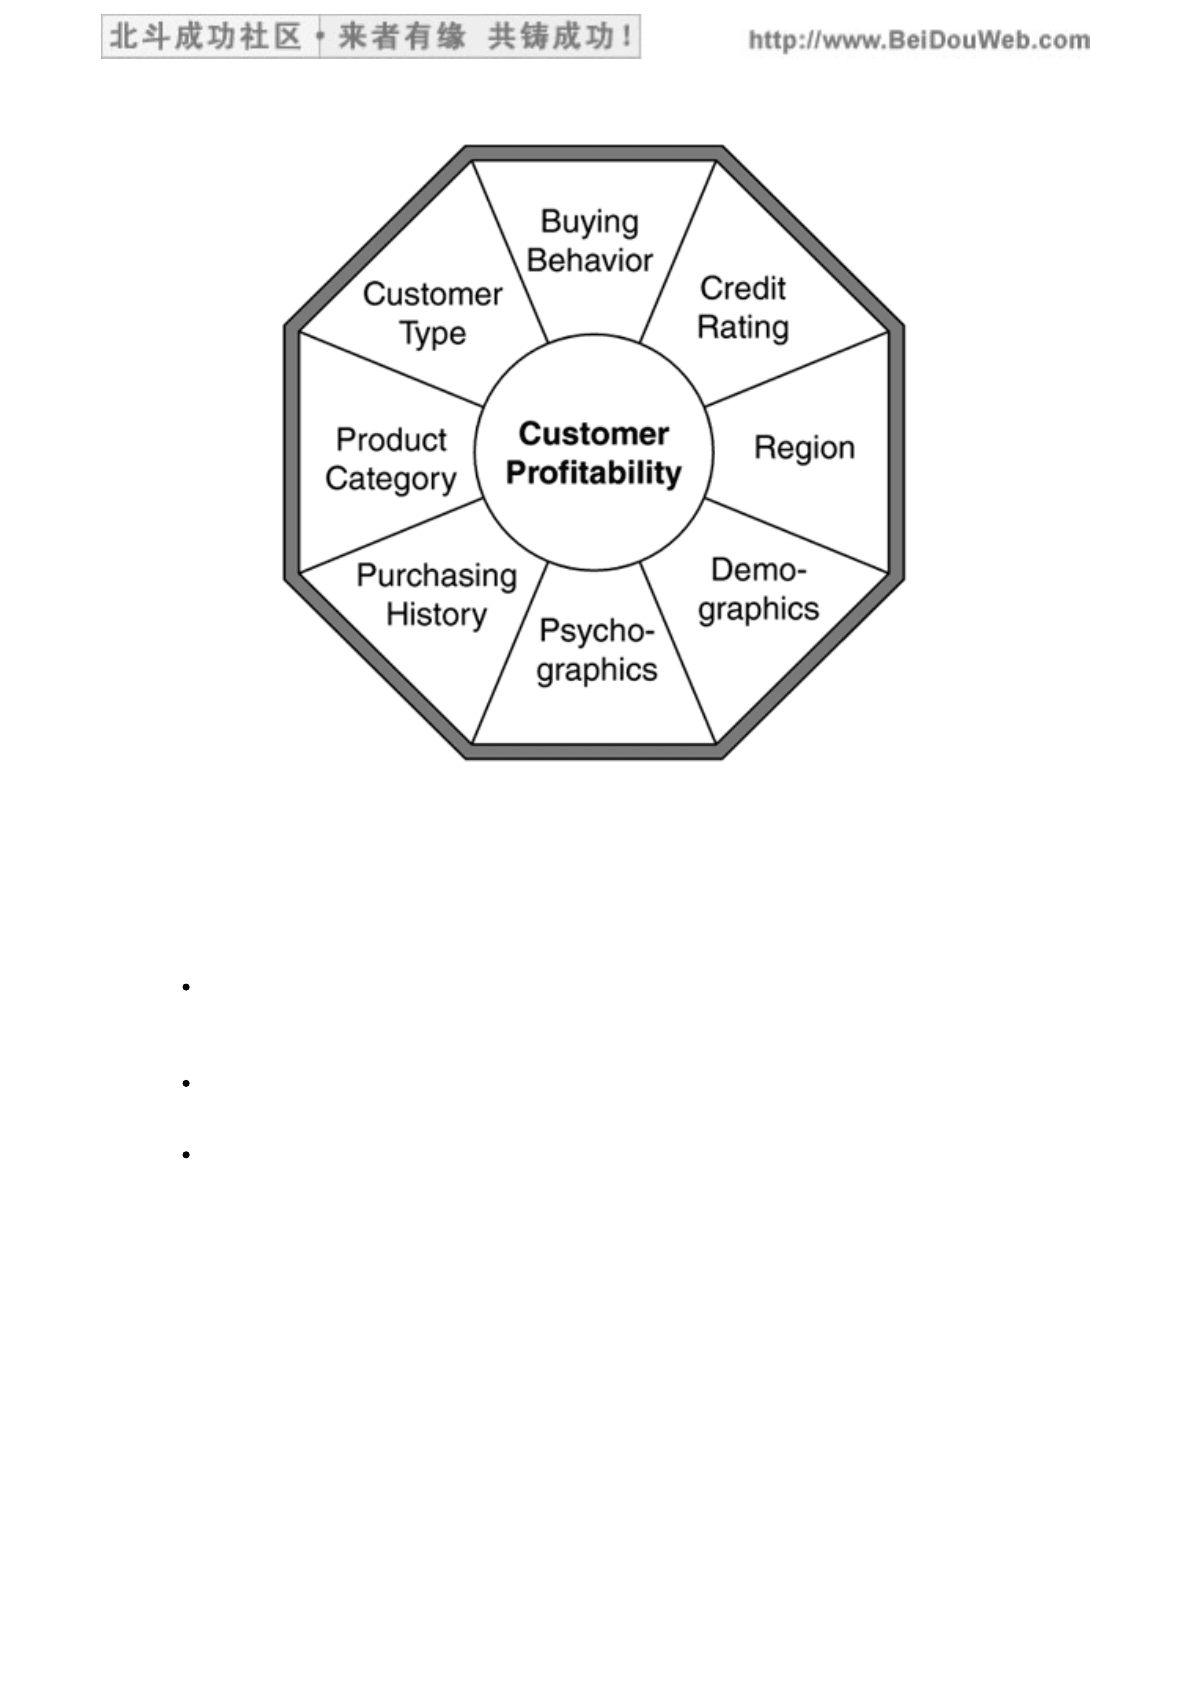
The eight dimensions of customer type, buying behavior, credit rating, region,
demographics, psychographics, purchasing history, and product category can be
used to analyze the various perspectives of customer profitability.
Some additional examples of complex multidimensional analysis commonly
performed in the BI decision-support environment include those listed below.
Customer information: Buying patterns by product, geography, time, age,
gender, number of children, types of cars owned, education level, or income
level
Financial planning: Business analysis on profit margins, costs of goods sold, tax
codes, or currency exchange rates
Marketing: Impact of promotions and marketing programs, pricing,
competitors' initiatives, and market trends
Multivariate Analysis
Another term for multidimensional analysis is multivariate analysis. This term is
derived from a specific aspect of this type of analysis, namely, to analyze measures
(facts) from the perspective of multiple variables or characteristics. These variables
(characteristics) usually describe business objects or dimensions. For example,
Product Type describes product and Customer Age describes customer, with product
and customer being the business objects or dimensions. Occasionally, the variables
can become dimensions in their own right. For example, the variables Product Type
and Customer Age can be treated as dimensions. In other words, a dimension can be
built for a business object or for a variable of that business object.
北斗成功社区 BeiDouWeb.com 教育音视频/电子书/实用资料文档/励志音乐影视 仅供免费试用/版权原著所有
362/631

These two types of dimensions (the object dimension and the variable dimension)
can be illustrated by a simplified example of earthquake analysis. Earthquakes are
typically reported by their epicenter, such as the intersection of latitude and
longitude coordinates of a location, and by their intensity, such as 7.5 on the Richter
scale. Location is normally a business object; thus epicenter can be used as an object
dimension, which may be described by variables such as Location Name, Location
Address, and Population Size. Intensity, on the other hand, is normally not a
business object but a variable that describes the business object earthquake. In this
example, however, intensity is treated as an object in its own right and is therefore
used as a variable dimension. Another example of a variable dimension might be
Shock Type (foreshock, aftershock), which is normally also a variable of the business
object earthquake.
Variable dimensions are often "degenerate" dimensions, which means that even
though they are being treated as dimensions when precalculating or analyzing the
facts, they are not implemented as physical dimension tables. The main reason is
that variable dimensions usually do not have other variables describing them—or
they would not be variable dimensions in the first place. For example, intensity is
simply a set of numerical values (numbers on a Richter scale), and there are no
other descriptive characteristics about it.
[ Team LiB ]
北斗成功社区 BeiDouWeb.com 教育音视频/电子书/实用资料文档/励志音乐影视 仅供免费试用/版权原著所有
363/631
[ Team LiB ]
Online Analytical Processing Architecture
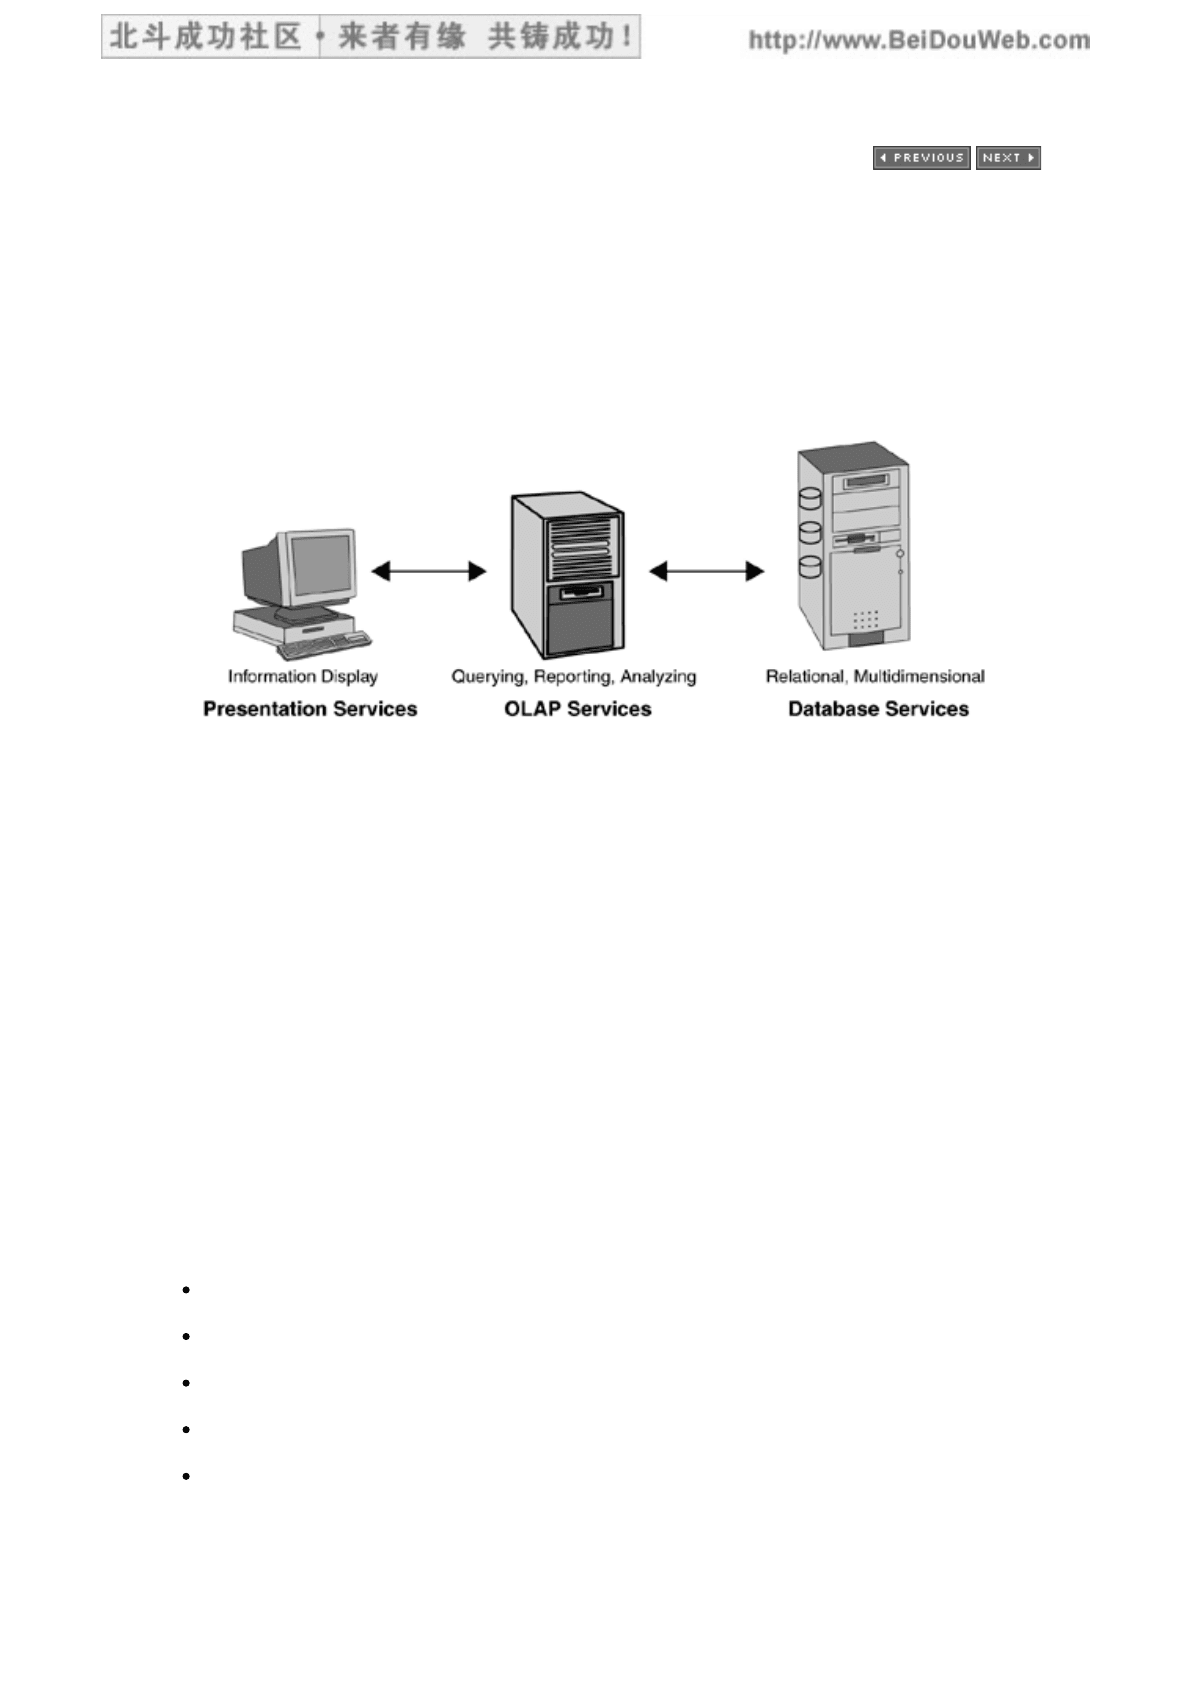
Conceptually, OLAP architecture consists of three functional components:
presentation services, OLAP services, and database services (Figure 12.3).
Figure 12.3. Functional Components of OLAP Architecture
Presentation Services
OLAP is supposed to provide the link everyone has been looking for between data
and the business. Yet most organizations still seem to be data rich and information
poor because the real world of business exists in bits and pieces, not in bits and
bytes. Information is data that can be analyzed, synthesized, and used in a valid
business context. The people who need this data are knowledge workers, business
analysts, business managers, and business executives, not technicians. Therefore,
the data needs to be presented in a format that enables the business people to
develop proposals, decide how many widgets to buy, define investment levels, and
set hiring targets.
Presentation services have to be easy to use, and ease of use has to be determined
by the business people, not by the information technology (IT) staff. For example,
business people want an intuitive graphical user interface (GUI) and the ability to
work with familiar business terms. Therefore, an easy-to-use OLAP tool should hide
the underlying structure of the data and hide the processes that run behind the
scenes. Furthermore, ease of use should be expressed in quantifiable terms.
How much time is needed to learn the OLAP tool?
How fast can a person perform his or her analysis tasks?
Do business people like using the OLAP tool?
Does the OLAP tool have all of the required functionality?
Can the OLAP tool integrate with other desktop tools, such as Microsoft Excel?
Presentation services have to be flexible and adaptable because different business
北斗成功社区 BeiDouWeb.com 教育音视频/电子书/实用资料文档/励志音乐影视 仅供免费试用/版权原著所有
364/631

people have different preferences and different skill sets. For example, some
business people like tabular reports; others like graphs and charts. Some business
people have no computer skills at all, some are more advanced, and some are
experts. The menus, icons, and functions should be configured depending on the skill
set profile, and they may have to be reconfigured over time. When the beginners
start to become experts, they no longer like the cute messages that were originally
provided to them for encouragement. Experts expect better performance and faster
responses, and in order to provide that, there should be less clutter on their screens.
An ideal OLAP tool should be able to adjust to all these different levels of preferences
and skill sets and should be able to provide different levels of presentation.
OLAP Services
An OLAP tool should provide a wide range of services. It should be able to support
simple querying with just a few dimensions, and at the same time, it should be able
to support powerful querying with many dimensions. In addition, an OLAP tool
should be able to integrate all the analytical processing requirements of "What
happened?" with those of "Why did this happen?" Querying capabilities (from very
simple to complex), reporting capabilities (from very basic to sophisticated), and
multidimensional analysis and presentation of the results are some of the OLAP
services that help turn data into useful information.
Querying, reporting, and analyzing are interrelated, interactive, and iterative. For
example, the results of a query might appear in the form of a table, chart, or graph,
presented in several dimensions. While studying these query results, a business
analyst may think of a new question, which may lead to a new query. He or she may
then want to have the results of the new query printed out as a report. Therefore,
OLAP tools should have integrated querying, reporting, and analyzing services. A
person should not have to log off the querying tool to get into a different reporting
tool and then log off the reporting tool to get into an analysis tool. Querying,
reporting, and analyzing should be a seamless transition performed by the tool, not
by the person.
In order to leverage these OLAP services, we need to change the way we develop
applications and the way we present information. BI applications, which emphasize
quick delivery of functionality, ease of use, and affordable desktop hardware and
software, should be the vehicles for IT to provide OLAP capabilities to more business
people in the organization.
Database Services
OLAP architecture supports two types of databases, conventional relational
databases (e.g., DB2, Oracle), which are accessible with ROLAP tools, and
proprietary multidimensional databases, which are supplied with MOLAP tools.
ROLAP tools can access any of the major relational DBMSs as long as the
underlying application database design is multidimensional, such as star
schemas (facts and denormalized dimensions), snowflake schemas (facts and
normalized dimensions), and hybrid schemas (combination of normalized and
denormalized dimensions). Depending on the DBMS, the database designer
would use common physical design techniques such as:
北斗成功社区 BeiDouWeb.com 教育音视频/电子书/实用资料文档/励志音乐影视 仅供免费试用/版权原著所有
365/631

- Selecting the most efficient indexing schema for the underlying DBMS
product in order to improve performance
- Partitioning the database into smaller, manageable partitions to
improve performance and to facilitate database maintenance activities
- Clustering the data and physically co-locating related tables
- Determining the most appropriate data and index placements
MOLAP tools are designed to access their own proprietary databases, which
are special data structures (e.g., Essbase), and to perform their OLAP
operations on these data structures. MOLAP tools implement their functionality
in a variety of different ways.
- Some products store data in arrays or cubes and therefore have
different data preparation requirements.
- Some products require prebuilding dimensions in the staging area
before loading them; others build the dimensions from the data at load
time.
- Some products provide an application programming interface (API);
others do not.
- Some products offer "turnkey" applications with multidimensional
servers and substantial OLAP functionality.
- Most products have their own proprietary access methods and front
ends.
[ Team LiB ]
北斗成功社区 BeiDouWeb.com 教育音视频/电子书/实用资料文档/励志音乐影视 仅供免费试用/版权原著所有
366/631

[ Team LiB ]
Development Environments
The development of vital business applications does not happen ad hoc on someone's
personal computer. Most organizations require some kind of formal or structured
approach for developing these applications, testing them, and delivering them. Some
organizations (and some projects) require more structure than others. Also, on BI
applications, some application components need more structure than others.
For example, an informal and dynamic development approach for building the front-
end access and analysis components is quite appropriate. Front-end applications are
usually built with flexible tools that lend themselves quite well to rapid and iterative
development cycles. It is quite common for the application track to go through
several stages of prototyping, especially multiple iterations of operational
prototyping, while performing analysis, design, coding, and testing activities almost
all at the same time. However, developing the back-end ETL process in such an
informal and dynamic way is not appropriate. ETL development requires a more
formalized or structured approach because of its size and complexity. Even when ETL
tools are used, the activities of the ETL development track are much more similar to
a large operational systems development project than to the dynamic prototyping
activities of the application development track.
To support these different types of activities, organizations usually set up different
development environments for different purposes. While smaller organizations may
have only two environments (development and production), large organizations
usually have at least four different environments:
The prototyping environment, where the testing of the technology and the
solidifying of the project requirements occur
1.
The development environment, where the programs and scripts are written and
tested by the developers
2.
The QA environment, where the operations staff tests the final programs and
scripts before allowing them to be moved into the production environment
3.
The production environment, where the programs and scripts run after being
rolled out
4.
Depending on the overall setup of the environments, early prototyping activities
(such as creating show-and-tell, mock-up, proof-of-concept, visual-design, and
demo prototypes) typically take place in a special-purpose prototyping environment,
while development activities (including operational prototyping) are performed in the
development environment. However, it is just as common to perform all prototyping
and development activities in the same development environment. In either case,
the entire BI application should be moved to the QA environment for final QA and
acceptance testing before being implemented in the production environment.
If the different development environments are configured differently, moving your
application from one environment to another could have major implications for your
BI project.
北斗成功社区 BeiDouWeb.com 教育音视频/电子书/实用资料文档/励志音乐影视 仅供免费试用/版权原著所有
367/631

The prototyping and development environments are usually configured similarly, as
are the QA and production environments. The configuration differences are typically
between the development and production environments. Key considerations appear
below.
If the application works well in the development environment, there is no
guarantee that the application will run equally well in the production
environment.
It is conceivable that the migration costs from one environment to another
could be substantial.
New or different tools may be required for differently configured environments.
The Web Environment
Another environment that is becoming more and more popular for BI applications is
the Web. Since most OLAP tools are Web-enabled, the data from the BI target
databases can be and often is published company-wide through the intranet. A
subset of that data can also be made available through a separate portal to business
partners via the extranet or to customers via the Internet. Special security and
authentication measures must be taken in the Web environment. Only qualified
persons should be able to access authorized databases, and all access requests must
pass through a firewall.
In addition to being a data delivery platform, the Web environment can also be a
source for BI data. Capturing Web logs is a standard practice on Web sites, and the
ability to extract, filter, summarize, and report the log data for click-stream analysis
is a popular type of BI application (Web warehouse). Click-stream analysis can help
identify customer interest (number of hits), gauge the effectiveness of Internet
advertisements, and track the results of promotions. Table 12.1 shows a list of
commonly available Web log data.
Table 12.1. Common Web Log Data
Click-Stream Data
Client IP address
User ID
Date and time of server response
Request (GET, POST)
Status from server to browser
Number of bytes sent
Prior site information (URL, path, documents, and so on)
Browser name
Cookie information
北斗成功社区 BeiDouWeb.com 教育音视频/电子书/实用资料文档/励志音乐影视 仅供免费试用/版权原著所有
368/631

[ Team LiB ]
北斗成功社区 BeiDouWeb.com 教育音视频/电子书/实用资料文档/励志音乐影视 仅供免费试用/版权原著所有
369/631
[ Team LiB ]
Application Development Activities
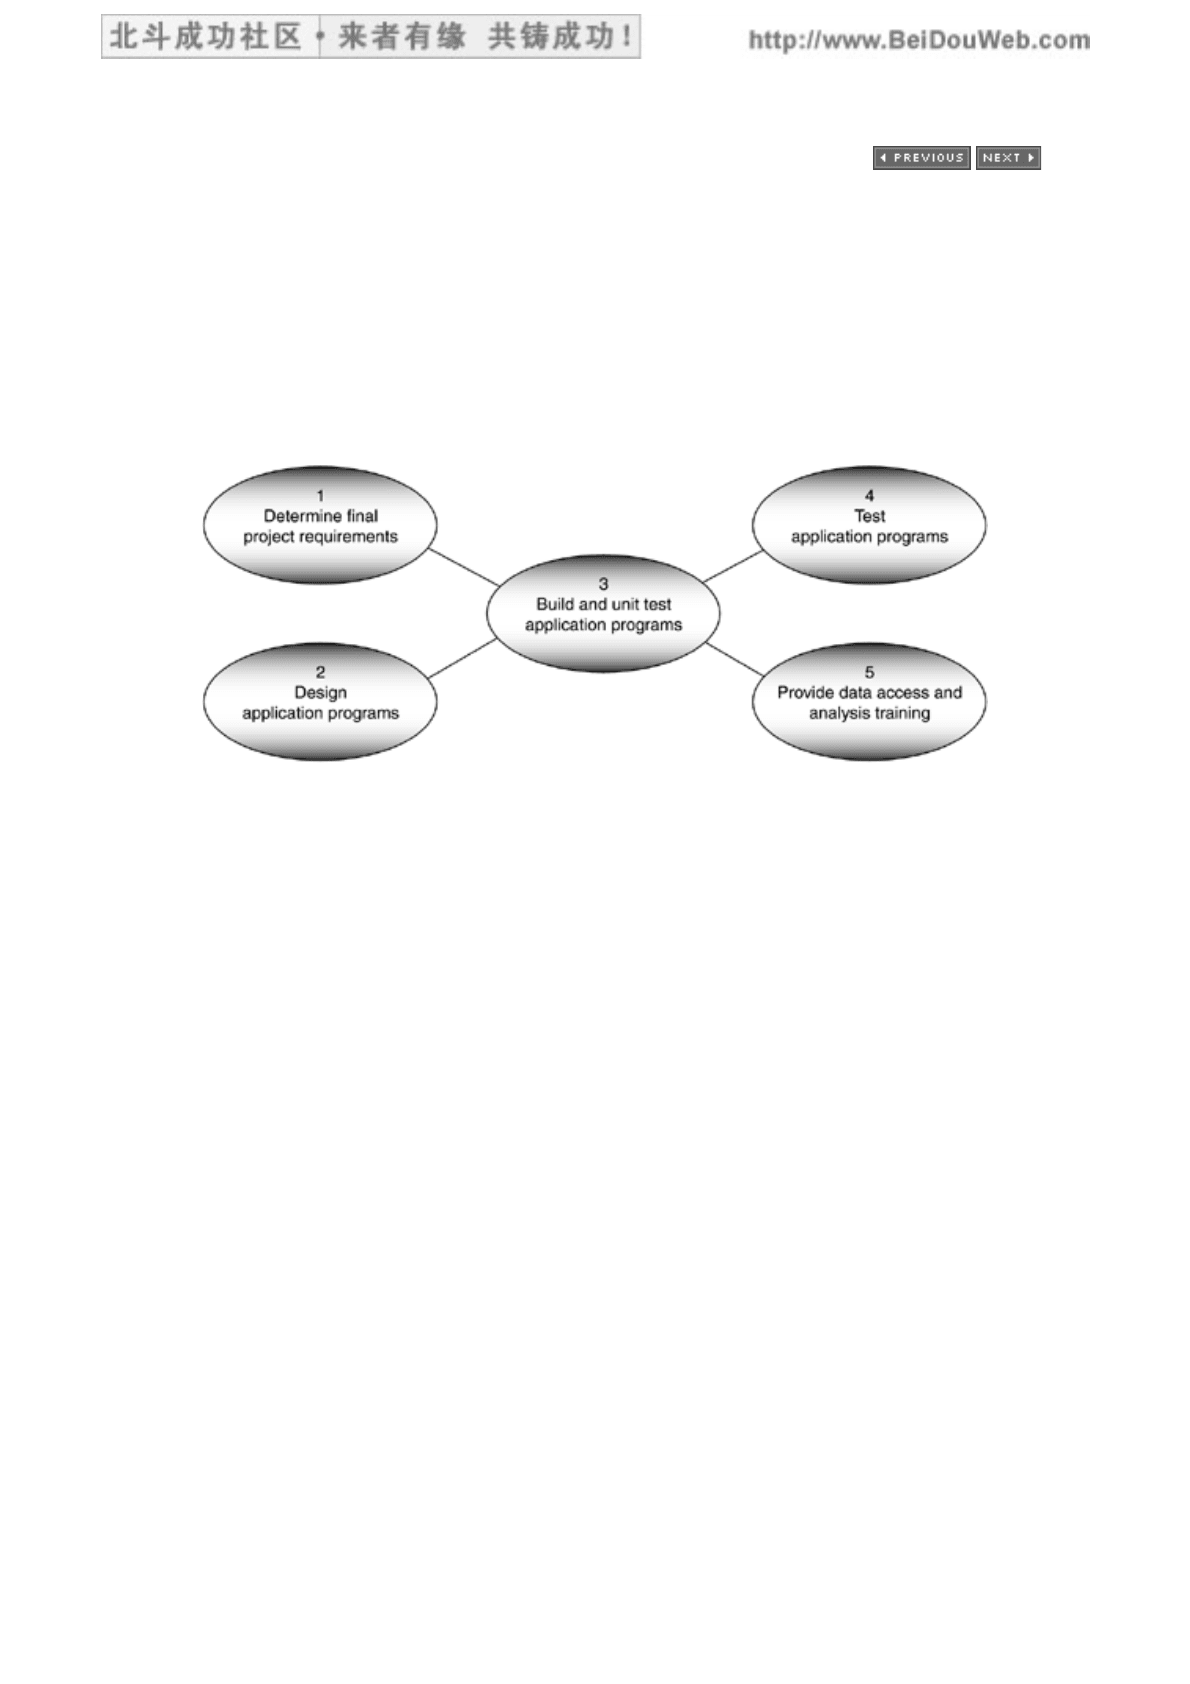
The activities for application development do not need to be performed linearly.
Figure 12.4 indicates which activities can be performed concurrently. The list below
briefly describes the activities associated with Step 12, Application Development.
Figure 12.4. Application Development Activities
Determine the final project requirements.
If you built a prototype, review the prototype results and determine what
changes were requested and what issues were logged during that activity. This
will give you an understanding of the stability of the requirements. In addition,
adjust your design or renegotiate the requirements based on what worked and
what did not work during the prototype.
1.
Design the application programs.
While reviewing the prototype results and the required query and report mock-
ups, design the access and analysis components of the BI application, including
the final reports, queries, front-end interface (GUI, Web), and online help
function. Develop a test plan with detailed test cases.
2.
Build and unit test the application programs.
Create test data and write the programs and scripts for the reports, queries,
front-end interface, and online help function. Be sure to unit test the programs
and scripts not only to prove that they compile without errors but also to verify
that they perform their functions correctly, trap all potential errors, and
produce the right results.
3.
Test the application programs.
Perform integration or regression testing on all programs and scripts in the
sequence in which they will run in the production environment. Load the
development databases with sample "live" data, and test the programs and
scripts against them. Check the actual test results against the expected test
results, then revise and retest the programs and scripts until they perform as
4.
北斗成功社区 BeiDouWeb.com 教育音视频/电子书/实用资料文档/励志音乐影视 仅供免费试用/版权原著所有
370/631