Omran M.G.H. Particle Swarm Optimization Methods for Pattern Recognition and Image Processing
Подождите немного. Документ загружается.

110
imagery data. Finally, section 4.2.9 provides a discussion of applying PSO to data
clustering.
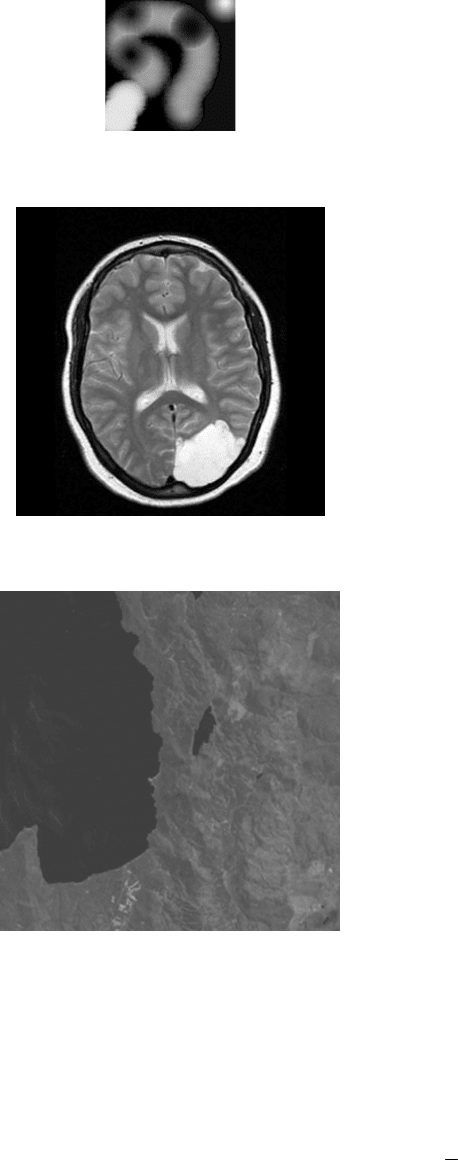
(a) Synthetic image
(b) MRI Image of Human brain
(c) Band 4 of the Landsat MSS test image of Lake Tahoe
Figure 4.2: Data set consisting of synthetic, MRI and LANDSAT images
The results reported in this section are averages and standard deviations over 20
simulations. All comparisons are made with reference to
e
J ,
max
d and
min
d
.

111
Furthermore, a total number of clusters of 3, 8 and 4 were used respectively for the
synthetic, MRI and Tahoe images.
4.2.1 gbest PSO versus K-Means
This section presents results to compare the performance of the gbest PSO algorithm
with that of the K-means algorithm for each of the images.
Table 4.1 summarizes the results for the three images. In all cases, for PSO, 50
particles were trained for 100 iterations; for K-means, 5000 iterations were used (that
is, both algorithms have performed 5000 function evaluations). V
max
= 5, w = 0.72 and
c
1
= c
2
= 1.49. The chosen values of w, c
1
, and c
2
are popular in the literature and
ensure convergence [Van den Bergh 2002]. For the fitness function in equation (4.2),
w
1
= w
2
= 0.5 to give each subobjective an equal contribution.
The results showed that, for the images used, K-means performed better than
the PSO algorithm with reference to the quantization error
e
J . However,
e
J does not
give an idea of the quality of the individual clusters. With respect to the minimization
of intra-distances (
max
d ) and the maximization of inter-distances (
min
d ), the PSO
algorithm generally performed better than K-means clustering.
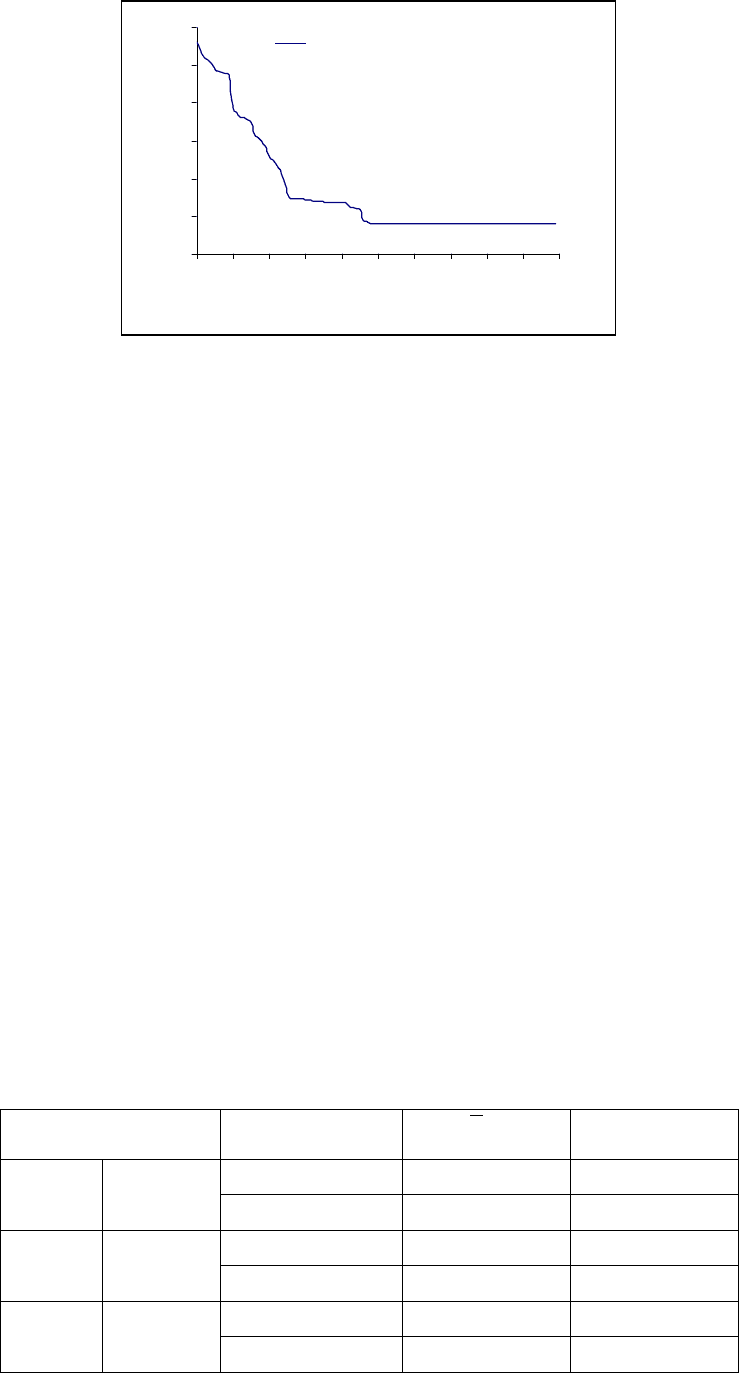
Figure 4.3 illustrates for the synthetic image how the fitness of PSO improves
over time. For this figure, 10 particles have been used for a training phase of 100
iterations, V
max
= 5, w = 0.72, c
1
= c
2
= 1.49, and w
1
= w
2
= 0.5. The fitness value, as
measured using equation 4.2, improves from the initial 96.637 to 91.781.
112
91
92
93
94
95
96
97
0 102030405060708090100
Iteration
Fitness of Best Particle
PSO 10 particles
Figure 4.3: PSO Performance on Synthetic Image
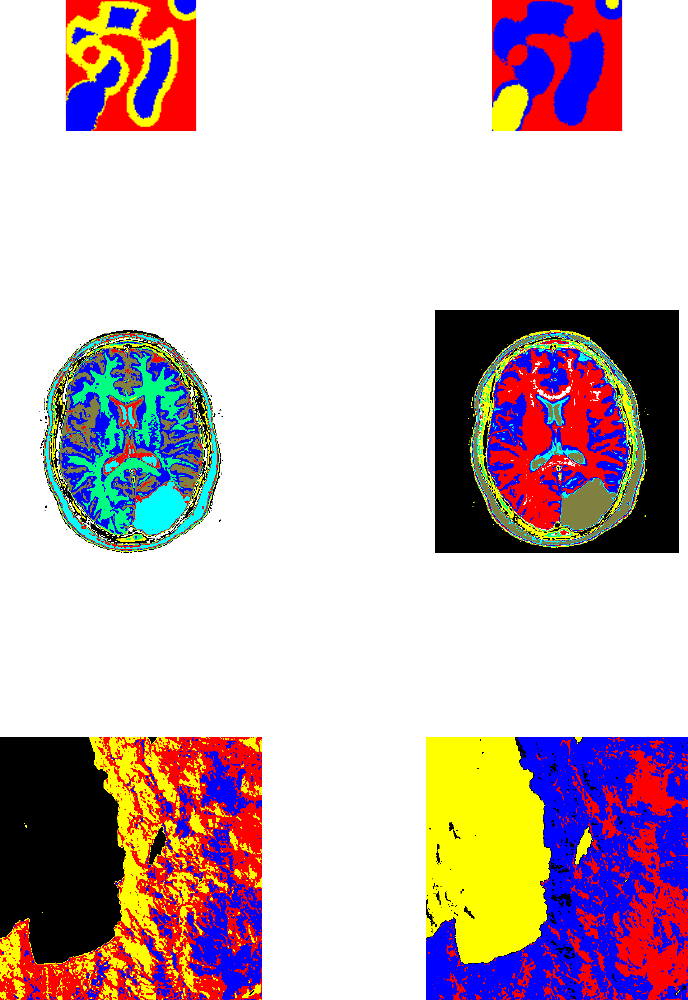
Figure 4.4(a) illustrates the segmented image of the synthetic image for the K-
means algorithm, while Figure 4.4(b) illustrates the segmented image obtained from
the PSO algorithm. These figures clearly illustrate that K-means was trapped in a
local optimum. Three clusters were created using two brushers, the brighter brush
were used to create the two spots in the upper right and lower left corner while the
other brush were used to create the remaining shape. K-means could not classify the
clusters correctly, since it failed to cluster the two spots as separate clusters. PSO, on
the other hand, was not trapped in this local optimum and succeeded in showing the
two spots as separate clusters. The segmented images for the MRI and the Tahoe
images are given in Figures 4.5 and 4.6, respectively.
Table 4.1: Comparison between K-means and PSO
Image
e
J
max
d
min
d
Synthetic K-means
20.212 ± 0.938 28.040 ± 2.778 78.498 ± 7.0629
PSO
24.453 ± 0.209 27.157 ± 0.017 98.679 ± 0.023
MRI K-means
7.370 ± 0.0428 13.214 ± 0.762 9.934 ± 7.309
PSO
8.536 ± 0.584 10.129 ± 1.262 28.745 ± 2.949
Tahoe K-means
1.664 ± 0.040 3.107 ± 0.168 4.527 ± 1.347
PSO
7.215 ± 2.393 9.036 ± 3.363 25.777 ± 9.602
113
(a) K-means (b) PSO
Figure 4.4: The Segmented Synthetic Images
(a) K-means (b) PSO
Figure 4.5: The Segmented MRI Images
(a) K-means (b) PSO
Figure 4.6: The Segmented Lake Tahoe Images

114
4.2.2 Improved Fitness Function
The above experimental results have shown that the PSO clustering algorithm
improves on the performance of the K-means algorithm in terms of inter- and intra-
cluster distances. An improved fitness function which simply adds to the previous
fitness function an additional sub-objective to also minimize the quantization error is
presented in the following equation:
i
eiiiii
Jwdzwdwf
,
3minmax2max1
))((),(),( +−+= xxZZx
(4.6)
In this section, the results of the gbest PSO shown in the previous section are
compared with results using the new fitness function as defined in equation (4.6). All
parameters are set as in the previous section. The only difference is that for the
extended fitness function, w
1
= w
2
= 0.3, w
3
= 0.4 were used for the synthetic image,
w
1
= 0.2, w
2
= 0.5, w
3
= 0.3 were used for the MRI image and w
1
= w
2
= w
3
=
0.333333 were used for the Tahoe image. These values were set empirically.
Table 4.2 compares the results for the two fitness functions. The new fitness
function succeeded in significant improvements in the quantization error,
e
J . The
new fitness function also achieved significant improvements in minimizing the intra-
cluster distances for the synthetic and Tahoe images, thus resulting in more compact
clusters, and only marginally worse for the MRI image. These improvements were at
the cost of loosing on maximization of the inter-cluster distances. However, this loss
is acceptable because the gbest PSO using the new fitness function still performs

115
better than the K-means algorithm in terms of the inter-cluster distance (compare the
results in Table 4.1 and Table 4.2).
Due to the improved performance on the quantization error and intra-cluster
distances, the rest of this chapter uses the 3-component fitness function as defined in
equation (4.6).
Table 4.2: 2-component versus 3-component fitness function
2-Component Fitness Function 3-Component Fitness Function
Problem
e
J
max
d
min
d
e
J
max
d
min
d
Synthetic
24.453 ±
0.209
27.157 ±
0.017
98.679 ±
0.023
17.113 ±
0.548
24.781 ±
0.270
92.768 ±
4.043
MRI
8.536 ±
0.584
10.129 ±
1.262
28.745 ±
2.949
7.225 ±
0.552
12.206 ±
2.507
22.936 ±
8.311
Tahoe
7.215 ±
2.393
9.036 ±
3.363
25.777 ±
9.602
3.556 ±
0.140
4.688 ±
0.260
14.987 ±
0.425
4.2.3 gbest PSO versus GCPSO
This section compares the performance of the gbest PSO with the GCPSO. This is
done for a low V
max
= 5 and a high V
max
= 255. All other parameters are as for section
4.2.2. Table 4.3 shows no significant difference in the performance between PSO and
GCPSO. It is, however, important to note that too much clamping of the velocity
updates have generally a negative influence on performance. In general, better results
were obtained, for both the PSO and GCPSO with a large value of V
max
.

116
Table 4.3: PSO versus GCPSO
PSO GCPSO Problem
V
max
=5
e
J
max
d
min
d
e
J
max
d
min
d
Synthetic
17.112672 ±
0.548096
24.781384 ±
0.270409
92.767925 ±
4.043086
17.116036 ±
0.547317
24.826868 ±
0.237154
92.845323 ±
4.056681
MRI
7.225384 ±
0.552381
12.205947 ±
2.506827
22.935786 ±
8.310654
7.239264 ±
0.475250
12.438016 ±
2.437064
23.377287 ±
6.722787
Tahoe
3.556281 ±
0.139881
4.688270 ±
0.259919
14.986923 ±
0.425077
3.542732 ±
0.109415
4.672483 ±
0.129913
15.007491 ±
0.621020
V
max
=255
Synthetic
17.004993 ±
0.086698
24.615665 ±
0.143658
93.478081±
0.276109
17.000393 ±
0.022893
24.672107 ±
0.174457
93.588530 ±
0.400137
MRI
7.640622 ±
0.514184
10.621452 ±
1.284735
24.948486 ±
3.446673
7.694498 ±
0.591383
10.543233 ±
1.038114
25.355967 ±
3.945929
Tahoe
3.523967 ±
0.172424
4.681492 ±
0.110739
14.664859 ±
1.177861
3.609807 ±
0.188862
4.757948 ±
0.227090
15.282949 ±
1.018218
4.2.4 Influence of PSO Parameters
The PSO have a number of parameters that have an influence on the performance of
the algorithm. These parameters include V
max
, the number of particles, the inertia
weight and the acceleration constants. Additionally, the PSO-based clustering
algorithm adds a weight to each sub-objective. This section investigates the influence
of different values of these parameters.
Velocity Clamping
Table 4.3 shows that less clamping of velocity updates is more beneficial. This allows
particles to make larger jumps in the search space.
117
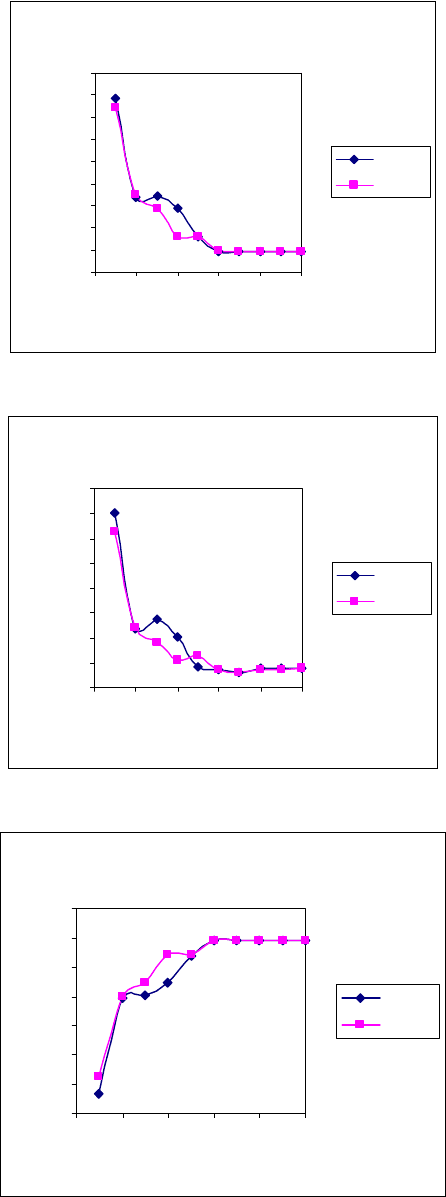
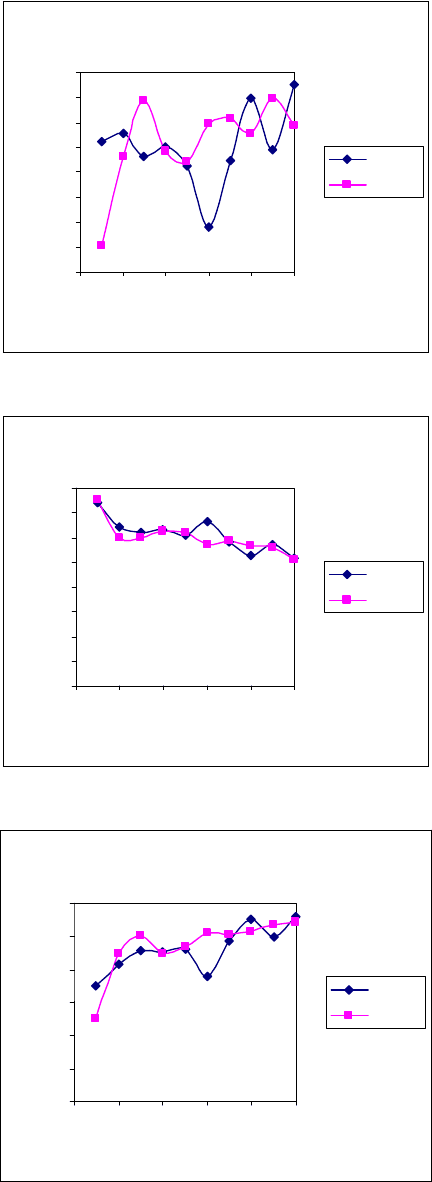
Swarm Size
To investigate the effect of different swarm sizes on performance, both the PSO and
GCPSO have been executed using 10 to 100 particles. All other parameters are as for
section 4.2.2. Figure 4.7 shows the effect of the swarm size, s, on the synthetic image.
It is clear from the figure that increasing the number of particles improves the
performance of both algorithms. The same conclusion can be drawn for the MRI
image as illustrated in Figure 4.8. However, it can be observed from Figure 4.7, that
no significant improvement is achived for more than 60 particles. In general, an
increase in the number of particles increases diversity, thereby limiting the effects of
initial conditions and reducing the possibility of being trapped in local minima.
Inertia Weight
Given that all parameters are fixed at the values given in section 4.2.2, the inertia
weight w was set to different values for both PSO and GCPSO. In addition, a dynamic
inertia weight was used with an initial w =1.4, which linearly decreased to 0.8. The
initial large value of w favors exploration in the early stages, with more exploitation in
the later stages with the smaller values. Tables 4.4 and 4.5 summarize the results for
the synthetic and MRI images respectively. For the synthetic image, the results
illustrate no significant difference in performance, meaning that for the synthetic
image, the PSO-based clustering algorithms are generally insensitive to the value of
the inertia weight (provided that c
1
and c
2
are selected such that equation (2.9) is not
violated). However, in the MRI image, it can be observed that w =0 yields the best
results in terms of inter- and intra-cluster distances.
118
Synthetic Image tmax = 100
16.8
17
17.2
17.4
17.6
17.8
18
18.2
18.4
18.6
0 20 40 60 80 100
s
Je
PSO
GCPSO
(a) Quantization error
Synthetic Image tmax = 100
24.7
24.8
24.9
25
25.1
25.2
25.3
25.4
25.5
0 20 40 60 80 100
s
dmax
PSO
GCPSO
(b) Intra-cluster Distances
Synthetic Image tmax = 100
82
84
86
88
90
92
94
96
0 20406080100
s
dmin
PSO
GCPSO
(c) Inter-cluster Distances
Figure 4.7: Effect of swarm size on synthetic image
119
MRI Image tmax = 100
6.8
6.9
7
7.1
7.2
7.3
7.4
7.5
7.6
0 20 40 60 80 100
s
Je
PSO
GCPSO
(a) Quantization error
MRI Image tmax = 100
0
2
4
6
8
10
12
14
16
0 20 40 60 80 100
s
dmax
PSO
GCPSO
(b) Intra-cluster Distances
MRI Image tmax = 100
0
5
10
15
20
25
30
0 20406080100
s
dmin
PSO
GCPSO
(c) Inter-cluster Distances
Figure 4.8: Effect of swarm size on MRI image