Omran M.G.H. Particle Swarm Optimization Methods for Pattern Recognition and Image Processing
Подождите немного. Документ загружается.


140
-
The separation (in number of pixels) between adjacent clusters S
k,kk
≥ 0
where k, kk = 1,…, K, i.e. the inter-cluster distance between two
adjacent clusters
C
k
and C
kk
.
After specifying the above information, the synthetic image can be constructed
according to the algorithm summarized in Figure 5.1.
For each cluster k = 1,…, K do
Distribute
k
C
′
.N
p
/100 pixels of cluster C
k
according to p
k
Endloop
For each pixel
p
z do
Assign
p
z randomly to any cluster C
k
, where k = 1,…, K, based on the image
histogram
Endloop
Create a thematic map image using
K
k
p
255
=
z ∀ p = 1,…, N
p
, k = 1,…, K (5.1)
where k is the index of cluster
C
k
to which
p
z
belongs
Figure 5.1: The synthetic image generator algorithm
The synthetic image generation algorithm works as follows: The first step constructs a
synthetic image histogram by distributing N
p
image pixels into the K clusters
according to the cluster distribution specified by the user. The number of pixels in
141
cluster
C
k
can be determined by multiplying the percentage of points in the image
belonging to cluster
C
k
by the number of image pixels N
p
divided by 100 (i.e.
k
C
′
.N
p
/100). The second step assigns the synthetic image pixels randomly to the
clusters according to the histogram created in the first step. Now, the synthetic image
has been generated with the specified histogram. Finally, a thematic map image is
generated according to equation (5.1). This map will help the user to verify the
accuracy of any clustering algorithm when used in the clustering verification unit.
The synthetic image generator unit therefore generates two images: The first is
the synthetic image representing the data set specified by the user, and the second is a
thematic map of the generated synthetic image.
5.2.2 Clustering Verification Unit
The clustering verification unit verifies the average classification accuracy of the
clustering algorithm being evaluated. This is done by comparing the thematic map
generated from the synthetic image generation unit (or if the user has a thematic map
representing the correct clustering) and the thematic map resulting from the clustering
algorithm (this thematic map should be generated using equation (5.1)). This unit
consists of two components, namely the clustering validity checker and the average
performance analyzer. These components are described next.
5.2.2.1 Clustering Validity Checker Component
The clustering validity checker component verifies the average performance of any
clustering algorithm with reference to a single image. It calculates the average
142
classification accuracy over a number of trials. The component requires the user to
specify the following information:
•
Dynamic range in bits.
•
Original image name (e.g. synthetic image name generated from the first unit).
•
Reference thematic map name representing the correct classification (e.g.
thematic map generated from the first unit), TM
r
.
•
Executable program name of the clustering algorithm.
•
Thematic map resulting from the clustering algorithm being examined (e.g. K-
means, FCM, etc.), TM
c
.
•
Image size in pixels, N
p
.
•
Number of clusters, K.
•
Number of runs of the clustering program, N
r
.
The clustering verification algorithm is summarized in Figure 5.2.
For each pixel in the image, the cluster numbers as generated from TM
r
and
TM
c
are compared. If the cluster numbers match, a counter, mcount, is incremented.
Finally, the classification accuracy is calculated using equation (5.2). This algorithm
is repeated N
r
times followed by calculating the average classification accuracy.
The clustering verification unit produces a binary image showing the
difference between the two thematic maps. This difference is represented as a white
colored pixel for each incorrectly classified pixel. Furthermore, the unit calculates an
accuracy percentage according to these differences.

143
mcount = 0 /* number of correctly classified pixels */
For each pixel
p
z do
k = cluster number as in TM
r
kk = cluster number as in TM
C
If k ≠ kk then
Mark
p
z as a white dot in the difference image
else
mcount = mcount + 1
Endif
Endloop
Classification accuracy = (mcount/N
p
).100 (5.2)
Figure 5.2: The clustering verification algorithm
5.2.2.2 Average Performance Analyzer Component
The average performance analyzer component verifies the average performance of
any clustering algorithm with reference to a set of images specified by the user (i.e. a
benchmark library). It calculates the average classification accuracy by running the
program a user-specified number of trials on each image in the library. In this regards,
the user should specify the following information:
•
Executable program name of the clustering algorithm.
•
Thematic map resulting from the clustering algorithm being examined (e.g. K-
means, FCM, etc.), TM
c
.
•
Number of trials to run the clustering program, N
r
.
144
Other information (e.g. the number of benchmarks, name of benchmark images,
reference thematic maps, etc.) should be specified in an input file called
SIGT_classifier_input.txt.
The clustering verification algorithm in section 5.2.2.1 is also used in this component.
The only difference is that the clustering program is applied to each image in the
benchmark library. Note that the tool deals only with raw format images. The next
section presents results obtained from SIGT to illustrate its features.
5.3 Experimental Results
This section shows how SIGT can be used to standardize the unsupervised image
classification verification process. For the sake of showing its applicability, two
clustering algorithms were used, namely K-means and PSO-based clustering
algorithms. The tool can generate 8-bit, flexible size images. A preliminary core of a
benchmark library consisting of ten synthetic images with different levels of
complexity and pixel intensity distribution were created. Table 5.1 shows user-
specified parameters used in generating the images. The first and second images were
generated such that they resemble very clear separated clusters. Therefore, it must be
very easy for most clustering techniques to determine these clusters with great
accuracy. The first image resembles a two-cluster image, while the second resembles
a three-cluster image. The third synthetic image was generated to be slightly more
difficult than the previous two in such a way that two of its three clusters are close to
each other. The fourth image has three clusters adjacent to each other. On the other
145
hand, the fifth image has one more cluster than the fourth. In fact, the fourth and fifth
images better approximate real-life images than the first three, which can only be
considered for functionality verification rather than competitance of different
clustering algorithms in early phases of algorithm creation. The remaining images are
the most complex among all, where different difficulty levels are introduced in such a
way that only competitive clustering algorithms will be able to efficiently cluster the
regions in the images. A large number of adjacent clusters of different probability
distributions were used in constructing these images.
For all the experiments, both K-means and gbest PSO-based clustering
algorithms (using equation (4.6)) were averaged over 30 trials for each image in the
benchmark library. The average classification accuracy and confidence interval (CI)
are calculated (see Table 5.2). For the PSO-based clustering algorithm, 50 particles
are used for 50 generations, w
1
= w
2
= 0.3 and w
3
= 0.4. The inertia weight, w, is set to
0.72, and c
1
= c
2
= 1.49. The velocities are clamped using V
max
= 255.
Using the clustering verification unit of SIGT, the thematic maps obtained
from both K-means and PSO clustering algorithms were compared with the thematic
maps generated by the synthetic image generation unit. The images representing the
difference in thematic maps are included in Table 5.2. The average classification
accuracy, calculated using equation (5.2), and the confidence interval of both
algorithms are included in Table 5.2 for each image.
It is observed that as the separation between adjacent clusters decreases, the
classification accuracy becomes lower. Note that the PSO-based clustering algorithm
performed better than K-means in all the cases except two (Image 8 and 10). The
rationale for the poor performance of the PSO-based clustering algorithm when
applied to Image 10 is the choice of w
1
, w
2
and w
3
. When the PSO-based clustering
146
algorithm was applied to Image 10 using w
1
= w
2
= 0 and w
3
= 1 (i.e. making the PSO
fitness function similar to the objective function of K-means) the average
classification accuracy significantly improved to reach 80.44% ± 7.411 with CI =
[74.214, 86.674].
From the overall average performance, it can be concluded that the PSO-based
clustering algorithm is in general better than the K-means clustering algorithm which
verifies the results of chapter 4. To be able to make such a conclusion is one of the
main benefits of SIGT.
Although the synthetic images represent no visually appealing shape, their
histograms represent exactly what the user intends to test. The rationale behind this is
that a clustering algorithm generally clusters pixels in a spectral domain (as
represented in the histogram) rather than a spatial domain (as represented by the
image shape). Therefore, the shape is generally not used, but rather the image
histogram. However, in image segmentation the spatial information is important as
already discussed in Section 3.2.
5.4 Conclusions
A new tool for synthetic image generation (SIGT) was proposed and implemented.
The tool consists of two units: a synthetic image generator and a clustering
verification unit. The first unit allows the user to create a synthetic image based on a
user-specified histogram suitable for the required application. The second unit allows
the user to measure the efficiency of a clustering algorithm. The main purpose of
SIGT was to provide a simple and easy tool to generate synthetic images that can be
used as benchmarks and to conduct a preliminary test on a clustering algorithm in
147
order to measure its performance and compare it with other clustering algorithms.
Different features of SIGT were demonstrated by a set of experiments aided by a
well-known clustering algorithm (K-means) and the recent PSO-based clustering
algorithm. These experiments have shown that the tool can be used to generate a
synthetic image based on a user-specified histogram, measure the quality of any
clustering algorithm, and create benchmarks.
After showing the potential of PSO as a clustering algorithm and proposing a
tool that can aid in evaluating the efficiency of a clustering algorithm, the next chapter
will address the difficult problem of determining the "optimal" number of clusters in a
data set.

148
Table 5.1: Synthetic image details and classification
accuracy
Benchmark
No.
K
% of each cluster
(
k
C
′
)
Cluster
distribution (p
k
)
1 2 1 (50%)
2 (50%)
1 (Binomial)
2 (Binomial)
2 3 1 (34%)
2 (33%)
3 (33%)
1 (Binomial)
2 (Geometric)
3 (Poisson)
3 3 1 (40%)
2 (20%)
3 (40%)
1 (Uniform)
2 (Uniform)
3 (Binomial)
4 3 1 (40%)
2 (20%)
3 (40%)
1 (Uniform)
2 (Uniform)
3 (Uniform)
5 4 1 (30%)
2 (20%)
3 (30%)
4 (20%)
1 (Uniform)
2 (Uniform)
3 (Uniform)
4 (Poisson)
6 10 1 (10%)
2 (5%)
3 (10%)
4 (10%)
5 (5%)
6 (10%)
7 (15%)
8 (10%)
9 (10 %)
10 (15%)
1 (Uniform)
2 (Uniform)
3 (Uniform)
4 (Poisson)
5 (Uniform)
6 (Binomial)
7 (Geometric)
8 (Uniform)
9 (Poisson)
10 (Binomial)
7 6 1 (20%)
2 (20%)
3 (15%)
4 (30%)
5 (5%)
6 (10%)
1 (Poisson)
2 (Binomial)
3 (Uniform)
4 (Uniform)
5 (Uniform)
6 (Uniform)
8 4 1 (25%)
2 (25%)
3 (25%)
4 (25%)
1 (Geometric)
2 (Binomial)
3 (Binomial)
4 (Uniform)
9 7 1 (20%)
2 (10%)
3 (35%)
4 (5%)
5 (15%)
6 (15%)
7 (10%)
1 (Uniform)
2 (Uniform)
3 (Uniform)
4 (Uniform)
5 (Uniform)
6 (Uniform)
7 (Binomial)
10 4 1 (25%)
2 (25%)
3 (25%)
4 (25%)
1 (Poisson)
2 (Binomial)
3 (Uniform)
4 (Uniform)
149
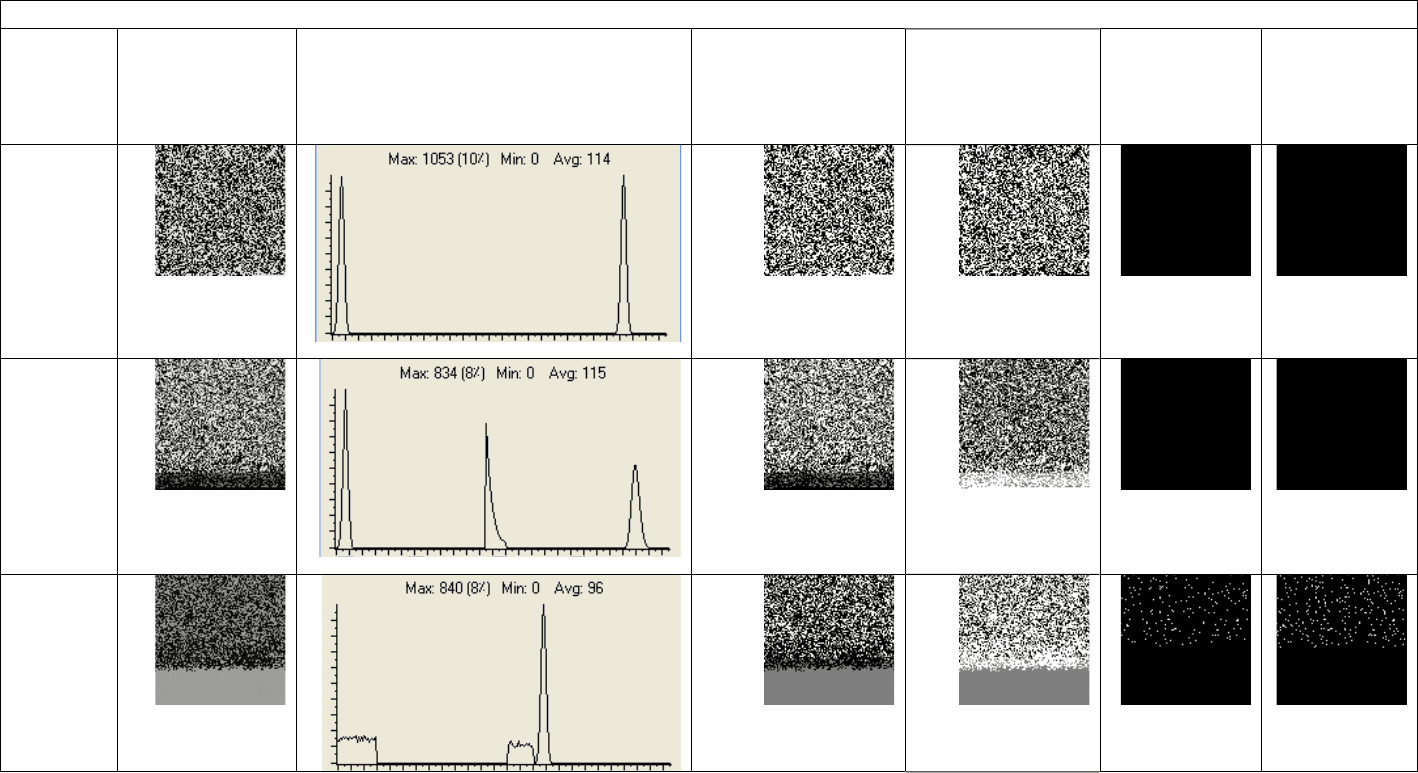
Table 5.2: Synthetic images, Histograms and Thematic Maps
Bench
Mark No.
Synthetic Image Histogram
K-Means Sample TM
c
(Avg. Classification
Accuracy
±SD
a
)
[CI]
PSO Sample TM
c
(Avg. Classification
Accuracy
±SD)
[CI]
Best K-Means
TM Difference
(Best
Classification
Accuracy)
Best PSO TM
Difference
(Best
Classification
Accuracy)
1
100%±0
[100, 100]
100%±0
[100, 100]
(100%)
(100%)
2
100%±0
[100, 100]
100%±0
[100, 100]
(100%)
(100%)
3
79.58%±18.672
[72.901, 86.265]
96.49%±0.491
[96.310, 96.662]
(98.25%)
(97.30%)
a
SD stands for standard deviation