Orton C., Tyers P., Vince A. Pottery in archaeology
Подождите немного. Документ загружается.

Seriation
189
Bringing the evidence together
Associations between pottery and other datable artefacts provide another
potential source of evidence. Coins are probably the most common class of
such objects and (when they can be dated reliably) certainly provide a
terminus
post quern for the deposition of an assemblage and hence the final
deposition of any pottery it contains. However, the dating of archaeological
levels from coins is not without difficulty and such data must be used with
great caution.
The key point is the degree of association between a pot and its external
dating evidence. An example of tight association is that of a coin hoard
buried in a pot. Unless an heirloom has been used, or the hoard represents
savings accumulated over a long period in the same pot, there
is
likely to be a
very close agreement between the date of the pot and that of the hoard, and
such evidence can be very valuable (Bird and Turner 1974). On the other
hand, the casual association of a pot, or perhaps just a sherd, with a coin in a
soil horizon is not likely to give useful information. Either or both may be
residual (p. 168), perhaps by hundreds of years.
Between these two extremes comes the association of pottery with dated
structures. Sometimes a close association can be argued. For example, in the
case of the London waterfronts (p. 168), the stability of the dated timber
structures relied on the infilling dumps behind them, which must therefore be
contemporary. The question that remains is - how long was the pottery
deposited as rubbish (for example in a midden) before that dump was used to
infill
the waterfront? Here comparison of the wares present, together with the
degree of breakage (p. 178) and of abrasion (p. 214) can help us. We can
contrast this situation with one in which the
filling
may have occurred slowly
over a long period. For example, a documented date for the digging of a
castle moat may tell us little (except a
terminus
post
quern)
of the date of the
pottery found in that moat.
Problems with ceramic dates certainly arise when the independently-dated
elements are sparse and greater reliance is placed on chains of associations
where little or no dating evidence is available. The danger of circular argu-
ment becomes acute, perhaps particularly when fine chronological divisions
are being attempted. In addition, assumptions (often unstated) are usually
made about factors such as the residuality of the material, which should more
properly appear on a list of questions to be answered.
Seriation
A
more formal approach is to try to order assemblages of types of pottery on
the basis of the co-occurrences either of types in assemblages or of character-
istics on types, the former being the more common. Assemblages which are
similar to each other, in terms of the types present in them, may be close
chronologically; conversely, types which commonly co-occur should have
190 Chronology
broadly similar date-ranges. The occurrence of types in assemblages can be
described either in terms of their presence/absence, as used originally by
Petrie (p. 11), or in terms of proportions using an appropriate measure
(p. 168).
The principal technique for simultaneously ordering assemblages and
pottery types is seriation. We have already seen how such techniques devel-
oped out of Petrie's work at the end of the nineteenth century. Whether
performed manually or by a computer program, the aim is to recreate as far
as possible for each type the ideal pattern described above, while using as
much or as little additional information (for example stratigraphy) as may be
available. The basic idea is contained in Petrie's Concentration Principle:'if
the typology is 'chronologically significant', and when the graves have been
correctly ordered, then the 'sequence-date'-rawges for the individual types
will be found to have been individually or in some communal way minimised.'
(Kendall 1971, 217), although it should be remembered that Petrie's work
was on presence/absence, not quantified, data.
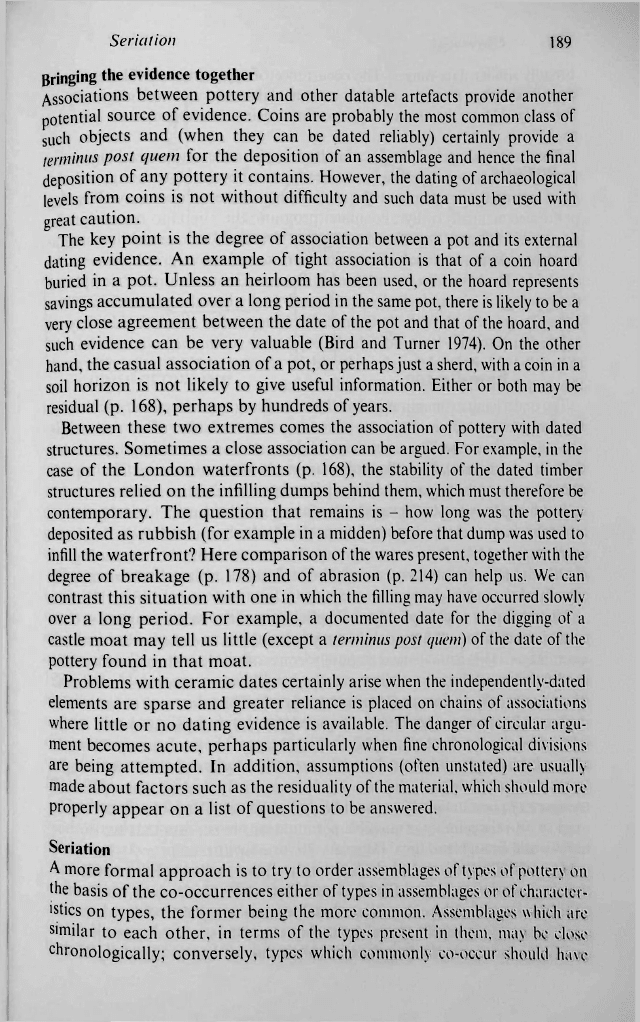
The underlying assumption is that the use of any type of pottery follows a
regular pattern of not in use—»increasing use—»steady use—»decreasing
use—»no longer in use. The exact shape of this pattern is not critical, provided
there are no catastrophic collapses in usage. It does not matter if a type is
already in use at the beginning of a period to be studied, or is still in use at the
end, although a type which meets both of these conditions will be of little use
in establishing a chronology and is probably best omitted from such an
analysis (fig. 14.4). It is not necessary to assume that the chronological
distribution of a type follows a normal distribution, although there may be
superficial similarities.
All techniques rely, explicitly or implicitly, on the setting up of a data
matrix in which (usually) the columns represent types and the rows represent
assemblages. This arrangement is purely conventional, and may reflect the
need for some computer programs to work with more rows than columns
(there are usually more assemblages than types). The rows and columns are
then re-ordered (or sorted) until the required pattern emerges (if indeed it was
inherent in the data in the first place, which it may not have been). This is a
trial-and-error approach, and there is no reason why it should have a single
'best' order, or if there is, that we should necessarily find it. The option of
trying every permutation of rows and columns to see if it is the 'best' is not
open to us - the number of possible permutations is so vast that we do not
have 'world enough and time' (Marvell, To his coy mistress).
Manual techniques, such as the 'battleship curve' method (Ford 1962) and
the close-proximity method (Renfrew and Sterud 1969) are best used when
either the amount of data is small or when there are many external constraints
(such as stratigraphy). The term 'battleship curve' has caused some puzzle-
ment as to its origins. We have been told it is due to: (i) the similarity of the
Sedation
191
d>
o
c
03
"O
c
ZJ
.Q
(0
uninformative not allowed
Fig. 14.4. Possible patterns for the production of pottery types: (upper) suitable for use in
seriation; (lower left) usable but uninformative; (lower right) not suitable for use in seriation
ideal pattern of the occurrences of a single type to the view of a battleship
seen in plan; and (ii) to a supposed parallel between the drawing of the
percentage charts by blacking-in squares on graph paper to the children's
game of battleships, in which the warring fleets are represented in a similar
way.
Computer techniques, several of which are now available (Fletcher and
Lock 1991,145-76) are essential when there are many data, but have
difficul-
ties
in coping with external constraints. There is a need for a technique which
can deal with large amounts of data and serious but not overwhelming
constraints; Bayesian statistics may be the best way forward (Buck and Litton
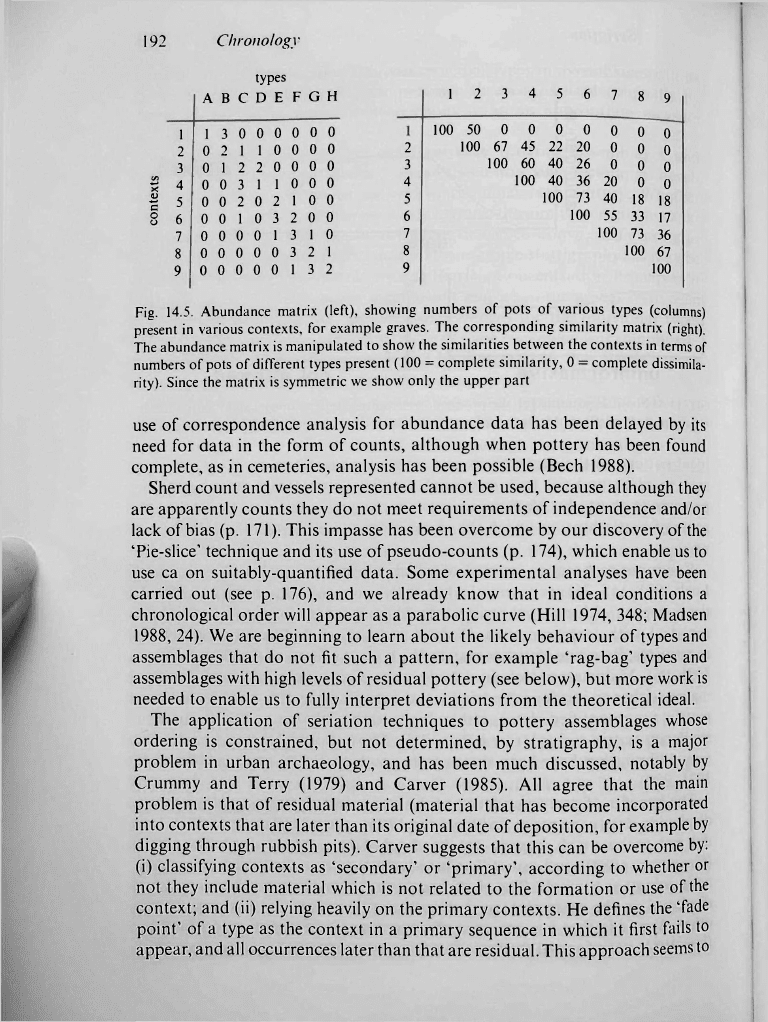
1991, 96). Mainstream techniques rely on explicit manipulation of the data
matrix (either an incidence matrix for presence/absence data or an abundance
matrix for quantified data), either in its own right or in the form of a
similarity matrix derived from it
(fig.
14.5). These approaches are superficially
I very different but have been shown to be mathematically identical (Kendall
1971,, 220).
The benefits of correspondence analysis as a technique for exploring and
displaying data were promoted from the 1960s onwards (Benzecri 1973), but
did not make much impact on the Anglo-Saxon world until the 1980s
(Greenacre 1984), and are still relatively little-known in British/American
archaeology as a whole. The chief benefit is that rows and columns can be
displayed on the same plot, so that each can be interpreted in terms of the
other. Versions that use presence/absence data (for example 'model C in
Ihm, 1981) have formed the basis for seriation programs lor some time. The
allowed
192 Chronology
types
ABCDEFGH 1 2 3 4 5 6 7 8 9
| 5 00202100
8 6 00103200
7 0 0 0 0 1 3 1 0
8 00000321
9 0 0 0 0 0 1 3 2
| 4 00311000
1 1 3 0 0 0 0 0 0
2 0 2 1 1 0 0 0 0
3 0 1 2 2 0 0 0 0
9
8
5
6
7
4
2
3
100 50 0 0 0 0 0 0 0
100 67 45 22 20 0 0 Q
100 60 40 26 0 0 0
100 40 36 20 0 0
100 73 40 18 18
100 55 33 17
100 73 36
100 67
100
Fig. 14.5. Abundance matrix (left), showing numbers of pots of various types (columns)
present in various contexts, for example graves. The corresponding similarity matrix (right).
The abundance matrix is manipulated to show the similarities between the contexts in terms of
numbers of pots of different types present (100 = complete similarity, 0 = complete dissimila-
rity). Since the matrix is symmetric we show only the upper part
use of correspondence analysis for abundance data has been delayed by its
need for data in the form of counts, although when pottery has been found
complete, as in cemeteries, analysis has been possible (Bech 1988).
Sherd count and vessels represented cannot be used, because although they
are apparently counts they do not meet requirements of independence and/or
lack of bias (p. 171). This impasse has been overcome by our discovery of the
'Pie-slice' technique and its use of pseudo-counts (p. 174), which enable us to
use ca on suitably-quantified data. Some experimental analyses have been
carried out (see p. 176), and we already know that in ideal conditions a
chronological order will appear as a parabolic curve (Hill 1974, 348; Madsen
1988, 24). We are beginning to learn about the likely behaviour of types and
assemblages that do not fit such a pattern, for example 'rag-bag' types and
assemblages with high levels of residual pottery (see below), but more work is
needed to enable us to fully interpret deviations from the theoretical ideal.
The application of seriation techniques to pottery assemblages whose
ordering is constrained, but not determined, by stratigraphy, is a major
problem in urban archaeology, and has been much discussed, notably by
Crummy and Terry (1979) and Carver (1985). All agree that the main
problem is that of residual material (material that has become incorporated
into contexts that are later than its original date of deposition, for example by
digging through rubbish pits). Carver suggests that this can be overcome by:
(i) classifying contexts as 'secondary' or 'primary', according to whether or
not they include material which is not related to the formation or use of the
context; and (ii) relying heavily on the primary contexts. He defines the 'fade
point' of a type as the context in a primary sequence in which it first fails to
appear, and all occurrences later than that are residual. This approach seems to
\
щ
s ТгТ
Я os
BS
їй о
JC
с
а —
2-а
йО
u
ai
U -О
м
СЯ
!•»
I s
00 _c
s »
'та
,2
в
о о
с л
8 g
'S g
jö й
H
a «s
Й s
.
A
vO
a»
-sr" ,S5
Чиарроу iBJauaj)
jatïnoa S
194 Chronology
be at risk of circular argument, unless one can be sure which contexts are
primary, and it fails to tackle the problem of sample size and the functional
variation between assemblages from primary contexts. Crummy and Terry
(1979, 54-5) make some suggestions for what they call 'class V contexts* but
say that they will be few on an urban site, while Millett and Graham (1986,9)
admit that they could not distinguish such contexts. We prefer an approach
based on comparison of the parameters of different types in an assemblage,
for example their brokenness and state of abrasion (p. 214).
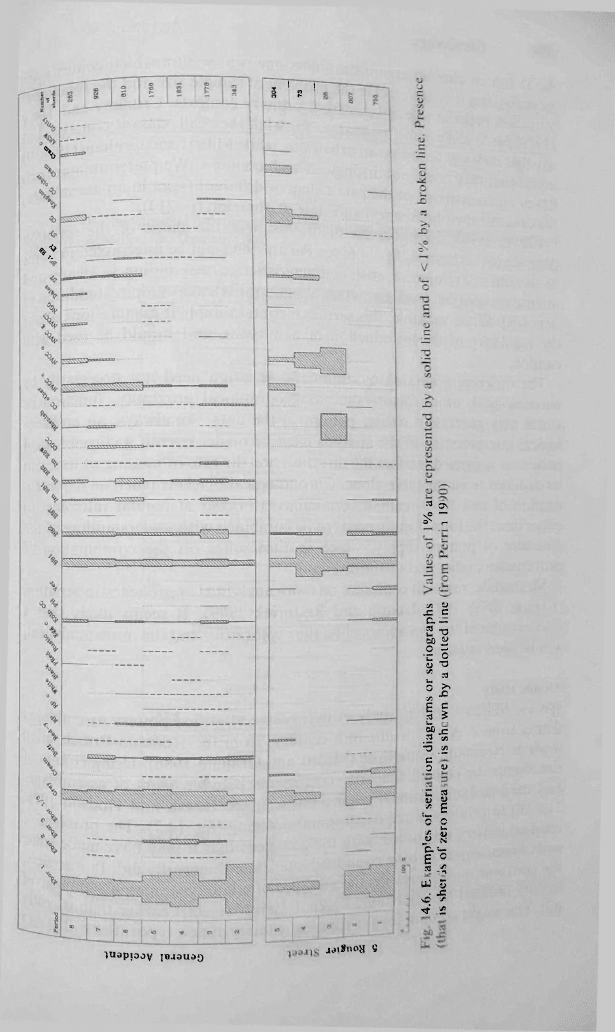
Carver (1985, 360) goes on to discuss how the shape of the seriation
diagram (or
seriography
fig. 14.6; see Perrin 1990) can be interpreted in terms
of the site's development, with characteristics corresponding to steady and
intense occupation, levelling (removal of deposits) and dumping (addition of
deposits). While valuable, this seems to contain implicit assumptions about
the regularity of the introduction of new types, and should be used with
caution.
The ordering generated by automatic seriation need not necessarily be
chronological; other factors such as geographical proximity, function or
status may generate a similar pattern in the data. As always, an archaeo-
logical interpretation of the analysis must be made. Even if a chronological
pattern is suspected, neither the direction nor the rate of passing of time can
be deduced from the table alone. Chronological markets (such as the intro-
duction of new types) cannot be assumed to occur at regular intervals. In
either case, the formal study needs to be combined with understanding of the
structure of pottery supply, which in turn relies on the combination of
provenance studies and quantified data.
Meanwhile, research continues on more analytical approaches to seriation
(Laxton 1976; 1987; Laxton and Restorick 1989). It seems likely that a
combination of the two approaches, the exploratory and the more analytical,
will be used in future.
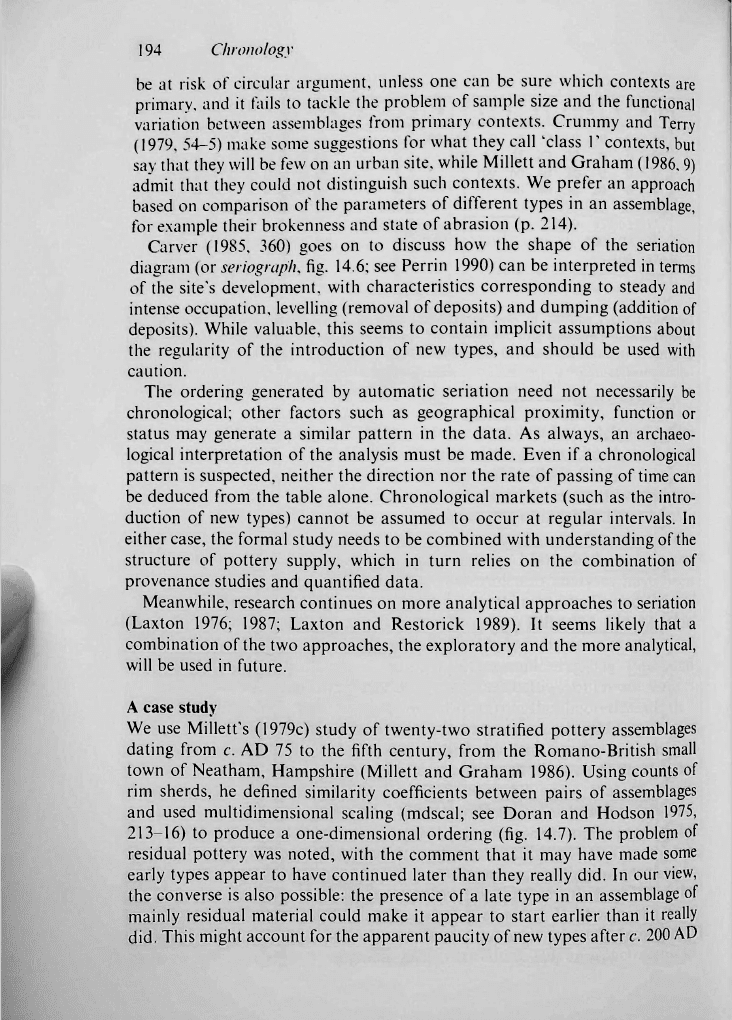
A case study
We use Millett's (1979c) study of twenty-two stratified pottery assemblages
dating from c. AD 75 to the fifth century, from the Romano-British small
town of Neatham, Hampshire (Millett and Graham 1986). Using counts of
rim sherds, he defined similarity coefficients between pairs of assemblages
and used multidimensional scaling (mdscal; see Doran and Hodson 1975,
213-16) to produce a one-dimensional ordering (fig. 14.7). The problem of
residual pottery was noted, with the comment that it may have made some
early types appear to have continued later than they really did. In our view,
the converse is also possible: the presence of a late type in an assemblage of
mainly residual material could make it appear to start earlier than it really
did. This might account for the apparent paucity of new types after
c.
200 AD
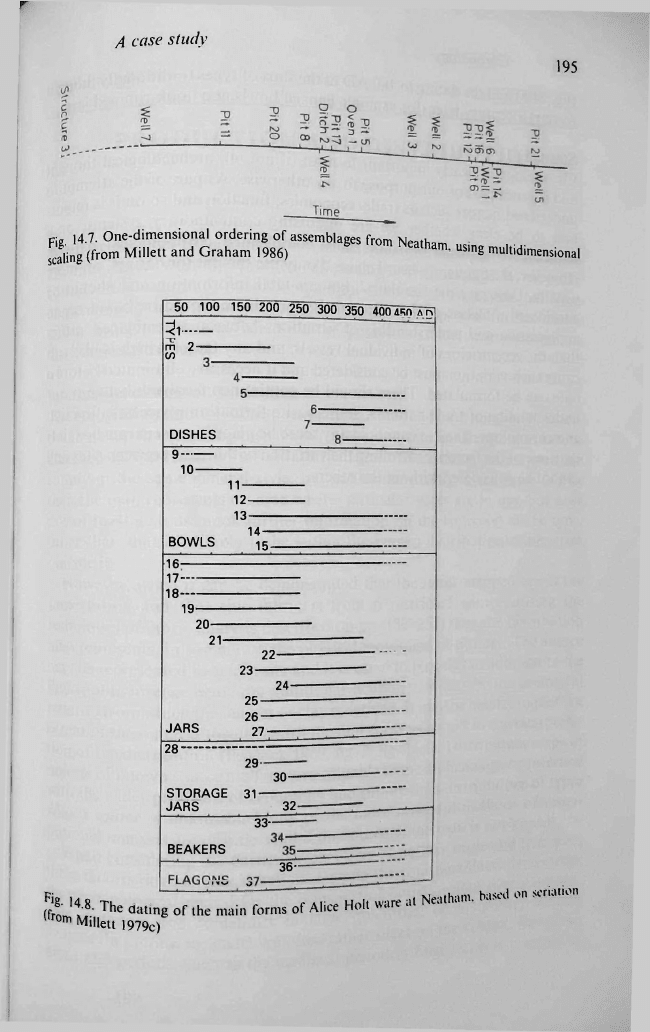
A case study
F
ig. 14 7 One-dimensional ordering of assemblages from Neatham
scaling (from Millett and Graham 1986) Neatham,
195
using multidimensional
50 100 150 2Off 250 300 3b0 400dsn at?
m
m 2-
en
DISHES
9——
10
11-
12-
13-
BOWLS
14-
15-
16—
1 7
1 8
19"-
20-
21-
22-
23-
24-
JARS
25-
26-
27-
28
29-
30-
STORAGE 31-
JARS
32-
33-
BEAKERS
36-
fa'
The
of,he S
forms
of
Alice
Ho.,
ware a,
|gg —
wrom Vfjii , _
°
Millett 1979c)
196 Chronology
(fig. 14.8) and the dating to 180 AD of the start of types traditionally thought
to start a century later (for example flanged bowls and hook-rimmed jars).
Summary
Chronology is clearly important to most (if not all) archaeological thought
and it is not part of our purpose to say otherwise. As part of the attempt to
understand factors such as trade, economics, function and so on it is impor-
tant to be clear whether we are discussing contemporary systems, or a
sequence of systems, or some more complicated chronological pattern.
However, the frequently-heard claim 'I only use the pot for dating', or, more
usually, 'Just give me the dates', ignores vital information and should be
considered a misuse of the material. Pottery dates should be based on an
appreciation and understanding of variations between assemblages, rather
than the eccentricities of individual vessels, and any factor which is likely to
cause such variation must be considered and if necessary eliminated before a
date can be formulated. There should be continuous feedback between our
understanding of trade-patterns, sources, site formation processes, function
and chronology. The last cannot in any sense be placed in a separate box; it
is
only one of the factors controlling the variation within and between sites and
cannot be considered without the others.
17
PRODUCTION AND DISTRIBUTION
When we consider the significance of an assemblage from a particular site we
are then faced with the problem of placing the assemblage in its wider
context. It is natural to try to compare the site's assemblage with that from
contemporary sites in the immediate area, and perhaps also further afield,
which brings us face-to-face with the problems of the interpretation of
distributional evidence.
Information content of distribution
The recognition that the same pottery types are found on a number of
sites
is
the first step in compiling distribution maps, but the significance that can be
attached to the result is not always the same. When the types mapped are
simply in the same general style, but not demonstrably in the same fabric,
then the map represents an area where particular types are in use, but does
not of itself give us much further information on the source(s) of the type,
other than that it is likely to be within the known distribution rather than
outside it.
However, when it can be demonstrated that the items mapped are in the
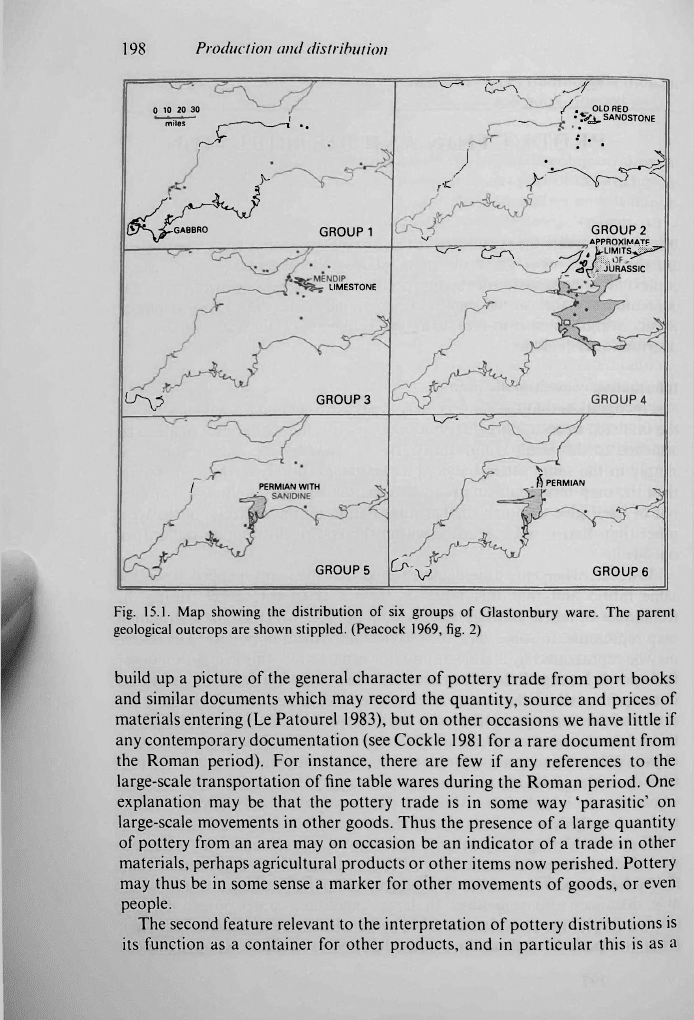
same fabric and that this fabric is from a restricted source, (using the
techniques of fabric analysis described on pp. 132-151) then the distribution
map represents, in some way, the physical movement of
pottery.
The source
may be represented by a kiln site and it is usual to plot this in addition to the
find spot (a lozenge being the traditional symbol) or it may be the geological
outcrop from which the temper or clay is derived. It may be
helpful
to plot the
extent of the outcrop together with the find spots as an aid to the interpreta-
tion of the distribution (Peacock 1969, fig. 2; fig. 15.1). Distribution maps of
objects of known source are far more valuable to the archaeologist concerned
with the wider problems of economics and supply than distributions of types
whose source is unknown. Many of the more powerful methods of distri-
butional analysis are of little avail if the source of the item is not known.
When considering the particular problems of pottery trade and transport
three factors deserve consideration. Despite the considerable evidence from
the archaeological record for the transport of pottery, often over consider-
able distances and sometimes in large quantities, contemporary written
sources (in literate societies) are often rather silent on the subject. For some
areas and periods, such as the medieval period in England, it is possible to
197
198 Production and distribution
0 10 20 30
miles j
.
j
rJf
ypf^S
P^aii GROUP 1
^ С^л - -j
/. OLD RED
—'^SANDSTONE
f • .
J -J^^
GROUP 2
Ш APPRnVIMATB
UMESTONE
УЩф GROUP 3
JgSg ^STl ^t'MITS^^T
y^P^&RASSIC
1
PERMIAN WITH
GROUP 5
V*-
Jk
PERMIAN
^V GROUP 6
Fig. 15.1. Map showing the distribution of six groups of Glastonbury ware. The parent
geological outcrops are shown stippled. (Peacock 1969, fig. 2)
build up a picture of the general character of pottery trade from port books
and similar documents which may record the quantity, source and prices of
materials entering (Le Patourel 1983), but on other occasions we have little if
any contemporary documentation (see Cockle 1981 for a rare document from
the Roman period). For instance, there are few if any references to the
large-scale transportation of fine table wares during the Roman period. One
explanation may be that the pottery trade is in some way 'parasitic' on
large-scale movements in other goods. Thus the presence of a large quantity
of pottery from an area may on occasion be an indicator of a trade in other
materials, perhaps agricultural products or other items now perished. Pottery
may thus be in some sense a marker for other movements of goods, or even
people.
The second feature relevant to the interpretation of pottery distributions is
its function as a container for other products, and in particular this is as a