Pavlidis I. (ed.) Human-Computer Interaction
Подождите немного. Документ загружается.

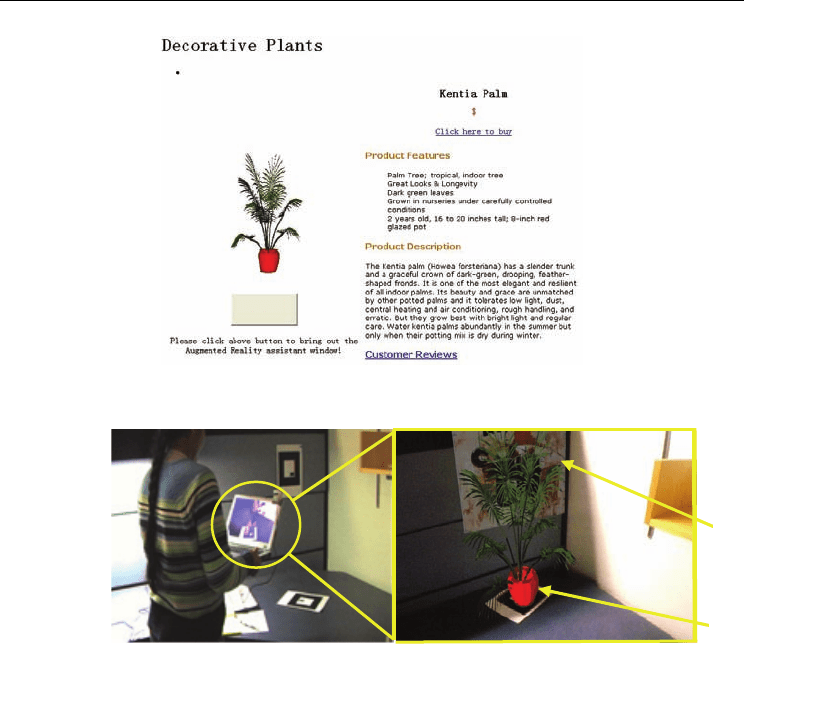
Augmented Reality E-Commerce: How the Technology Benefits People's Lives
223
Fig. 9. AR e-commerce interface
4.1. Experiment Design
Based on a pilot user study for home furniture products (Lu and Smith, 2006), a formal user
study was designed and conducted to test the usability of the developed AR e-commerce
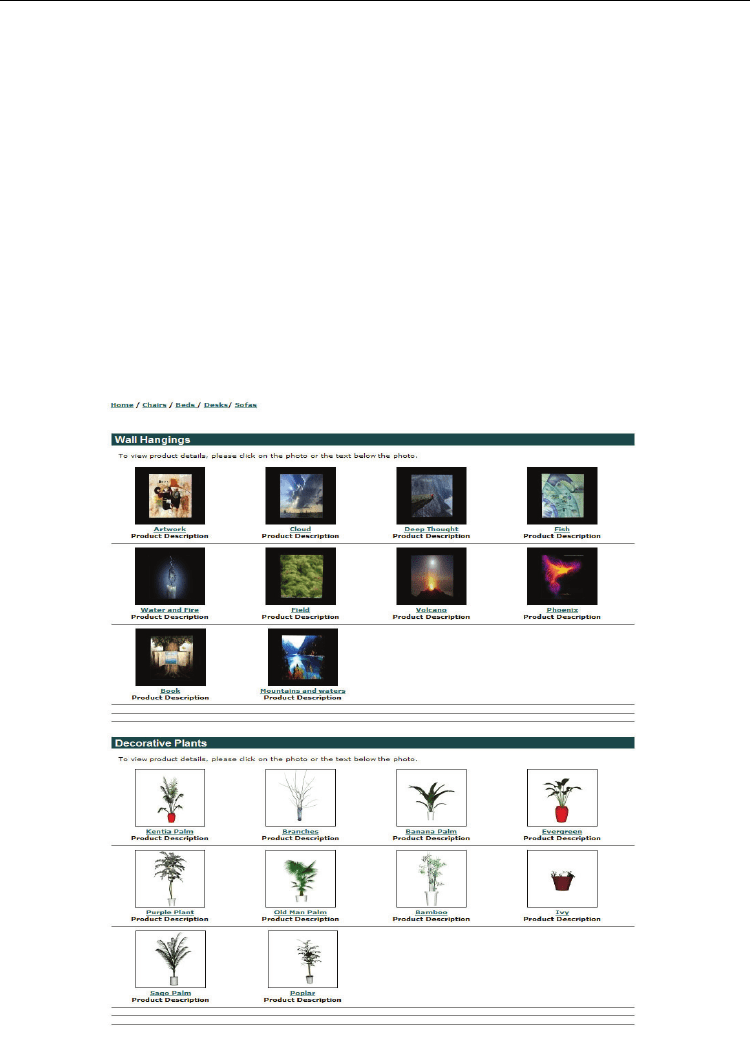
system. In the full study, different types of e-commerce web pages were designed for office
products (wall hangings and decorative plants) to avoid product-based bias, as shown in
Figure 11.
The experiment was designed as within-subjects for types of e-commerce, so that each
subject accessed all three e-commerce systems because subjects inevitably differ from one
another. In between-subject designs, these differences among subjects are uncontrolled and
are treated as error. In within-subject designs, the same subjects are tested in each condition.
Therefore, differences among subjects can be measured and separated from error (Howell
2007). Removing variance due to differences between subjects from the error variance
greatly increases the power of significance tests. Therefore, within-subjects designs are
almost always more powerful than between-subject designs. Since power is such an
important consideration in the design of experiments, this study was designed as a within-
(
a
)
AR
(b) AR scene on computer
Virtual wall
hanging
Virtual
plant
Fi
g
. 10. AR application runnin
g
on a laptop computer
Human-Computer Interaction
224
subjects experiment to compare user’s subjective satisfaction level of using the three
different types of e-commerce systems. As a result, by design, different participants’ rating
standards should not affect the comparisons.
Tests were carried out with six volunteer participants in each of the four office
environments. In total, twenty-four participants were tested in the experiment. At the
beginning of the experiment, participants were trained to use the three types of e-commerce
systems. During the experiment, real-time help concerning how to use the systems was also
provided. In the test, participants were asked to use the three types of e-commerce systems
to buy different office products for the different environments, without considering budget.
Users were asked to select wall hangings and decorative plants and then compare the three
types of e-commerce systems. During the experiment, the process was recorded and
observed. After the experiment, participants were asked to fill out a questionnaire and to
give their evaluations of usability. Four main variables (overall evaluation, information
provided, ease of use, and confidence level in the final decision) were measured for each
type of e-commerce system for each participant.
Fig. 11. Office products

Augmented Reality E-Commerce: How the Technology Benefits People's Lives
225
In the study, the independent variables were the three different types of e-commerce
systems, four different environments (an open space office, a cubicle, a single-user single-
room office, and a multi-user single-room shared office). Within each environment,
presentation of the e-commerce systems was systematically varied to control the
“carryover” effects of a within-subjects design. Since we assigned 6 subjects to each
environment, we were able to test all possible presentation orders of the three e-commerce
systems (3 choose 1 * 2 choose 1 * 1 choose 1) = 6 different testing orders: (T, VR, AR), (T,
AR, VR), (VR, T, AR), (VR, AR, T), (AR, T, VR), and (AR, VR, T). The dependent variables in
the research question were four main variables: overall evaluation, information provided,
ease of use, and confidence level in the final decision.
To test whether the usability results were affected by experience order, the six user study
participants in each of the four environments were randomly assigned to one of the six
orders. Evaluations of the four main variables were also compared for the different orders.
The formal study addressed the following hypotheses:
• Hypothesis 1: The overall evaluation and satisfaction level of using the AR e-commerce
system is higher than using the other two e-commerce systems.
• Hypothesis 2: The AR e-commerce system provides more visualization information to
online shoppers than the other two e-commerce systems.
• Hypothesis 3: The ease of use rating for the AR e-commerce system is lower than the
other two e-commerce systems.
• Hypothesis 4: Users of the AR e-commerce system have a higher confidence level in their
final decision than users of the other two e-commerce systems.
• Hypothesis 5: User performance in the different e-commerce systems is not affected by
locations.
To test the 5 hypotheses, different ratings given by the participants, after using the three
types of e-commerce systems, were compared.
4.2. Experiment Participants
All participants for the study were individuals from Iowa State University who responded
to an invitation email. They represented students, staff, and faculty. Figure 12. shows the
composition of subjects for the study.
Figure 12. shows that the gender of participants was equally distributed. Since most of the
participants were students, the age distribution of participants was skewed toward lower
age groups, and computer experience level was skewed toward high levels (“A little” mean
little computer experience while “Pro” means professional computer experience), which
might have caused some sample bias.
Gender
Gender
MaleFemale
Frequency
14
12
10
8
6
4
2
0
50% 50%
Age
Age
>3632-3627-3122-26
Frequency
12
10
8
6
4
2
0
29.1%
41.7%
12.5%
16.7%
Human-Computer Interaction
226
Computer Experience
Computer Experience
ProA LotAvgA Little
Frequency
12
10
8
6
4
2
0
4.2%
29.1%
41.7%
25%
Online Shoppng frequency
Online Shoppng frequency
>OftenOftenAvgA LittleNo
Frequency
12
10
8
6
4
2
0
4.2%
29.1%
41.7%
20.8%
4.2%
Fig. 12. Participants’ self description
4.3 Results
4.3.1 Overall Evaluation
The first research question in the questionnaire was designed to capture overall feelings
about the three different types of e-commerce systems, without being affected or guided by
later questions. The participants’ overall evaluations are listed in Table 1, by locations and
by experience orders, which were also separately tested using Factorial ANOVA.
PARTICIPANT RATING LOCATION SUBJECTS
T VR AR
1
2
4
5
2
1
5
5
3
1
3
4
4
2
3
5
5
1
3
4
6
2
4
5
Open space
office (1)
Mean/Std. Dev 1.5/0.548
3.667/0.816
4.667/0.516
7
3
5
4
8
2
5
4
9
2
3
4
10
1
5
5
11
3
4
5
12
1
3
5
Cubicle office
(2)
Mean/Std. Dev 2/0.894
4.167/0.983
4.5/0.548
13
3
5
5
14
1
3
5
15
3
3
5
16
5
4
4
17
1
3
5
18
1
3
5
Single-user
single-room
office (3)
Mean/Std. Dev
2.333/1.633
3.5/0.837
4.833/0.408
Augmented Reality E-Commerce: How the Technology Benefits People's Lives
227
19
3
4
5
20
3
4
5
21
2
3
4
22
1
2
4
23
3
4
4
24
5
5
4
Multi-user
single-room
shared office
(4)
Mean/Std. Dev
2.833/1.329
3.667/1.033
4.333/0.516
Mean
2.167
3.75
4.583
Std. Dev.
1.204
0.897
0.504
Table 1. Overall evaluation (1=lowest 5=highest)
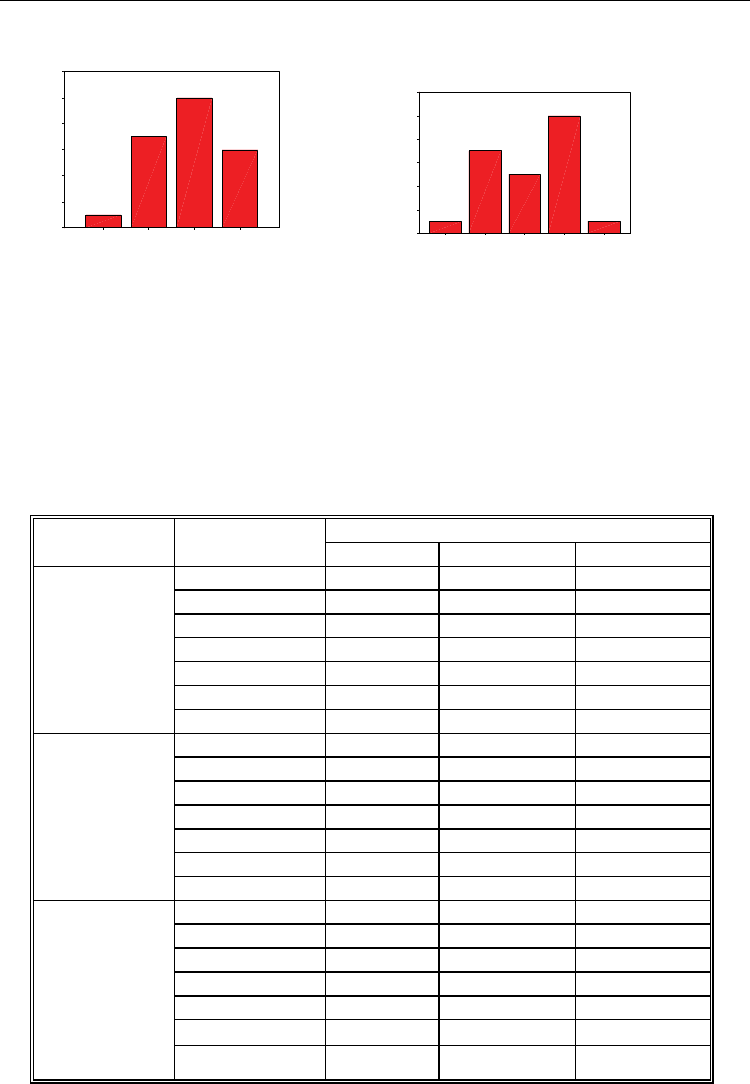
As shown in Table 1., the mean overall evaluation for traditional e-commerce was 2.167, the
mean overall evaluation for VR enhanced e-commerce was 3.75, and the mean overall
evaluation for AR enhanced e-commerce was 4.583. As shown in the between-subjects
effects and within-subjects effects analysis of Table 2., the p-value for the effect of the type of
e-commerce system is very small (<0.05), which indicates that there is a statistically
significant difference in mean overall evaluations between the three types of e-commerce
systems. In contrast, the p-values for the effect of location is 0.7913, which indicates that
there is no statistically significant difference in mean overall evaluations for different
locations.
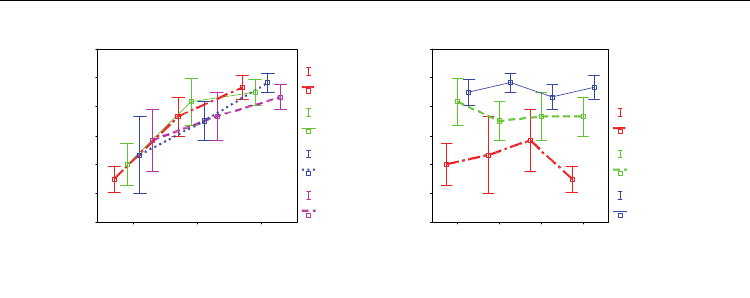
Figures 13., clearly shows that the main effect for different types of e-commerce systems is
obvious and that the overall evaluation for the AR e-commerce system is higher than the
ratings for the traditional and VR e-commerce systems. The p-value for interaction between
types and locations is 0.1407, which indicates that there are no statistically significant
interaction effects for types and locations. Thus, interaction effects, and location effects were
neglected in the refined analysis model shown in Table 3.
SOURCE DF SUM OF SQUARES MEAN SQUARE F SIG.
Location 3 1.2222 .4074 .3476 .7913
Error 20 23.4444 1.1722
Type 2 72.3333 36.1667 55.1695** .000**
Location*Type 6 6.7778 1.1296 1.7232 .1407
Error 40 26.2222 .6556
**p<0.05
Table 2. Tests of Between-Subjects Effects and Within-Subjects Effects (Dependent Variable:
Overall evaluation)
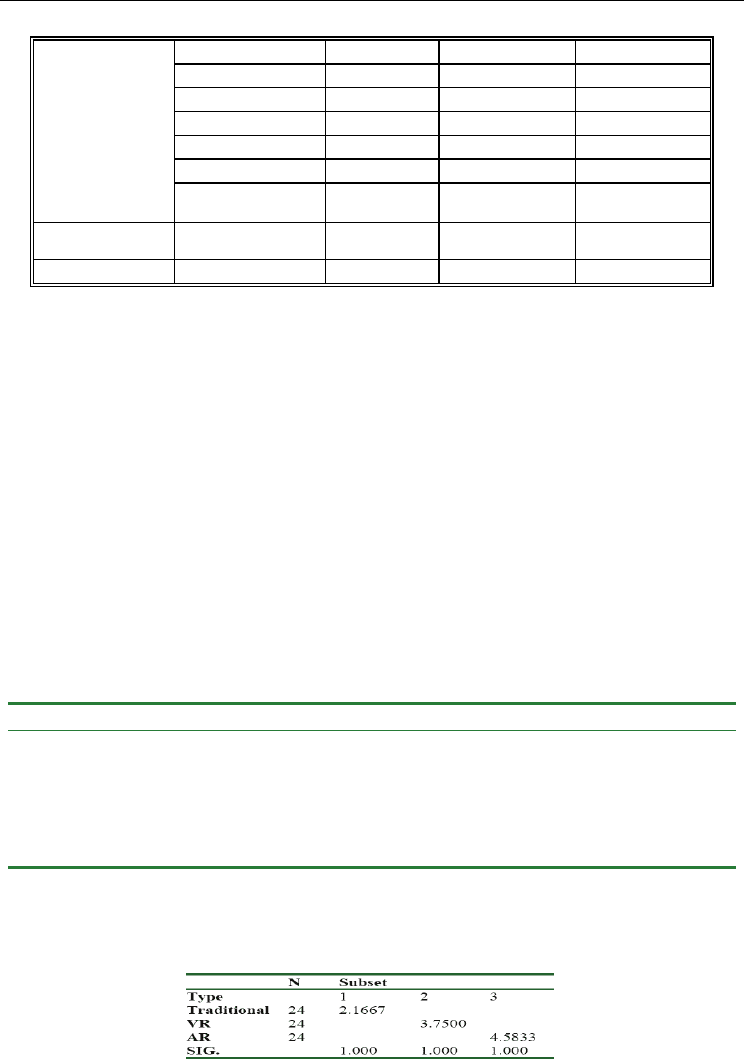
Table 3. Homogeneous Subsets Tukey HSD (Dependent Variable: Overall evaluation)
Human-Computer Interaction
228
666666666666N =
Type
ARVRTraditional
Mean +- 2 SE Overall Evaluation
6
5
4
3
2
1
0
Location
1.00
2.00
3.00
4.00
666666666666N =
Location
1.004.003.002.00
Mean +- 2 SE Overall Evaluation
6
5
4
3
2
1
0
Type
Traditional
VR
AR
Fig. 13. Interaction between type and location for Overall evaluation
To determine differences in overall evaluations for the three types of e-commerce systems, multiple
mean comparisons (Tukey HSD) was used. The analysis results in Table 3. show that each pair of
mean overall evaluations for the three types is significantly different.
In comparing the three e-commerce systems, the AR enhanced e-commerce was rated highest by
users, which indicates that users preferred the AR enhanced e-commerce system more than the other
two for office decoration. Therefore, research hypothesis 1 is accepted. Based on the strength and
weakness of AR e-commerce compared to the other two types of e-commerce, customers still
preferred AR e-commerce. One of the participants stated, “It is a very high potential method,
especially for products like furniture.” From the statistical analysis of survey results, there is also no
significant evidence that location has any effect on users’ overall evaluations. Therefore, the AR e-
commerce approach appears to be generally useful in various environments.
4.3.2 Visualized Information Provided
In the questionnaire, users were asked to rate how much information they gained from the
three different types of e-commerce systems. Participants’ ratings for information provided
are listed in Table 4., by locations and by experience orders, which were also tested
separately using Factorial ANOVA.
From Table 4., the mean rating for information provided by the traditional e-commerce
system was 1.958, the mean information provided by the VR-enhanced e-commerce system
was 3.542, and the mean rating for information provided by the AR-enhanced e-commerce
system was 4.542. As shown in the between-subjects effects and within-subjects effects
analysis of Table 5., the p-value for the effect of type of e-commerce system is very small
(<0.05), which indicates that there is a statistically significant difference in mean information
provided between the three types of e-commerce systems. However, the p-value for the
effect of location is 0.9555, which indicates that there is no statistically significant difference
in mean information provided for different locations and different experience orders.
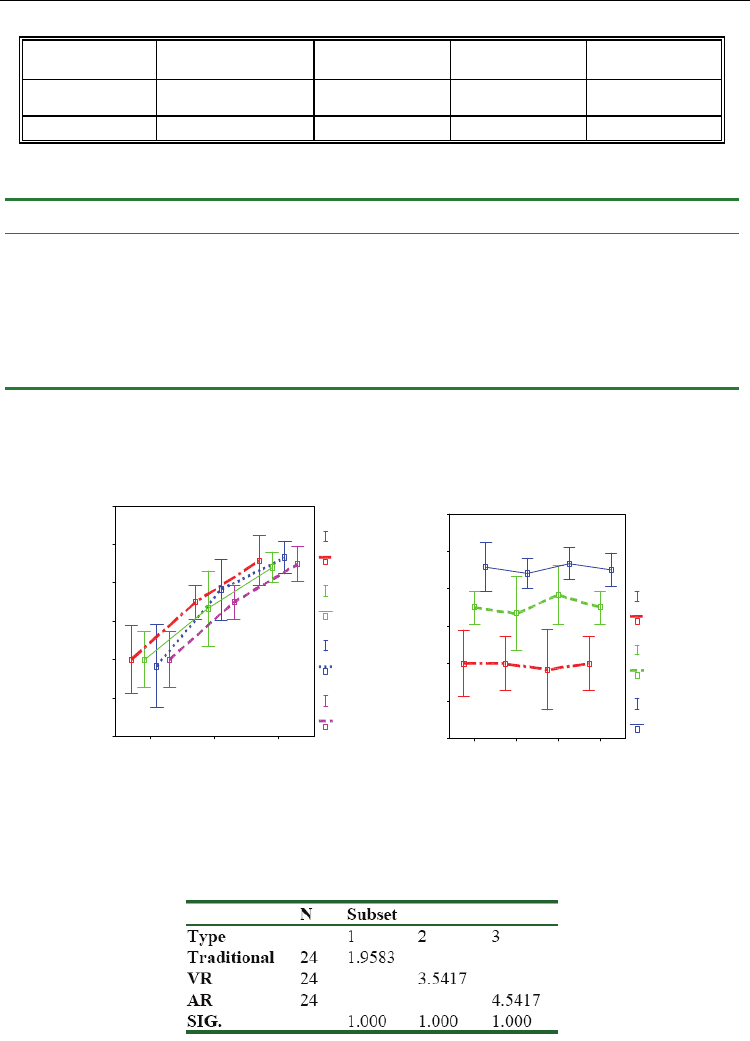
Figure 14. clearly shows that the information users gained from the AR e-commerce system
was more than the information they gained from the traditional and VR e-commerce
systems. The p-value for the interaction between type and location is 0.9677, which indicates
that there was no statistically significant interaction effect between type and location. Thus,
the location effect, and interaction effects on information provided were neglected in the
refined analysis model shown in Table 6.

Augmented Reality E-Commerce: How the Technology Benefits People's Lives
229
To determine the differences between the information users gained for the three types of e-
commerce systems, Tukey HSD was used, without considering location or order. With an
experiment-wise error rate of 0.05, Table 6. shows that the differences in information
provided between the AR e-commerce system and both the traditional e-commerce and VR
enhanced e-commerce system are both statistically significant. So the research hypothesis 2
is accepted. Participants also mentioned, in their feedback, that the AR e-commerce system
provides the capability to see how products fit in the physical space, so that they can gain
more visualization information: “It is very vivid, as if you put a real product into the place
where you want. You can efficiently evaluate product information, such as color and size,
and determine whether it can match with the scene very well.”; “It can provide people an
interesting experience and help people gain more information and a much more correct
judgment.” In addition, statistical analysis of survey results showed that there is no
significant evidence that location has an effect on information provided.
PARTICIPANT RATING
LOCATION SUBJECTS
T VR AR
1
3
3
3
2
1
3
5
3
1
3
5
4
3
4
5
5
1
4
4.5
6
3
4
5
Open space
office (1)
Mean/Std. Dev
2/1.095
3.5/0.548
4.583/0.801
7
3
4
4.5
8
2
4
4
9
2
2
5
10
1
3
4
11
3
5
4
12
1
2
5
Cubicle office
(2)
Mean/Std. Dev
2/0.894
3.333/1.211
4.417/0.492
13
3
5
5
14
1
3
5
15
1
4
4
16
4
5
4
17
1
3
5
18
1
3
5
Single-user
single-room
office (3)
Mean/Std. Dev
1.833/1.329
3.833/0.983
4.667/0.516
19
3
4
5
20
2
4
5
21
1
3
4
22
1
3
4
23
2
3
4
Multi-user
single-room
shared office
(4)
24
3
4
5
Human-Computer Interaction
230
Mean/Std. Dev
2/0.894
3.5/0.548
4.5/0.548
Mean
1.958
3.542
4.542
Std. Dev.
1.000
0.833
0.569
Table 4. Information provided (1=lowest 5=highest)
SOURCE DF SUM OF SQUARES MEAN SQUARE F SIG.
Location 3 .3472 .1157 .1062 .9555
Error 20 21.8056 1.0903
Type 2 81.4444 40.7222 69.4787** .000**
Location*Type 6 .7778 .1296 .2212 .9677
Error 40 23.4444 .5861
**p<0.05
Table 5. Tests of Between-Subjects Effects and Within-Subjects Effects (Dependent Variable:
Information Provided)
666666666666N =
Type
ARVRTraditional
Mean +- 2 SE Visualized Information
6
5
4
3
2
1
0
Location
1.00
2.00
3.00
4.00
666666666666N =
Location
4.003.002.001.00
Mean +- 2 SE Visualized Information
6
5
4
3
2
1
0
Type
Tradition
a
VR
AR
Fig. 14. Interaction between type and location for Information Provided
Table 6. Homogeneous Subsets Tukey HSD (Dependent Variable: Information Provided)

Augmented Reality E-Commerce: How the Technology Benefits People's Lives
231
4.3.3 Ease of Use
Participants’ ratings concerning ease of use for the three different types of e-commerce
systems are listed in Table 7., by location and by experience order, which were also tested
separately using Factorial ANOVA.
PARTICIPANT RATING LOCATION SUBJECTS
T VR AR
1
5
4
2
2
5
1
5
3
5
4
3
4
2
3
5
5
5
4.5
4.5
6
2
5
4
Open space
office (1)
Mean/Std. Dev
4/1.549
3.583/1.429
3.917/1.201
7
5
5
3
8
4
4
4
9
5
3
2
10
5
5
4
11
4
5
3
12
5
4
3
Cubicle office
(2)
Mean/Std. Dev
4.667/0.516
4.333/0.816
3.167/0.753
13
5
4
4
14
5
5
5
15
5
4
5
16
5
4
3
17
5
4
3
18
5
4
2
Single-user
single-room
office (3)
Mean/Std. Dev
5/0
4.167/0.408
3.667/1.211
19
5
5
3
20
5
3
5
21
4
4
3
22
5
3
2
23
4
4
3
24
5
5
3
Multi-user
single-room
shared office
(4)
Mean/Std. Dev
4.667/0.516
4/0.894
3.167/0.983
Mean
4.583
4.021
3.479
Std. Dev.
0.881
0.938
1.037
Table 7. Ease of use (1=lowest 5=highest)
Human-Computer Interaction
232
The mean ease of use for the traditional e-commerce system was 4.583, the mean ease of use
for the VR enhanced e-commerce system was 4.021, and the mean ease of use for the AR
enhanced e-commerce system was 3.479. As shown in the between-subjects effects and
within-subjects effects analysis of Table 8., the p-value for the effect of type of e-commerce
system is 0.0027 (<0.05), which indicates that there is a statistically significant difference in
mean ease of use between the three types of e-commerce systems. In contrast, the p-value
for the effect of location is 0.4033, which indicates that there is no statistically significant
difference in mean ease of use for different locations.
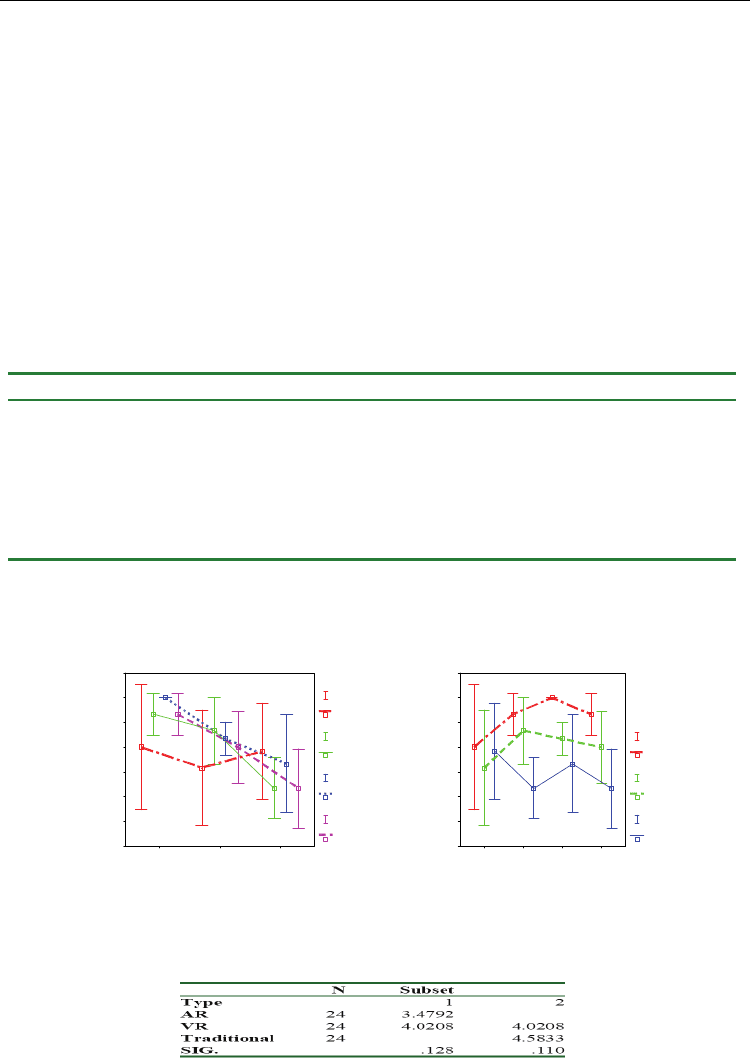
Figure 15. shows the main effect of different types of e-commerce systems. Ease of use for
the AR e-commerce system is much lower than ease of use for the traditional and for the VR
e-commerce systems. The p-value for the interaction effect between type and location is
0.5186, which indicates that there are also no statistically significant interaction effects for
type and location or type. Thus, the interaction effects, for ease of use were neglected in the
refined analysis model shown in Table 9.
SOURCE DF SUM OF SQUARES MEAN SQUARE F SIG.
Location 3 1.9444 .6481 1.0234 .4033
Error 20 12.6777 .6333
Type 2 14.6319 7.3160 6.8721** .0027**
Location*Type 6 5.6181 .9363 .8795 .5186
Error 40 42.5833 1.0646
**p<0.05
Table 8. Tests of Between-Subjects Effects and Within-Subjects Effects (Dependent Variable:
Easiness to Use)
666666666666N =
Type
ARVRTraditional
Mean +- 2 SE Easiness to Use
5.5
5.0
4.5
4.0
3.5
3.0
2.5
2.0
Location
1.00
2.00
3.00
4.00
666666666666N =
Location
4.003.002.001.00
Mean +- 2 SE Easiness to Use
5.5
5.0
4.5
4.0
3.5
3.0
2.5
2.0
Type
Traditional
VR
AR
Fig. 15. Interaction between type and location for Easiness to use
Table 9. Homogeneous Subsets Tukey HSD