Pecharsky V.K., Zavalij P.Y. Fundamentals of Powder Diffraction and Structural Characterization of Materials
Подождите немного. Документ загружается.

522
Chapter
6
0.0
LaNi
,,,,
Sn
,,,,,
Cu
Ka
40 4 1 42
43
44 45 46
Bragg angle, 28 (deg.)
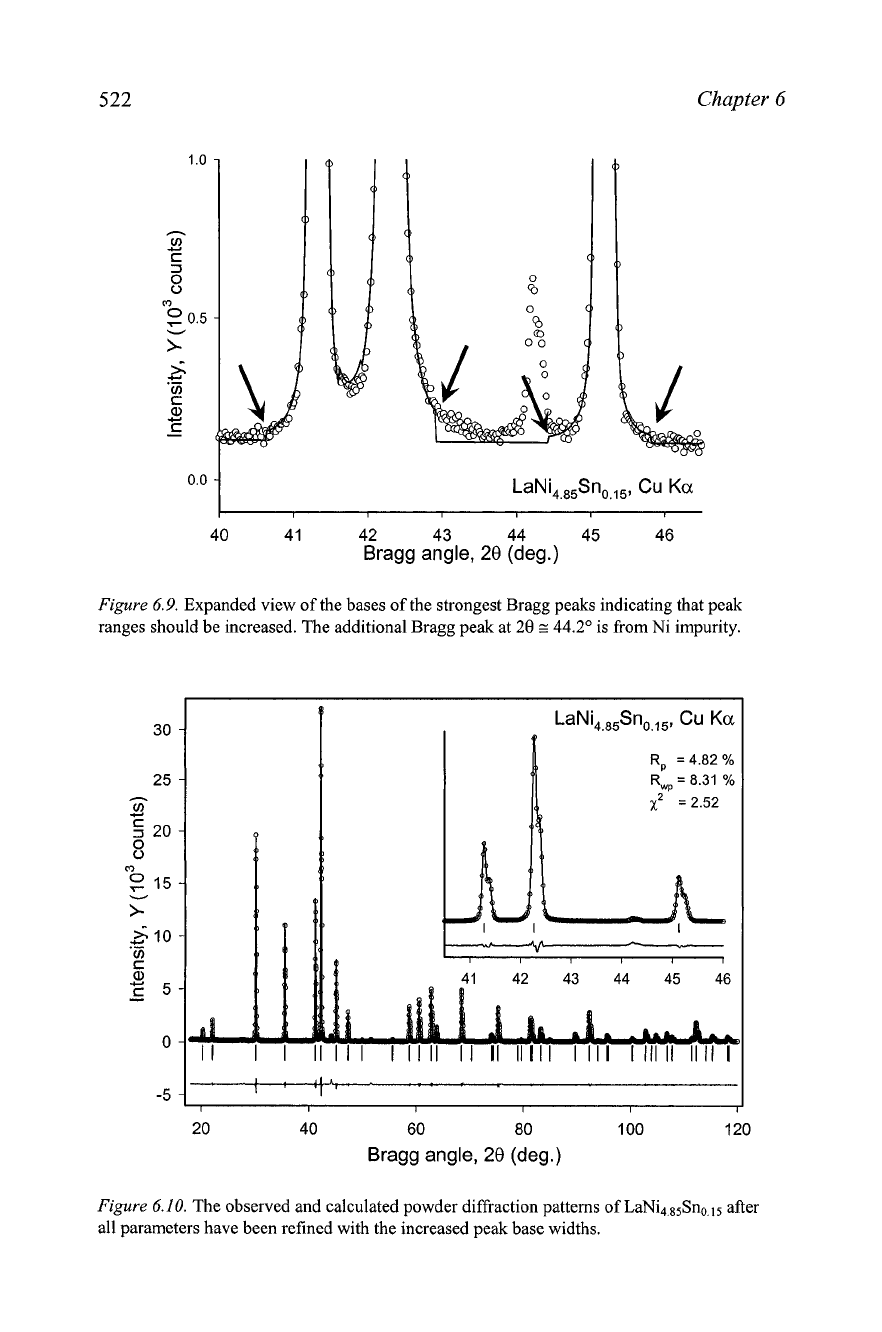
Figure
6.9.
Expanded view of the bases of the strongest Bragg peaks indicating that peak
ranges should be increased. The additional Bragg peak at
20
s
44.2'
is from Ni impurity.
20 40 60 80 100 120
Bragg angle, 28 (deg.)
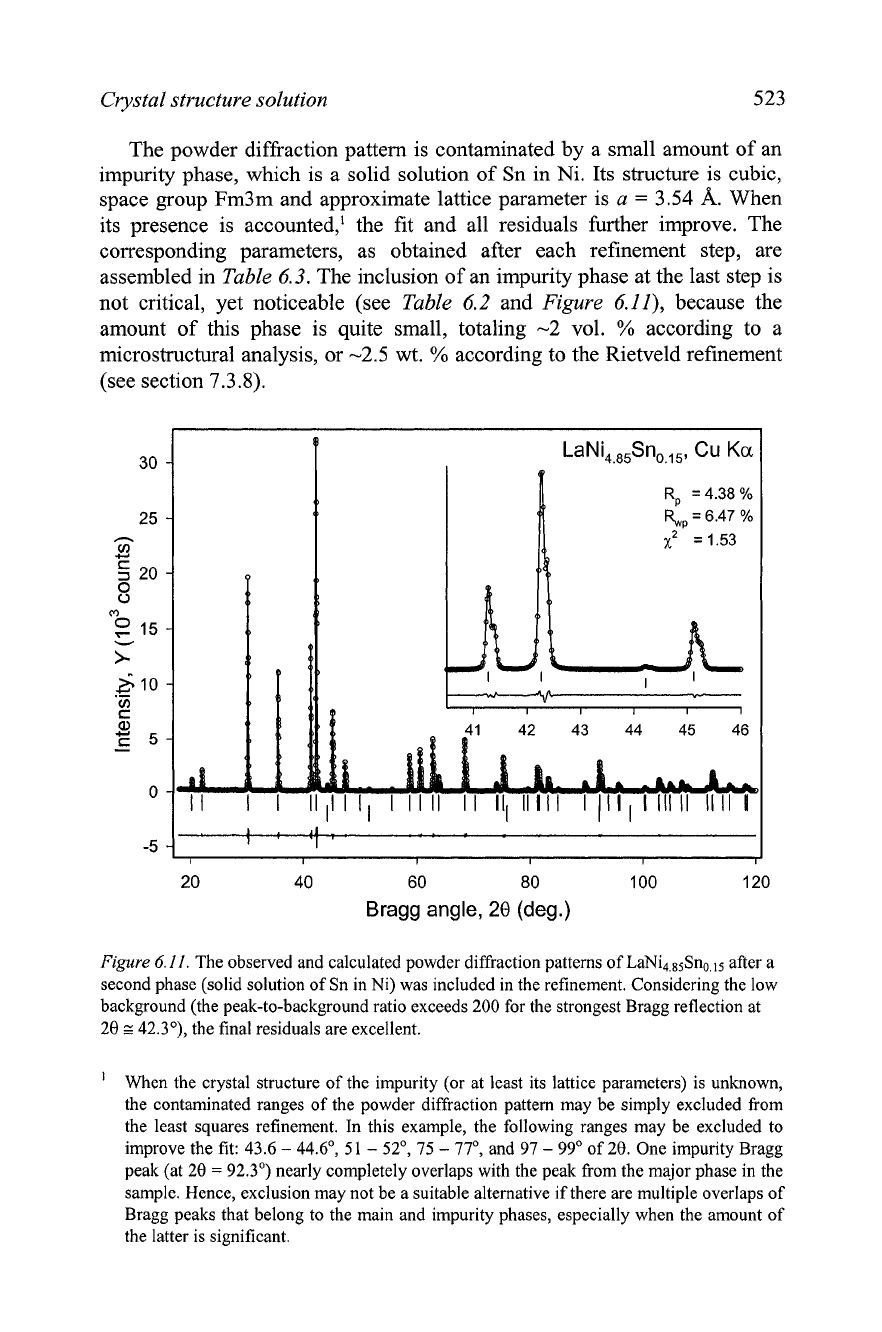
Figure
6.10.
The observed and calculated powder diffraction patterns of LaNi4,85Sno,,5 after
all parameters have been refined with the increased peak base widths.
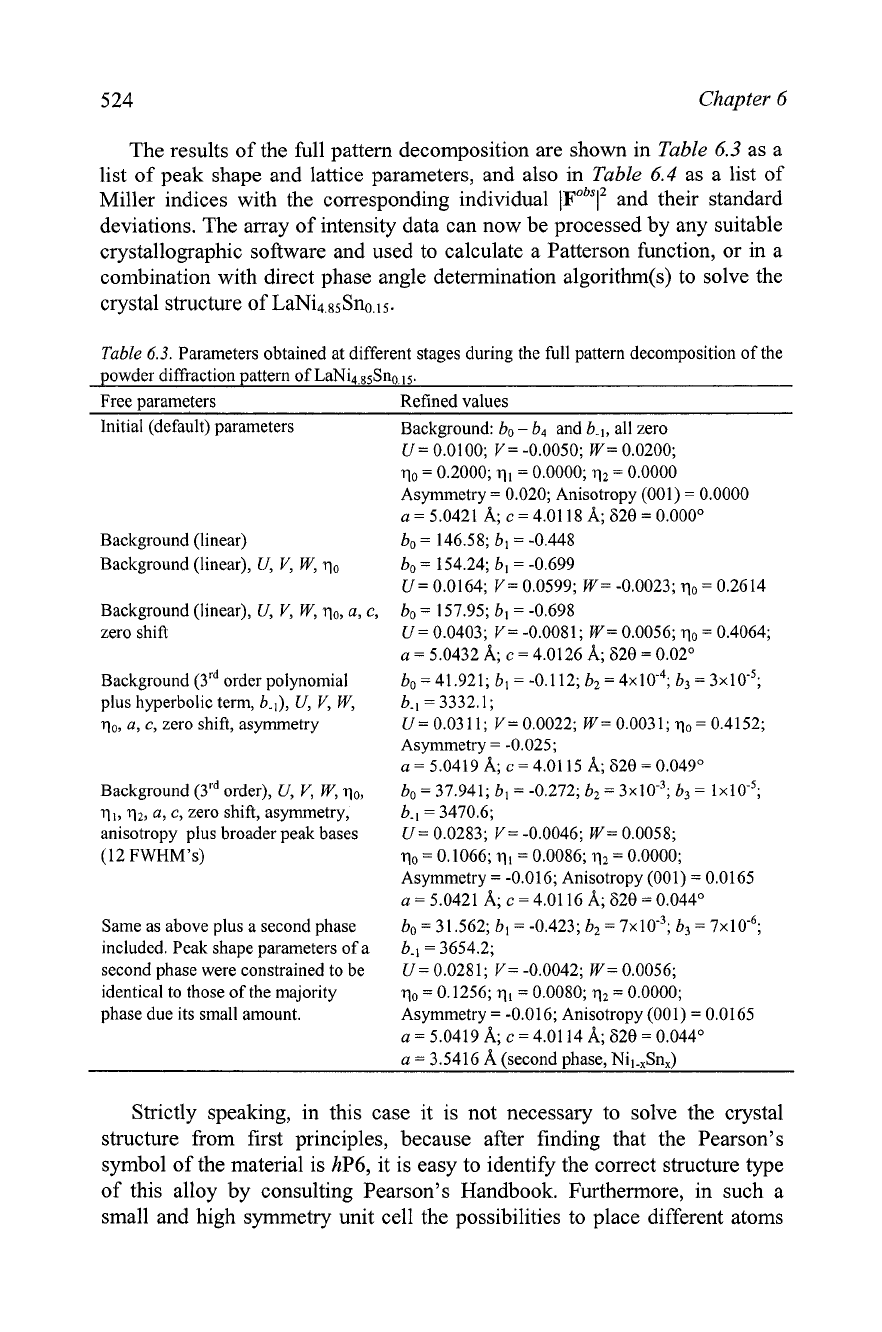
Crystal structure solution
523
The powder diffraction pattern is contaminated by a small amount of an
impurity phase, which is a solid solution of Sn in Ni. Its structure is cubic,
space group Fm3m and approximate lattice parameter is
a
=
3.54
A.
When
its presence is accounted,' the fit and all residuals further improve. The
corresponding parameters, as obtained after each refinement step, are
assembled in
Table
6.3. The inclusion of an impurity phase at the last step is
not critical, yet noticeable (see
Table
6.2
and
Figure
6.11), because the
amount of this phase is quite small, totaling
-2
vol.
%
according to a
microshuctural analysis, or -2.5
wt.
%
according to the Rietveld refinement
(see section
7.3.8).
LaNi
,,,,
Sn
,,,,,
Cu
Ka
ll I I
1111
1
l1 I
11
11
II Ill
11111
I (Ill
I
IIIII
1111
1
20
40
60 80 100 120
Bragg angle,
20
(deg.)
Figure
6.11.
The observed and calculated powder diffraction patterns of LaNi4,85Sno.15 after a
second phase (solid solution of Sn in Ni) was included in the refinement. Considering the low
background (the peak-to-background ratio exceeds 200 for the strongest Bragg reflection at
28
z
42.3"), the final residuals are excellent.
'
When the crystal structure of the impurity (or at least its lattice parameters) is unknown,
the contaminated ranges of the powder diffraction pattern may be simply excluded from
the least squares refinement. In this example, the following ranges may be excluded to
improve the fit: 43.6
-
44.6', 51
-
52', 75
-
77", and 97
-
99" of 28. One impurity Bragg
peak (at 28
=
92.3') nearly completely overlaps with the peak from the major phase in the
sample. Hence, exclusion may not be a suitable alternative if there are multiple overlaps of
Bragg peaks that belong to the main and impurity phases, especially when the amount of
the latter is significant.
5
24
Chapter
6
The results of the full pattern decomposition are shown in Table
6.3
as a
list of peak shape and lattice parameters, and also in Table
6.4
as a list of
Miller indices with the corresponding individual
l~~~~l~
and their standard
deviations. The array of intensity data can now be processed by any suitable
crystallographic software and used to calculate a Patterson function, or in a
combination with direct phase angle determination
algorithm(s) to solve the
crystal structure of LaNi4.s5Sno.15.
Table
6.3.
Parameters obtained at different stages during the full pattern decomposition of the
powder diffraction pattern of LaNi4,,5Sno.15.
Free parameters Refined values
Initial (default) parameters
Background (linear)
Background (linear),
U, V, W,
qo
Background (linear),
U, V, W,
qo, a,
c,
zero shift
Background (3rd order polynomial
plus hyperbolic term,
b.l),
U, V, W,
qo, a,
c,
zero shift, asymmetry
Background (3rd order),
U,
V, W,
qo,
ql, q2, a,
c,
zero shift, asymmetry,
anisotropy plus broader peak bases
(12 FWHM's)
Same as above plus a second phase
included. Peak shape parameters of a
second phase were constrained to be
identical to those of the majority
phase due its small amount.
Background:
bo
-
b4 and b.l, all zero
U
=
0.0100;
V
=
-0.0050;
W=
0.0200;
qo
=
0.2000; ql
=
0.0000;
qz
=
0.0000
Asymmetry
=
0.020; Anisotropy (001)
=
0.0000
a
=
5.0421 A;
c
=
4.01 18 A; 620
=
0.000"
bo
=
146.58; bl
=
-0.448
bo
=
154.24; bl
=
-0.699
U=
0.0164;
V=
0.0599;
W=
-0.0023; qo
=
0.2614
bo
=
157.95; bl
=
-0.698
U=
0.0403;
V=
-0.0081;
W=
0.0056; yo
=
0.4064;
a
=
5.0432 A;
c
=
4.0126 A; 620
=
0.02"
bo
=
41.921; bl
=
-0.1 12; b2
=
4x10-~; b3
=
3x10-~;
b.1
=
3332.1;
U=
0.031
1;
V=
0.0022;
W=
0.0031; qo
=
0.4152;
Asymmetry
=
-0.025;
a
=
5.0419
A;
c
=
4.01 15
A;
620
=
0.049"
bo
=
37.941; b,
=
-0.272; b2= 3x10"; b3
=
1x10.~;
b.1
=
3470.6;
U=
0.0283;
V=
-0.0046;
W=
0.0058;
qo
=
0.1066; q1
=
0.0086; q2
=
0.0000;
Asymmetry
=
-0.016; Anisotropy (001)
=
0.0165
a
=
5.0421 A;
c
=
4.01 16 A; 620
=
0.044"
bo
=
31.562; bl
=
-0.423; b2
=
7x10-~; b3
=
7~10-~;
6.1
=
3654.2;
U=
0.0281;
V=
-0.0042;
W=
0.0056;
qo
=
0.1256; q1
=
0.0080; q2
=
0.0000;
Asymmetry
=
-0.016; Anisotropy (001)
=
0.0165
a
=
5.0419 A;
c
=
4.01 14 A; 620
=
0.044'
a
=
3.5416
A
(second phase, Nil.,Sn,)
Strictly speaking, in this case it is not necessary to solve the crystal
structure from first principles, because after finding that the Pearson's
symbol of the material is hP6, it is easy to identify the correct structure type
of this alloy by consulting Pearson's Handbook. Furthermore, in such a
small and high symmetry unit cell the possibilities to place different atoms
Crystal structure solution
525
are quite limited due to geometrical constraints, and chances are quite high
that this type of crystal structure is already known. Nonetheless, this
example is useful to illustrate how a simple combination of available data
about the chemical composition, unit cell contents and symmetry provides
required information, which may be used to locate all atoms in the unit cell.
Table
6.4.
The list of Bragg reflections with their corresponding observed structure factors
squared determined from Le Bail's full pattern decomposition of the powder diffraction
pattern of
LaNi, &no
Only the data for the major phase are listed.
hkl
Fobs 2
OIF~~~~~
h
k
1
(3
2
010
85
1 0
3
2 1040
6
As established above, a total of 16 space groups are possible for
LaNi4,85Sno.15 but the highest symmetry is quite likely because the material is
an intermetallic compound. Hence, we will first concentrate our attention on
the space group
P61mmm. If the structure is solved in this space group
symmetry, then there is no need to test lower symmetry groups. However, if
the solution could not be found, the symmetry should be gradually lowered
until the crystal structure is solved, see
Figure
6.1.
We already know that we must locate a total of one La, and five Ni+Sn
atoms in the unit cell. According to the International Tables for
Crystallography,' only two sites in this space group symmetry have
International Tables for Crystallography, vol. A, Fifth revised edition, Theo Hahn, Ed.,
Published for the International Union of Crystallography by Kluwer Academic Publishers,
Boston/Dordrecht/London
(2002).
526 Chapter
6
multiplicity one and, therefore, are suitable to accommodate the La atom
(Table 6.5). These are: l(a) with coordinates of a point in 0,0,0, and l(b)
-
0,0,1/2. Considering the fact that La is the strongest scattering atom in this
crystal structure, it has the largest contribution to the phase angles of all
reflections. Hence, Ni atoms should be easily located from a Fourier map.'
Table
6.5.
Low multiplicity sites available in the space group
P6lmmm.
Site Coordinates of svrnmetricallv eauivalent points
As is easy to verify by calculating interatomic distances, the La atoms
can be accommodated in l(a) or l(b) sites, which differ only by a shift of the
origin of coordinates, and La-La distances are identical regardless of where
the La atom is placed. We place La in the
l(a) site. Calculation of phase
angles always involves calculation of
IF~~Y'~I
and therefore, it is also
possible to compute the corresponding figure of merit, RF,2 which is similar
to the Bragg residual (Eq. 6.20) except that the integrated intensities are
substituted with the absolute values of structure factors. After a La atom is
placed in the l(a) site, the
RF
=
54.8%,
which is quite good considering that
five atoms are still missing from our model.
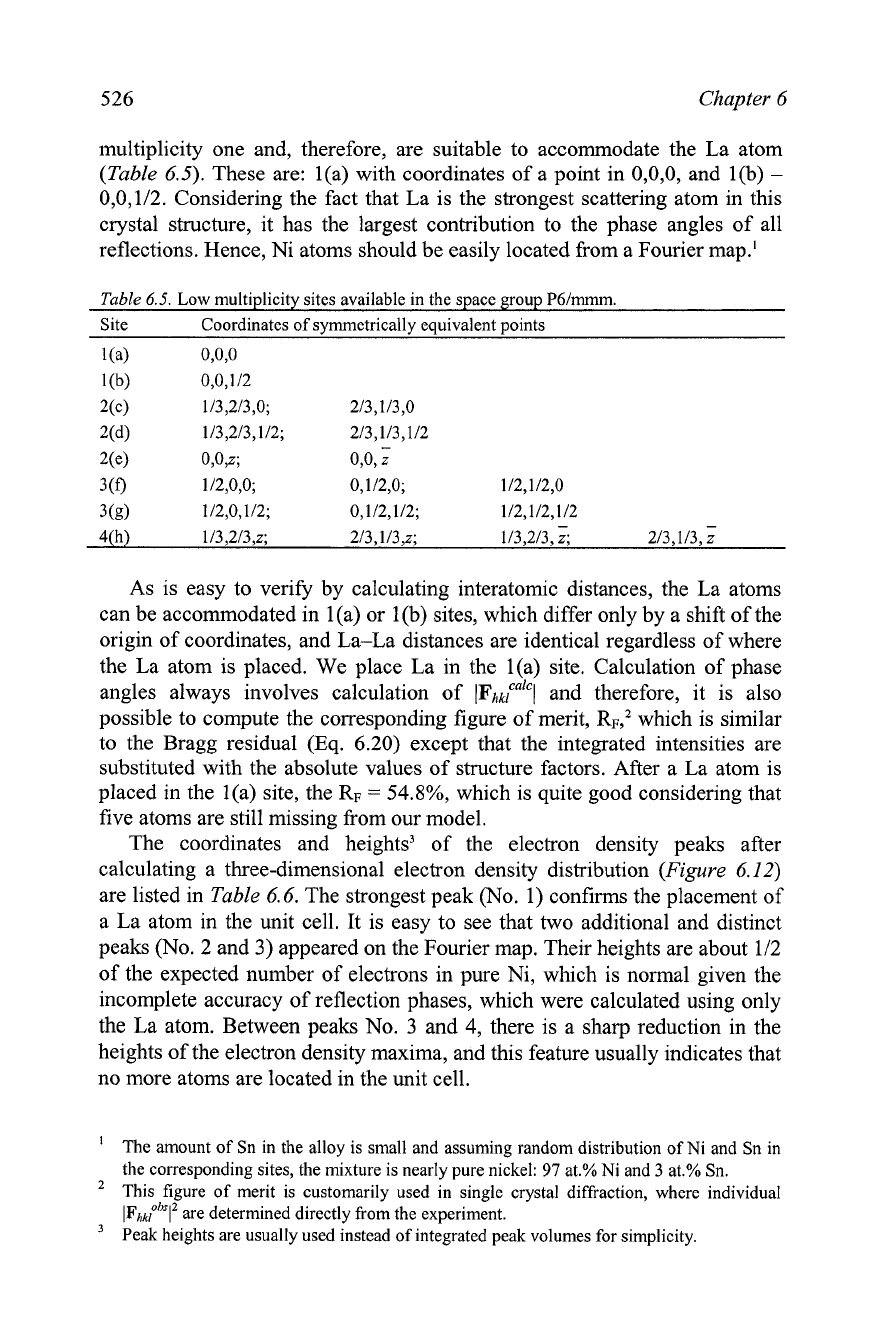
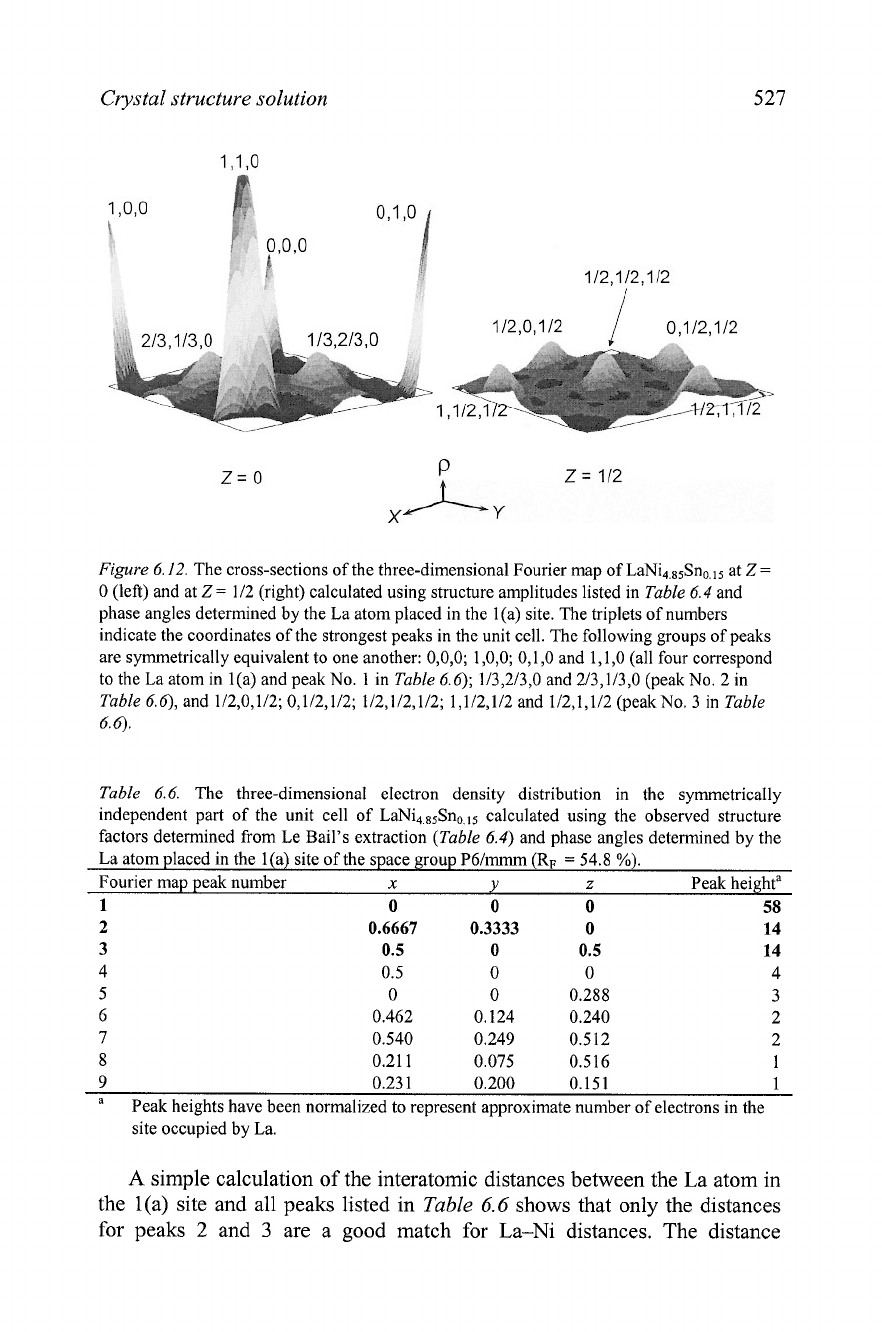
The coordinates and heights3 of the electron density peaks after
calculating a three-dimensional electron density distribution (Figure 6.12)
are listed in
Table
6.6. The strongest peak (No. 1) confirms the placement of
a La atom in the unit cell. It is easy to see that two additional and distinct
peaks (No. 2 and 3) appeared on the Fourier map. Their heights are about
112
of the expected number of electrons in pure Ni, which is normal given the
incomplete accuracy of reflection phases, which were calculated using only
the La atom. Between peaks No. 3 and
4,
there is a sharp reduction in the
heights of the electron density maxima, and this feature usually indicates that
no more atoms are located in the unit cell.
The amount of Sn in the alloy is small and assuming random distribution of Ni and Sn in
the corresponding sites, the mixture is nearly pure nickel:
97
at.% Ni and
3
at.% Sn.
This figure of merit is customarily used in single crystal diffraction, where individual
IF~~P~~~~
are determined directly from the experiment.
'
Peak heights are usually used instead of integrated peak volumes for simplicity.
Crystal structure solution
527
Figure 6.12. The cross-sections of the three-dimensional Fourier map of LaNi4.ssSno.ls at Z
=
0 (left) and at Z= 112 (right) calculated using structure amplitudes listed in Table 6.4 and
phase angles determined by the La atom placed in the l(a) site. The triplets of numbers
indicate the coordinates of the strongest peaks in the unit cell. The following groups of peaks
are symmetrically equivalent to one another: 0,0,0; 1,0,0; 0,1,0 and 1,1,0 (all four correspond
to the La atom in
1
(a) and peak No. 1 in Table 6.6); 113,213,O and 213,113,O (peak No. 2 in
Table 6.4, and 1/2,0,1/2; 0,112,112; 112,112,112; 1,112,112 and 1/2,1,112 (peakNo. 3 in Table
6.6).
Table 6.6. The three-dimensional electron density distribution in the symmetrically
independent part of the unit cell of LaNi4,85Sno.ls calculated using the observed structure
factors determined from Le Bail's extraction (Table 6.4) and phase angles determined by the
La atom placed in the l(a) site of the space group P6lrnmm
(R;
=
54.8
%).
Fourier map peak number
x
Y
z
Peak heighta
1
0 0
0
58
2
0.6667 0.3333 0
14
3 0.5 0 0.5
14
4 0.5 0 0 4
5 0 0 0.288 3
6 0.462 0.124 0.240 2
7 0.540 0.249 0.512 2
8
0.21 1 0.075 0.516 1
9
0.23 1 0.200 0.151 1
a
Peak heights have been normalized to represent approximate number of electrons in the
site occupied by La.
A
simple calculation of the interatomic distances between the La atom in
the l(a) site and all peaks listed in
Table
6.6
shows that only the distances
for peaks
2
and
3
are a good match for La-Ni distances. The distance
528
Chapter
6
between peaks 2 and
3
corresponds to the sum of radii of Ni atoms.
Furthermore, peak No.
2
represents coordinates of the 2(c) sites, and peak
No. 3 corresponds to the 3(g) sites in space group P6Immm. Thus, a total of
6
atoms have been placed in the unit cell of LaNi4.85Sno.15, i.e. exactly as
many as established from the gravimetric density of the alloy.
It is important to emphasize that La in the l(a) site has been confirmed by
the electron density calculation, although it is worth noting that in a heavy
atom approach it is often the case, that a single strongly scattering atom
always appears on the Fourier map even when it has been placed incorrectly.
However, if the location of the heavy atom is wrong, additional strong peaks
in the electron density distribution will normally be incorrect as can be easily
established by the computation of the interatomic distances. Such a model of
the crystal structure will be impossible to complete, i.e. the missing atoms
typically will not appear on the subsequent Fourier maps due to incorrectly
determined phase angles.
After all three independent atoms (peaks 1 through
3
in Table
6.6)
have
been included in computations assuming identical displacement parameters
in an isotropic approximation
(B
=
0.5
8L2),
the resulting
RF
=
6.9%
without
refinement. This value is excellent because
i)
the powder diffraction pattern
is relatively simple with minimum overlap, and ii) the powder particles used
in the diffraction experiment were nearly ideal (spherical), thus preferred
orientation effects were also minimized. The following electron density
distribution (Figure
6.13
and Table
6.7)
was obtained using the newly
determined set of phase angles.
Figure
6.13.
The cross-sections of the three-dimensional Fourier map of LaNi4.ssSno.15 at
Z
=
0
(left) and at
Z
=
112
(right) calculated using structure amplitudes listed in
Table
6.4
and
phase angles determined
by
the La atom placed in the l(a) site and Ni atoms placed in the 2(c)
and 3(g) sites. The notations are identical to
Figure
6.12.
Crystal structure solution
529
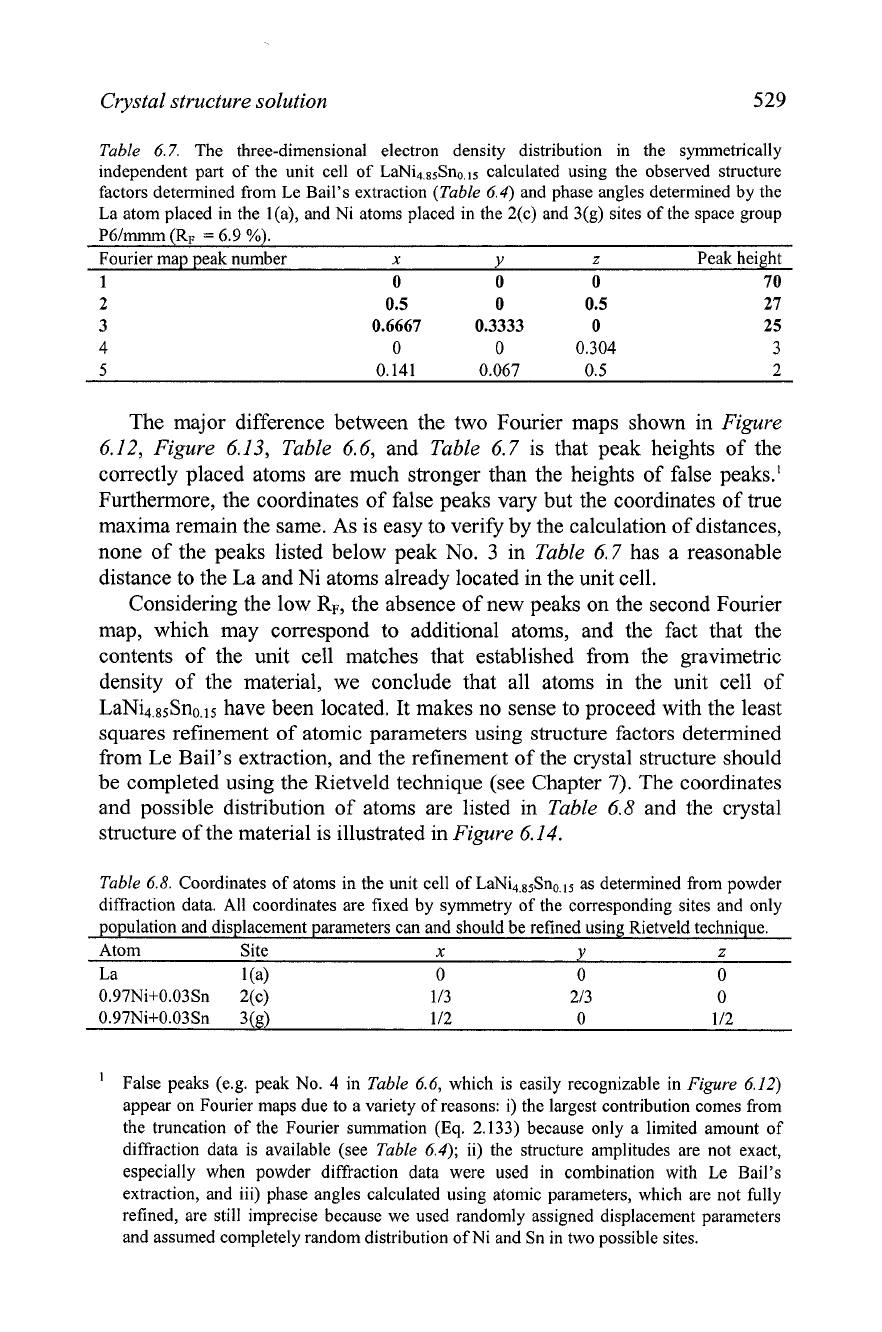
Table
6.7. The three-dimensional electron density distribution in the symmetrically
independent part of the unit cell of LaNi,,,,Sn,,, calculated using the observed structure
factors determined from Le Bail's extraction
(Table
6.4) and phase angles determined by the
La atom placed in the l(a), and Ni atoms placed in the 2(c) and 3(g) sites of the space group
P6lrnmm (RF
=
6.9
%).
Fourier map peak number
x
Y
z
Peak height
1
0
0
0
70
2
0.5
0
0.5 27
3 0.6667 0.3333 0
25
4
0 0 0.304 3
The major difference between the two Fourier maps shown in
Figure
6.12,
Figure
6.13,
Table
6.6, and
Table
6.7 is that peak heights of the
correctly placed atoms are much stronger than the heights of false peaks.'
Furthermore, the coordinates of false peaks vary but the coordinates of true
maxima remain the same. As is easy to verify by the calculation of distances,
none of the peaks listed below peak No.
3
in
Table
6.7 has a reasonable
distance to the La and Ni atoms already located in the unit cell.
Considering the low
RF,
the absence of new peaks on the second Fourier
map, which may correspond to additional atoms, and the fact that the
contents of the unit cell matches that established from the gravimetric
density of the material, we conclude that all atoms in the unit cell of
LaNi4.85Sno.15 have been located. It makes no sense to proceed with the least
squares refinement of atomic parameters using structure factors determined
from Le Bail's extraction, and the refinement of the crystal structure should
be completed using the Rietveld technique (see Chapter
7).
The coordinates
and possible distribution of atoms are listed in
Table
6.8 and the crystal
structure of the material is illustrated in
Figure
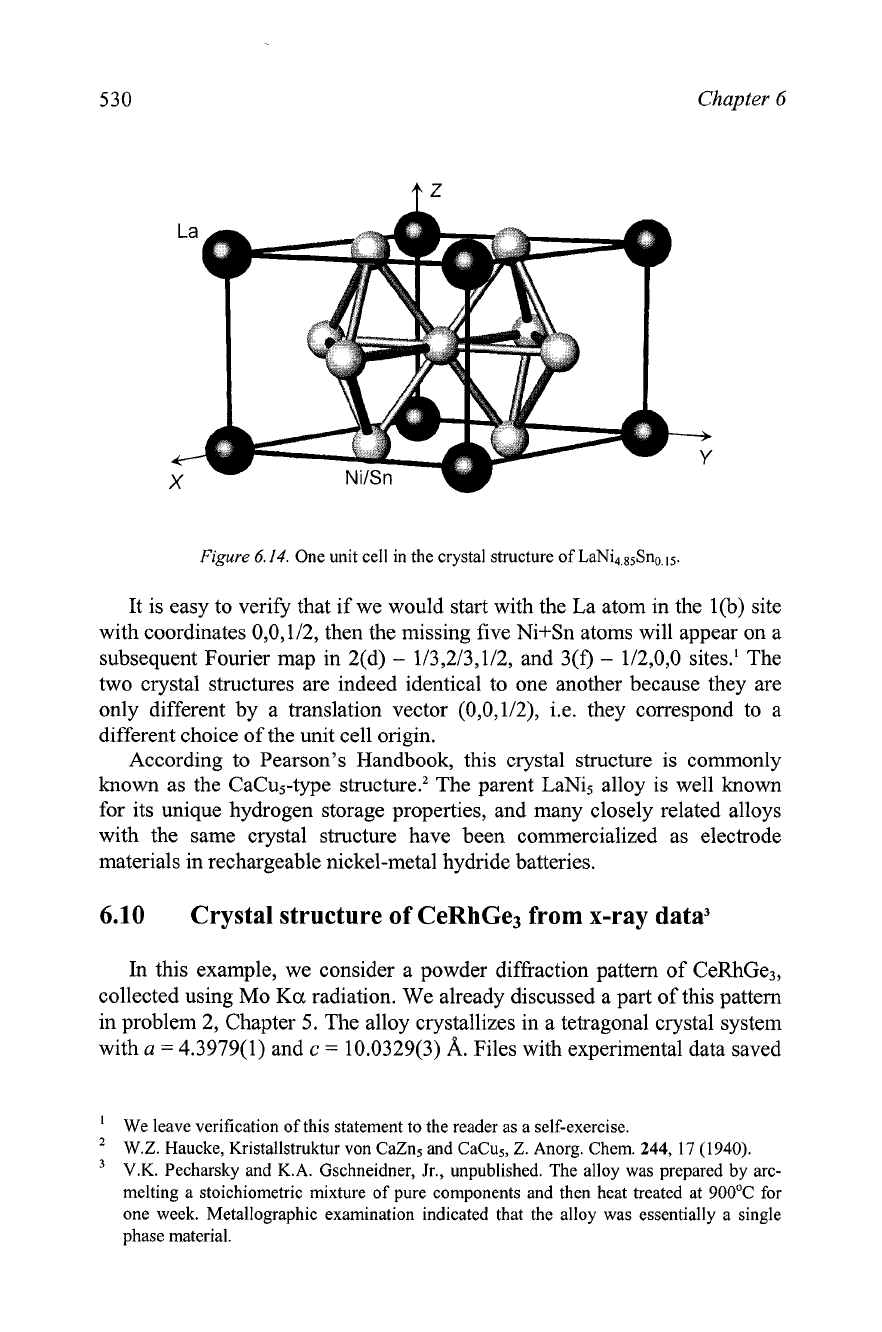
6.14.
Table
6.8. Coordinates of atoms in the unit cell of LaNi4,85Sno.15
as
determined from powder
diffraction data. All coordinates are fixed by symmetry of the corresponding sites and only
population and displacement parameters can and should be refined using Rietveld technique.
Atom Site
x
Y
z
La ](a> 0 0 0
0.97Ni+0.03Sn 2(c) 113 213 0
0.97Ni+O.O3Sn 3(g) 112
0
1
I2
'
False peaks (e.g. peak No.
4
in
Table
6.6, which is easily recognizable in
Figure
6.12)
appear on Fourier maps due to a variety of reasons: i) the largest contribution comes from
the truncation of the Fourier summation (Eq. 2.133) because only a limited amount of
diffraction data is available (see
Table
6.4); ii) the structure amplitudes are not exact,
especially when powder diffraction data were used in combination with Le Bail's
extraction, and iii) phase angles calculated using atomic parameters, which are not fully
refined, are still imprecise because we used randomly assigned displacement parameters
and assumed completely random distribution of Ni and Sn in two possible sites.
Chapter
6
Figure
6.14.
One unit cell in the crystal structure of LaNi,,8sSno,ls
It is easy to verify that if we would start with the La atom in the l(b) site
with coordinates 0,0,1/2, then the missing five Ni+Sn atoms will appear on a
subsequent Fourier map in 2(d)
-
1/3,2/3,1/2, and 3(f)
-
1/2,0,0 sites.' The
two crystal structures are indeed identical to one another because they are
only different by a translation vector (0,0,1/2), i.e. they correspond to a
different choice of the unit cell origin.
According to Pearson's Handbook, this crystal structure is commonly
known as the CaCu5-type struct~re.~ The parent LaNi5 alloy is well known
for its unique hydrogen storage properties, and many closely related alloys
with the same crystal structure have been commercialized as electrode
materials in rechargeable nickel-metal hydride batteries.
6.10
Crystal structure of CeRhGe3 from x-ray data3
In
this example, we consider a powder diffraction pattern of CeRhGe3,
collected using Mo
Ka
radiation. We already discussed a part of this pattern
in problem 2, Chapter
5.
The alloy crystallizes in a tetragonal crystal system
with
a
=
4.3979(1) and
c
=
10.0329(3)
A.
Files with experimental data saved
We leave verification of this statement to the reader as a self-exercise.
W.Z.
Haucke, Kristallstruktur von CaZn5 and CaCu5,
Z.
Anorg. Chem.
244,
17
(1940).
V.K.
Pecharsky and K.A. Gschneidner, Jr., unpublished. The alloy was prepared
by
arc-
melting a stoichiometric mixture of pure components and then heat treated at 900•‹C for
one week. Metallographic examination indicated that the alloy was essentially a single
phase material.
Crystal structure solution
53 1
in two different formats (Ch6Ex02-MoKa.dat and Ch6Ex02-MoKa.xy)
are found on the
CD
accompanying this book.
Analysis of possible systematic absences indicates a body-centered lattice
with no additional forbidden reflections. Thus, one the following eight space
groups is to be expected: I4/mmm, I-, 142m, I4mm, 1422, I4/m, 1; or 14.
The measured gravimetric density of the alloy is 7.79 g/cm3. One unit cell
(V
=
194.05 A3) contains two formula units of CeRhGe3
(Z
=
1.98
z
2) or a total
of two Ce, two Rh and six Ge atoms. Similar to the previous example, none
of the eight space groups can be excluded because all contain 2- and 4-fold
sites suitable to accommodate all three types of atoms in an ordered or
disordered fashion. Both
Rh
and Ge atoms have similar atomic volumes and
may occupy same sites simultaneously, while Ce atoms are much larger and
should occupy their own sites.
Full pattern decomposition has been performed using LHPM-Rietica.
Peak shapes have been represented using a pseudo-Voigt function. The
progression of the full pattern decomposition is shown by the corresponding
figures of merit, which are assembled in
Table
6.9, and the results are
illustrated in
Figure
6.15,
Figure
6.16, and
Table
6.10.
Table
6.9.
Figures of merit obtained during Le Bail decomposition of the powder diffraction
pattern of CeRhGe3. Wavelengths used: hKal
=
0.70932
A,
hKa2
=
0.71361
A;
Re,
=
2.96
%.
Refined parameters Illustration R, RWD
2
Background (linear)
32.68 44.44 226.1
+
a,
c 27.35 35.45 143.9
+
U,
V,
W,
ro,
asymmetry
7.63 10.74 13.23
+
Background
(4th
order), broader base
-
4.89 7.03 5.67
All, with ~oward's' asymmetry
Figure
6.15
4.71 6.87 5.41
All, with
FCJ~
asymmetry
Figure
6.16
4.45 6.52 4.88
The use of Mo
Ka
radiation shifts all diffraction peaks to lower Bragg
angles and therefore, asymmetry effects are more severe than in the previous
example, where Cu
Ka
radiation was used. As a result, the order in which
parameters were refined was changed to avoid potential least squares
instability problems. When all parameters were refined in essentially the
same approximation as in the previous example (see row 5 in
Table
6.9), the
resultant figures of merit were satisfactory, but a careful analysis of
Figure
6.15 indicates that the selected peak shape function does not adequately
describe the observed peak shapes at low Bragg angles.
'
See the footnote on page
5
18.
Asymmetry was treated in the two-parameter approximation given by L.W. Finger,
D.E.
Cox, and A.P. Jephcoat, A correction for powder diffraction peak asymmetry due to axial
divergence, J. Appl. Cryst.
27,
892 (1994).