Principles of Finance with Excel (Основы финансов c Excel)
Подождите немного. Документ загружается.

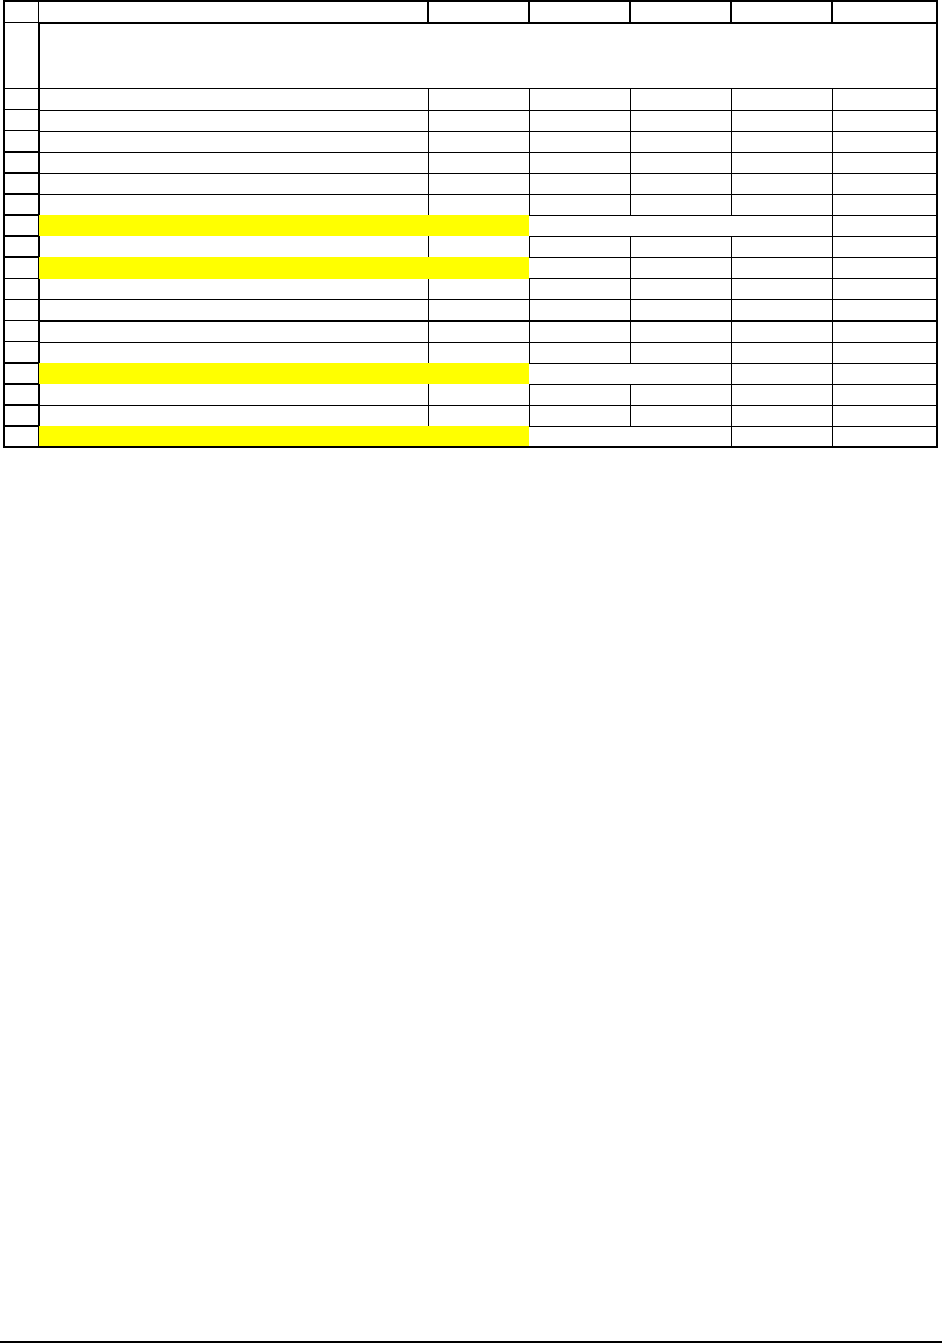
PFE, Chapter 9: DCF valuation with financial models page 7
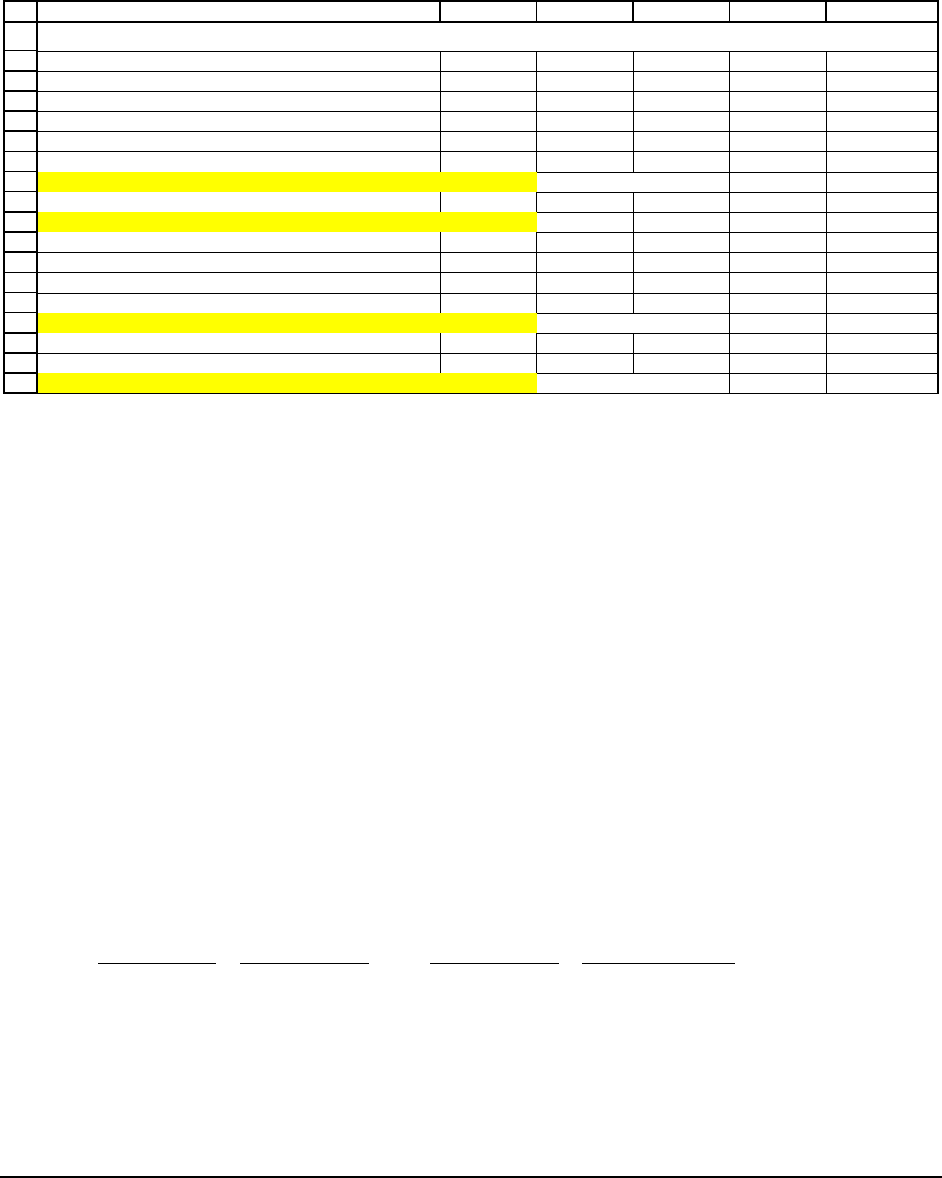
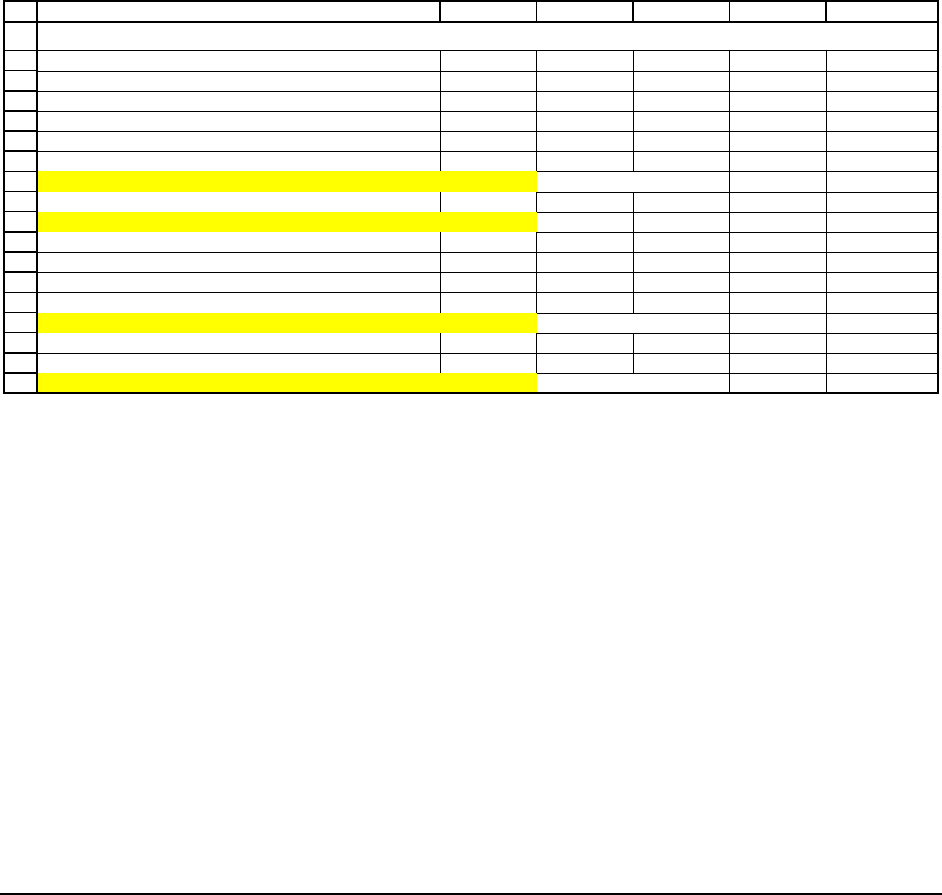
(Notice that the present value of the firm’s future FCFs is often called the firm’s
enterprise value.) After some work to estimate the future free cash flows, John comes up with
the following valuation:
1
2
3
4
5
6
7
8
9
10
11
12
13
14
15
16
17
18
ABCDEF
Year 2005 2006 2007 2008 2009
Estimated free cash flow 9,210,135 10,052,522 10,966,397 11,956,842 13,029,110
Terminal value 91,203,773
Total 9,210,135 10,052,522 10,966,397 11,956,842 104,232,883
Weighted average cost of capital, WACC 20%
Enterprise value, PV of future FCFs + terminal value 68,657,407 <-- =NPV(B7,B5:F5)
Add current cash & marketable securities 500,000
Firm value 69,157,407 <-- =B9+B8
Subtract out debt
Short-term debt 2,500,000
Long-term debt 7,500,000
Estimated value of equity 59,157,407 <-- =B10-B13-B14
Number of shares 1,000,000
Estimated value per share 59.16 <-- =B15/B17
MOTHERBOARD SHOES--DCF VALUATION
There are a few things to explain about this valuation:
• John has projected 5 years of future FCFs and has also projected a terminal value at the
end of the 5 years. He explains that the finance methodology requires him to estimate the
present value of all the future free cash flows:
all future FCFs
PV
discounted at WACC
⎛⎞
⎜⎟
⎝⎠
. However,
he thinks this is too much guesswork. Instead of estimating all future FCFs, he’s
estimated 5 years of FCFs and then estimated the terminal value, the value of
Motherboard at the end of year 5:
()
()()()
2005 2006 2009
255
...
1
111
all future FCFs
Enterprise value PV
discounted at WACC
FCF FCF FCF
Terminal Value
WACC
WACC WACC WACC
⎛⎞
=
⎜⎟
⎝⎠
=+ ++ +
+
+++
PFE, Chapter 9: DCF valuation with financial models page 8
If the weighted average cost of capital is 20%, the enterprise value, the present value of
the FCFs and the terminal value, is $68,657,407.
3
•
Adding current balances of cash and marketable securities to the present value of the
FCFs and subtracting out the value of the firm’s debts gives an equity valuation of
$59,157,407 (cell B15). Since there are one million shares outstanding, this values each
share at $59.16 (cell B18).
The firm’s book value—a definition we’d rather not use
There’s another valuation method which John explains to the Motherboard family—the
accounting definition of firm value uses the balance sheet to arrive at the value of the firm. For
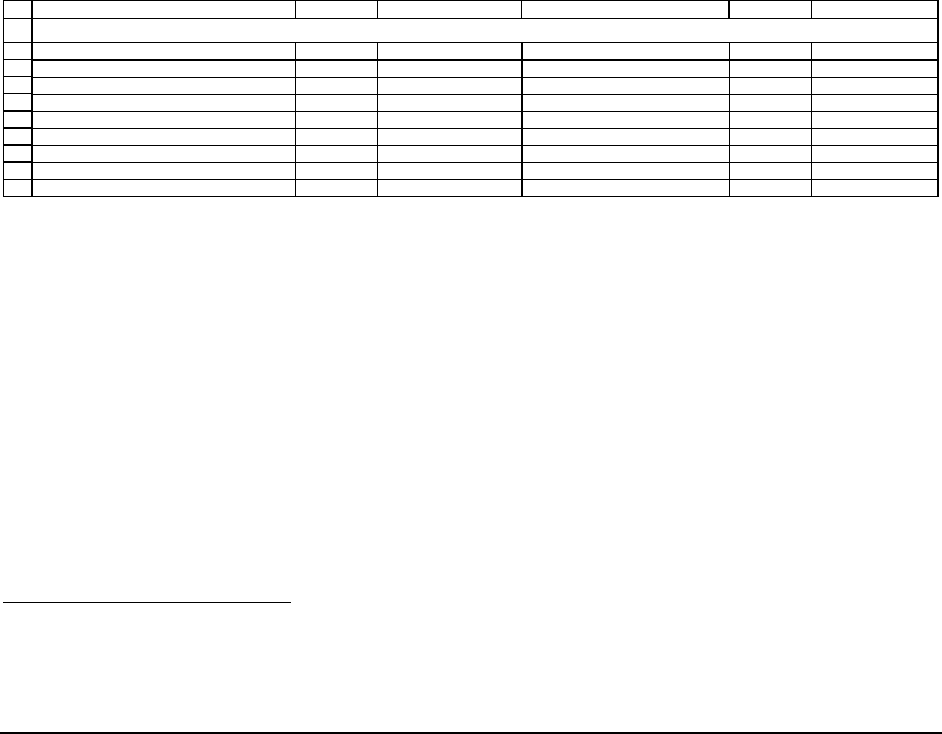
the case of Motherboard Shoes, the balance sheets at the end of 2004 look like:
1
2
3
4
5
6
7
8
9
10
ABCDEF
Assets Liabilities and equit
y
Cash and marketable securities 500,000 Accounts payable 3,750,000
Accounts receivable 2,500,000 Short-term debt 2,500,000
Inventories 3,750,000
Long-term debt 7,500,000
Fixed assets at cost 12,000,000
Accumulated depreciation -1,000,000 Common stock 1,000,000
Net fixed assets 11,000,000 Accumulated retained earnings 3,000,000
Total assets 17,750,000 <-- =B3+B4+B5+B9 Total liabilities and equity 17,750,000 <-- =SUM(E3:E9)
MOTHERBOARD SHOES, BALANCE SHEETS, END 2004
By the accounting definition of firm value, the firm is worth
Debt Stock Accumulated
retained earnings
Book value of equity
,
2,500,000 7,500,000 1,000,000 3,000,000
14,000,000
Firm value accounting definition Debt Equity
↑↑↑
↑
=
+
=+++
=
3
We don’t explain how to compute the WACC. See Chapters 6 and 15.

PFE, Chapter 9: DCF valuation with financial models page 9
The accounting definition of firm value relies on book values, the value of the firm’s debt
and equity as listed in the firm’s balance sheet. Recall from Chapter 7 that the accounting
definition, which is based on historical values, is a backward looking definition. The finance
definition of firm value is a forward looking definition (it discounts the future anticipated values
of the cash flows). John Mba thinks that the accounting definition gives an inappropriate
valuation, and he’s right.
4
In the case of Motherboard Shoes, the forward-looking DCF valuation
of the firm is $68,657,407 whereas the backward-looking accounting definition is $14,000,000.
9.2. Using the DCF valuation—summary
The DCF valuation of a firm is based on discounting the firm’s future expected free cash
flows (FCFs), using the weighted average cost of capital (WACC) as the discount rate. In this
section we summarize the steps for implementing this valuation, and in the next section we
illustrate a DCF valuation using a financial planning model we learned in Chapter 8.
Step 1: Estimate the weighted average cost of capital
The WACC is the discount rate for the future FCFs. We discussed the WACC in Chapter
6 and gave an example of how to estimate it.
5
In this chapter we will not go into the details of
estimating the WACC; calculating the WACC entails many assumptions and in many cases the
calculation itself becomes a topic of controversy among the parties involved in the valuation.
For this example, we assume that John Mba’s estimate of a 20% WACC is correct. In Section
4
Not to disparage accounting (very important) or accountants (most of whom would readily agree).
5
Later in the book, Chapter 15 gives another approach to estimating the WACC.

PFE, Chapter 9: DCF valuation with financial models page 10
9.3 we will perform some sensitivity analysis (using an Excel Data Table) to show how changes
in the WACC affect the valuation.
Step 2: Project a reasonable number of FCFs
A financial planning model’s predictions of future FCFs are based on the assumption that
the parameters of the model will not change by too much. Most financial analysts define
“reasonable” to mean number of periods over which this basic assumption is not too silly.
6
Everyone recognizes that a firm’s environment is dynamic and that the model parameters will
change over time, a fact that is usually addressed by doing sensitivity analysis (see section 9.4).
John has assumed that he can reasonably project the next 5 years of cash flows.
Step 3: Project the long-term FCF growth rate and the terminal value
Valuation using the DCF method in principle requires us to project an infinite number of
future FCFs, but in a standard financial planning model we project only a limited number of
FCFs. A solution to this problem is to define the firm’s terminal value as the firm value at the
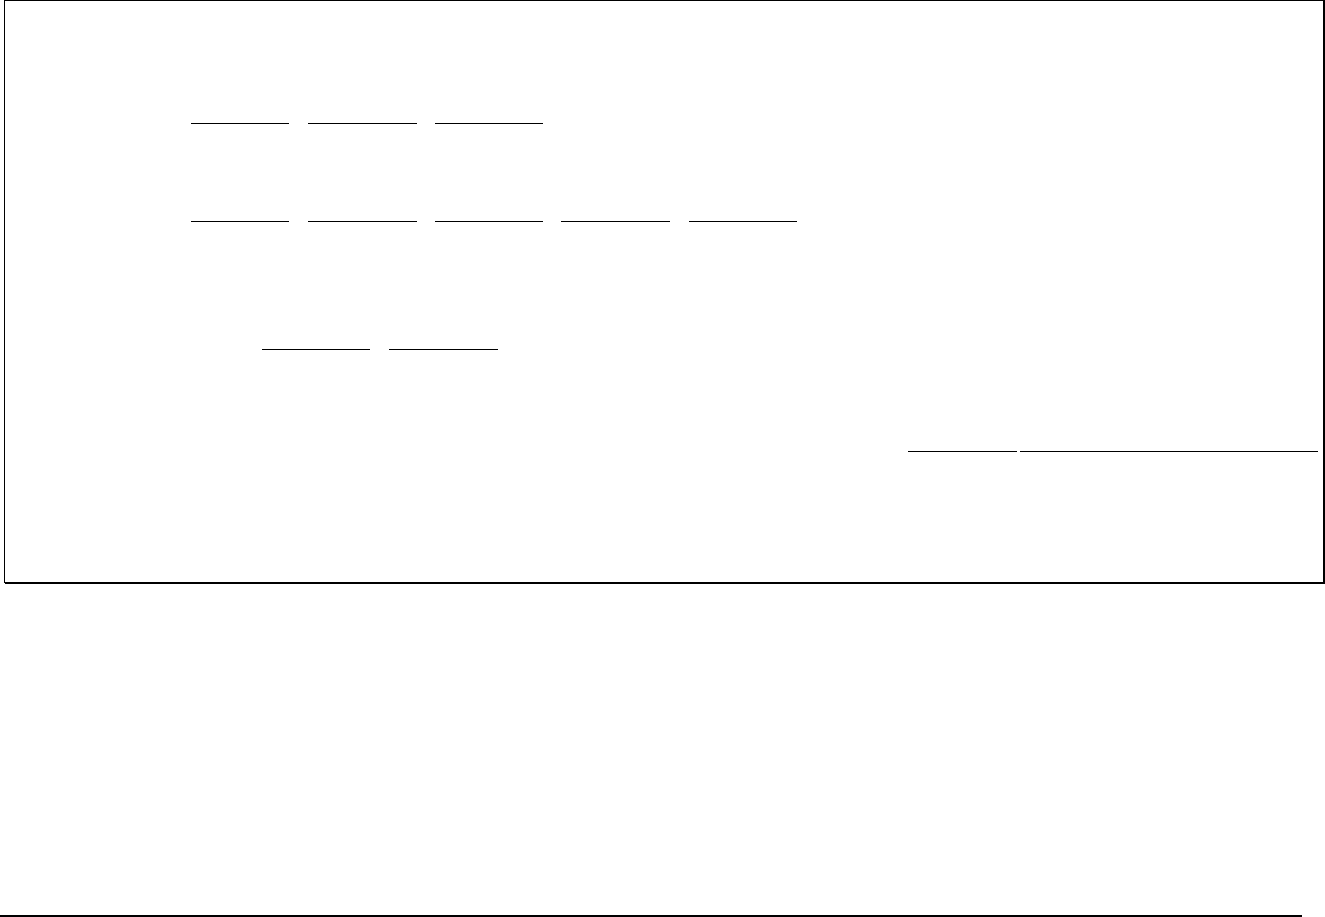
end of year 5. The definition John uses is contained in Figure 1.
6
The author defines “not too silly” as something he can explain to his mother with a straight face (and that she
won’t laugh at him).
PFE, Chapter 9: DCF valuation with financial models page 11
Schematic: DCF Valuation of the Firm
()
()()
()
()()
3
12
23
3
12 4
23
...
1
11
1
111
all future FCFs Current cash and
DCF firm value PV
discounted at WACC marketable securities
Current cash and
FCF
FCF FCF
marketable securities
WACC
WACC WACC
FCF
FCF FCF FCF
WACC
WACC WACC
⎛⎞
=+
⎜⎟
⎝⎠
=+ + ++
+
++
=+ + +
+
++
()()
()()
()
5
45
67
67
5
5
1: John Mba estimates these FCFs
1
with a financial planning model
. . . 2: John Mba uses the terminal
11
value in place of these numbers:
*1 -
1
1
FCF
Line
WACC WACC
FCF FCF
Line
WACC WACC
FCF long t
WACC
+←
++
+++ ←
++
+
+
()
This is the "terminal value"
-
3: The last term in the valuation
erm FCF growth
WACC long term FCF growth
Current cash and
Line
marketable securities
↑
−
+←
Figure 1: A DCF valuation

PFE, Chapter 9: DCF valuation with financial models page 12
As you can see, there are 3 parts to this valuation equation:
•
Line 1 is the present value of the first 5 years of free cash flows. John has projected these
cash flows one-by-one, using a financial planning model (details to come in Section 9.3).
•
Instead of projecting the present value of each of the cash flows in years 6, 7, 8, …,
infinity, John has chosen to summarize them in the present value of the terminal value.
In Line 2 this is given as
()
()
5
5
This is the "terminal value"
1
*1 -
-
1
FCF long term FCF growth
WACC long term FCF growth
WACC
↑
+
−
+
. Terminal value is what we
project the firm to be worth at the end of projection horizon. In Section 9.4 we explain
how this expression for the terminal value is derived. For now we assume that John’s
prediction of Motherboard’s terminal value is correct.
•
Line 3 gives the value of the cash and marketable securities.
The terminal value formula requires us to estimate the long-term FCF growth rate. In the
financial planning model for the Motherboard Shoes FCFs, this long-term growth rate is different
from the sales growth rate projected for the company’s next five years. As you will see in
Section 9.3, John projects a relatively high growth rate of sales of 10% for Motherboard over the
5 year horizon of the planning model. John’s criterion for choosing the long-term FCF growth
rate of the company is that a company’s cash flows cannot grow forever at a rate greater than the
economy in which it operates. He estimates that the long-term growth of the U.S. economy is 5
percent, and that this rate is also the long-term rate for Motherboard Shoes.
Using his model, John Mba estimates that Motherboard’s year-5 FCF is $13,029,110.
Using the WACC of 20 percent and the long-term FCF growth rate of 5 percent, the company’s
terminal value is $91,203,773:
()
()
*1 -
$13,029,110* 1 5%
5
$91,203,773
- 20% 5%
FCF long term FCF growth
Terminal value=
WACC long term FCF growth
+
+
==
−−
PFE, Chapter 9: DCF valuation with financial models page 13
Step 4: Determine the value of the firm
At this point all the elements of the firm valuation formula are in place:
•
WACC: the discount rate for the FCFs and the terminal value
•
Five years of FCFs projected from the financial planning model
•
The terminal value of the firm
•
The firm’s initial (year 0) balances of cash and marketable securities
We can now value the firm:
1
2
3
4
5
6
7
8
9
10
11
12
13
14
15
16
17
18
ABCDEF
Year 2005 2006 2007 2008 2009
Estimated free cash flow 9,210,135 10,052,522 10,966,397 11,956,842 13,029,110
Terminal value 91,203,773
Total 9,210,135 10,052,522 10,966,397 11,956,842 104,232,883
Weighted average cost of capital, WACC 20%
Enterprise value, PV of future FCFs + terminal value 68,657,407 <-- =NPV(B7,B5:F5)
Add current cash & marketable securities 500,000
Firm value 69,157,407 <-- =B9+B8
Subtract out debt
Short-term debt 2,500,000
Long-term debt 7,500,000
Estimated value of equity 59,157,407 <-- =B10-B13-B14
Number of shares 1,000,000
Estimated value per share 59.16 <-- =B15/B17
MOTHERBOARD SHOES--DCF VALUATION
The value of the firm is $69,157,407 (cell B9). In cells B15 and B18 we’ve added two
more steps:
Step 5: Value the firm’s equity by subtracting the value of the firm’s debt today
from the firm value
The firm value is the value of the firm’s debt + equity. We are often interested in valuing
only the firm’s equity—our estimate of the market value of the firm’s shares.

PFE, Chapter 9: DCF valuation with financial models page 14
$69,157,407
This means that
$69,157,407 $10,000,000 $59,157,407
Firm value Debt Equity
Equity Firm value Debt
=+ =
=−= − =
Stock market analysts often use the estimate of a firm’s equity value to arrive at a per-
share valuation of the firm. They then compare this estimated per-share value to the current
market price to come up with a buy or sell recommendation for the stock. Since Motherboard
Shoes has 1,000,000 shares outstanding, the estimated market value per share is
$59,157,407
$59.16
1,000,000
= .
This share valuation is higher than the current market value per share of $50. If the DCF
valuation analysis were being used to make recommendations about the stock, we would expect
the analyst would make a “buy” recommendation for the Motherboard Shoes. In this case the
analysis is used by John Mba to recommend that Motherboard be taken over for more than its
current price per share.
Step 6: Adding mid-year valuation
In Chapter 4 (page000) we discussed mid-year valuation of cash flows. The idea was
that when cash flows occur over the course of the year and not at the end of the year, we should
take the standard present value formula and multiply it by
(
)
0.5
1 WACC+ . For Motherboard
Shoes, mid-year valuation makes sense, since the company’s sales occur throughout the year and
not just at year-end. In the spreadsheet below you can see how mid-year valuation affects the
value of the firm and projected share valuation: Cell B8 shows that the present value of future
cash flows and terminal value firm value increases from $69 million to $75 million. In cell B18
you can see that the projected share value increases to $65.71.
PFE, Chapter 9: DCF valuation with financial models page 15
1
2
3
4
5
6
7
8
9
10
11
12
13
14
15
16
17
18
ABCDEF
Year 2005 2006 2007 2008 2009
Estimated free cash flow 9,210,135 10,052,522 10,966,397 11,956,842 13,029,110
Terminal value 91,203,773
Total 9,210,135 10,052,522 10,966,397 11,956,842 104,232,883
Weighted average cost of capital, WACC 20%
PV of future FCFs + terminal value 75,210,421 <-- =NPV(B7,B5:F5)*(1+B7)^0.5
Add current cash & marketable securities 500,000
Firm value 75,710,421 <-- =B9+B8
Subtract out debt
Short-term debt 2,500,000
Long-term debt 7,500,000
Estimated value of equity 65,710,421 <-- =B10-B13-B14
Number of shares 1,000,000
Estimated value per share 65.71 <-- =B15/B17
MOTHERBOARD SHOES--DCF VALUATION
using mid-year discounting (see cell B8)
Step 7: Don’t trust anything! Do a sensitivity analysis
Valuations are based on a formidable number of assumptions! When we do sensitivity
analysis, we evaluate the effect of changing values of the main variables on the value of the firm.
Our “weapon of choice” for sensitivity analysis is the
Data Table feature of Excel (see Chapter
30). We leave our demonstrations of sensitivity analysis for the next section.
9.3. Projecting the FCFs and doing the DCF valuation with a financial
planning model
So far we’ve shown how John Mba performs his valuation, but we haven’t shown the
financial planning model which produces the free cash flows. The model looks a lot like those
discussed in Chapter 8. Here it is, with the mid-year valuation discussed in the previous section:
PFE, Chapter 9: DCF valuation with financial models page 16
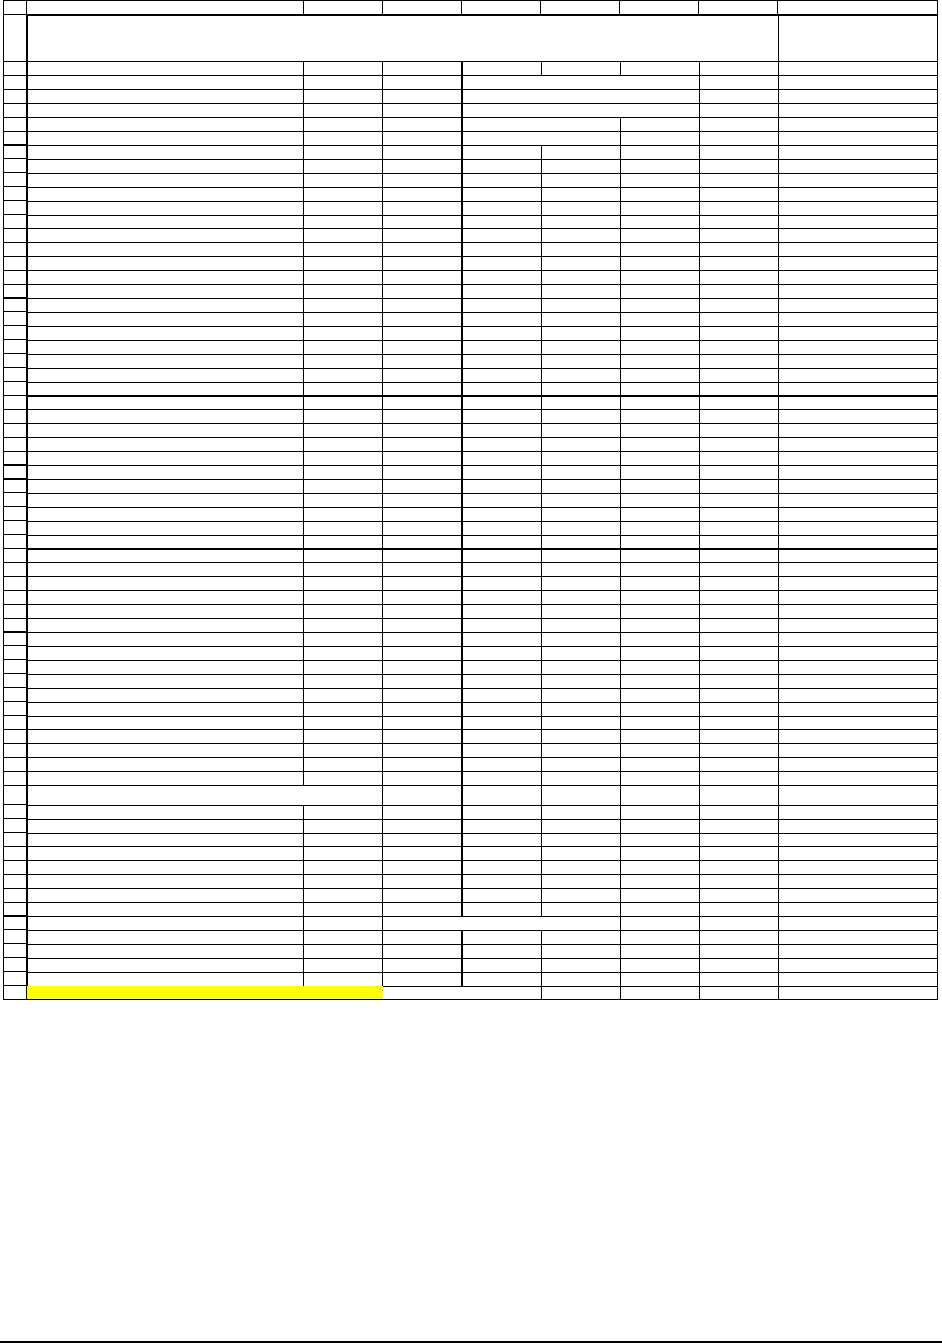
1
2
3
4
5
6
7
8
9
10
11
12
13
14
15
16
17
18
19
20
21
22
23
24
25
26
27
28
29
30
31
32
33
34
35
36
37
38
39
40
41
42
43
44
45
46
47
48
49
50
51
52
53
54
55
56
57
58
59
60
61
62
63
64
65
66
67
68
ABCDEFGH
Sales growth 10%
Current assets/Sales 25% Additional model assumptions:
Current liabilities/Sales 15% 1. Net fixed assets are assumed constant
Net fixed assets Constant 2. Debt principal is repaid by $1 million/year
Costs of goods sold/Sales 40% 3. Cash is the plug
Depreciation rate 15% 4. Mid-year discounting
Interest rate on debt 9.00%
Interest earned on cash balances 4.00%
Tax rate 35%
Dividend payout ratio 40%
Yea
r
012345
Income statement
Sales 25,000,000 27,500,000 30,250,000 33,275,000 36,602,500 40,262,750
Costs of goods sold (11,000,000) (12,100,000) (13,310,000) (14,641,000) (16,105,100)
Depreciation (1,945,946) (2,261,505) (2,628,235) (3,054,436) (3,549,749)
Interest payments on debt (855,000) (765,000) (675,000) (585,000) (495,000)
Interest earned on cash and marketable securities 102,653 279,954 482,274 711,756 970,697
Profit before tax 13,801,707 15,403,449 17,144,039 19,033,821 21,083,597
Taxes (4,830,598) (5,391,207) (6,000,414) (6,661,837) (7,379,259)
Profit after tax 8,971,110 10,012,242 11,143,625 12,371,983 13,704,338
Dividends (3,588,444) (4,004,897) (4,457,450) (4,948,793) (5,481,735)
Retained earnings 5,382,666 6,007,345 6,686,175 7,423,190 8,222,603
Balance sheet
Cash 500,000 4,632,666 9,365,011 14,748,686 20,839,126 27,695,704
Current assets 6,250,000 6,875,000 7,562,500 8,318,750 9,150,625 10,065,688
Fixed assets
At cost 12,000,000 13,945,946 16,207,451 18,835,686 21,890,121 25,439,871
Depreciation (1,000,000) (2,945,946) (5,207,451) (7,835,686) (10,890,121) (14,439,871)
Net fixed assets 11,000,000 11,000,000 11,000,000 11,000,000 11,000,000 11,000,000
Total assets 17,750,000
22,507,666 27,927,511 34,067,436 40,989,751 48,761,391
Current liabilities 3,750,000 4,125,000 4,537,500 4,991,250 5,490,375 6,039,413
Debt 10,000,000 9,000,000 8,000,000 7,000,000 6,000,000 5,000,000
Stock (1,000,000 shares, par value $1 each) 1,000,000 1,000,000 1,000,000 1,000,000 1,000,000 1,000,000
Accumulated retained earnings 3,000,000 8,382,666 14,390,011 21,076,186 28,499,376 36,721,979
Total liabilities and equity
17,750,000 22,507,666 27,927,511 34,067,436 40,989,751 48,761,391
Yea
r
012345
Free cash flow calculation
Profit after tax 8,971,110 10,012,242 11,143,625 12,371,983 13,704,338
Add back depreciation 1,945,946 2,261,505 2,628,235 3,054,436 3,549,749
Subtract increase in current assets (625,000) (687,500) (756,250) (831,875) (915,063)
Add back increase in current liabilities 375,000 412,500 453,750 499,125 549,038
Subtract increase in fixed assets at cost (1,945,946) (2,261,505) (2,628,235) (3,054,436) (3,549,749)
Add back after-tax interest on debt 555,750 497,250 438,750 380,250 321,750
Subtract after-tax interest on cash (66,725) (181,970) (313,478) (462,642) (630,953)
Free cash flow 9,210,135 10,052,522 10,966,397 11,956,842 13,029,110
Valuing the firm--using mid-year discounting
Weighted average cost of capital 20%
Long-term FCF growth rate 5%
Yea
r
012345
FCF 9,210,135 10,052,522 10,966,397 11,956,842 13,029,110
Terminal value 91,203,773 <-- =G59*(1+B56)/(B55-B56)
Total 9,210,135 10,052,522 10,966,397 11,956,842 104,232,883
NPV of row 80 75,210,421 <-- =NPV(B76,C81:G81)*(1+B76)^0.5
Add in initial (year 0) cash and mkt. securities 500,000
Enterprise value 75,710,421
Subtract out value of firm's debt today -10,000,000
Equity value 65,710,421
Value per share 65.71 <-- =B67/1000000
MOTHERBOARD SHOES, FINANCIAL MODEL
using mid-year valuation
Several features of the model used by John Mba to value Motherboard Shoes are:
•
Net fixed assets are assumed constant. John assumes that—as long as depreciation is
invested back into fixed assets—Motherboard Shoes will need no more fixed assets.
Another way of thinking about this assumption is that the major expenses incurred for
fixed assets are equal to the depreciation expenses. As you can see in row 30 of the