Pugnaire F.I. Valladares F. Functional Plant Ecology
Подождите немного. Документ загружается.

Physiologically based models were presented to explain the distribution of broad-leaved
evergreen species, and a number of ecological paradigms have been developed explaining the
nature of plant adaptation to MT climates (for a comprehensive account see Keeley 1989).
Nevertheless, strict climatic control of sclerophyll leaf morphologies is questioned by the
presence of sclerophyllous vegetation types in non-Mediterranean environments, for example,
chaparral in Arizona, heathland communities in eastern Australia (Specht 1979), fynbos-like
vegetation in the Afromontane region of Africa (Killick 1979), and tropical zone of Mexico
(Verdu
´
et al. 2003). Moreover, the majority of ecophysiological works dealing with drought
resistance of plants in Mediterranean ambient have been conducted on genera existing before
the Pliocene, that is, the establishment of true Mediterranean climate conditions (e.g.,
Ceratonia, Hedera, Olea, Phillyrea, Pinus, Quercus, Vitis). It is therefore difficult to interpret
the physiological and anatomical properties of these species as adaptive responses to Medi-
terranean ambient. The character syndromes in Mediterranean plants may largely be
explained in relation to the age of the lineage (Tertiary pre-Mediterranean vs. Quaternary
true Mediterranean) and thus do not represent convergent evolution. The role of nutrients in
species and ecosystem convergence was questioned in the 1980s (Kruger et al. 1983) based on
observations of the contrasting conditions between the oligotrophic soil conditions of South
Africa and Western and South Australia, and the relatively richer soil conditions of the other
three MTEs. The role of fire in convergence of traits was recently questioned by Lloret et al.
(2005), Pausas and Verdu
´
(2005), Keeley et al. (2006) and Pausas et al. (2006).
INDIVIDUAL AND ECOSYSTEM RESPONSES TO VARIABILITY
IN WATER RESOURCE
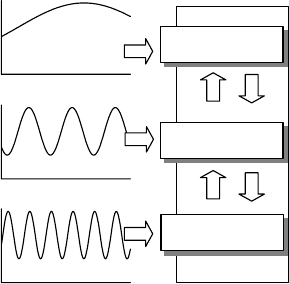
Among the numerous mechanisms for drought resistance, Mediterranean plant species have
three responses that act together to dampen the effects of variability in water resource
(Figure 9.1). Change in the leaf area allows the plants to cope with low-frequency oscillations
such as a decrease in the annual rainfall amount. The response of the root system dampens the
medium-sized oscillations, for example, changes in seasonal distribution of a given annual
rainfall distribution. Finally, the stomatal activity allows quasioptimization of water use at a
daily timescale. Any change in the leaf area induces change in the root system. The new
Water availability
Stomatal
conductance
Day
Month
Year
Rooting
pattern
Leaf area
FIGURE 9.1 Conceptual diagram in which we proposed to associate the main mechanisms of drought
resistance for Mediterranean plant species to the timescale of variations of the water availability from
day to year. Vertical up and down arrows suggest that the mechanisms do not act independently.
Francisco Pugnaire/Functional Plant Ecology 7488_C009 Final Proof page 290 10.5.2007 1:41pm Compositor Name: TSuresh
290 Functional Plant Ecology
functional equilibrium of the plant is controlled by carbohydrates and nitrogen or is hormo-
nally mediated. Any change in the soil water deficit produces a change in the stomatal closure.
The plant water status or a counterbalancing effect of phytohormones can act as indicators of
the root stress. So, each mechanism is linked with the one immediately preceding it, providing
an integrated strategy of the plant to improve its water balance under any given set of
conditions (Rambal 1993, 1995).
WATER UPTAKE
Rooting Depth
Studies on the root distribution of several Californian chaparral shrub species established that
deep root systems are characteristic for the dominant component of the Mediterranean-type
vegetation (Hellmers et al. 1955). However, when examined in detail, these species have been
shown to exhibit a great diversity in rooting depth (Kummerow et al. 1977) and consequently,
in response to drought stress (Poole and Miller 1975). Based on these results, Mediterranean
plant species can be roughly divided into two categories: deep-rooted species with root depth
greater than 2 m, and shallow-rooted species with rooting depths less than 2 m. Mediterra-
nean oaks are among the deepest-rooted plant species. For California oaks, Stone and Kalisz
(1991) and Canadell et al. (1996) reported roots deeper than 8.5 m for the evergreen Quercus
agrifolia (10.7 m), Q. dumosa (8.5 m), Q. turbinella (>9 m), Q. wislizenii (24.2 m), and the
deciduous Q. douglasii (24.2 m). Similar or higher values have been estimated for species of
the Chilean matorral (Lithrea caustica 5m,Quillaja saponaria 8 m) and of the chaparral
(Adenostoma fasciculatum 7.6 m). Lower values are found for dominant species of the
Mediterranean Basin (Pinus halepensis 4.5 m, Arbutus unedo 3.5 m) or of the Australian
mallee (Casuarina spp. >2.4 m, Banksia spp. 5 m). However, rooting depth is not the only
functional trait helping the plant to access soil water. Root cover that is the maximum
horizontal area colonized by the roots appears to be largely greater than the plant cover.
This trait is particularly crucial in interpreting tree densities in savanna-like ecosystems, such
as the ones we observed in dehesas of the Iberia peninsula (Moreno et al. 2005).
Soil Water Uptake Patterns
Deep root system as those presented earlier easily coped with low water availability. Rambal
(1984) distinguished in Q. coccifera four patterns of water uptake throughout a drying cycle
of 3 months (Figure 9.2). Late spring, water loss occurred exclusively from the top 0–50 soil
layer, which lost about 4% of store water per day. The upper meter supplied three-quarter of
the total. Early summer, root water uptake decreased in the upper layer, which then presents a
daily loss of 1.2% of its reserve. Peak of water uptake was between 2 and 2.5 m depth. This
layer supplied 0.62 mm day
1
of 2.64 mm day
1
of transpired water. Late summer was
characterized by unevenness of water loss. All the upper layers were depleted and only the
lower layers are able to supply water. During these two late periods, the deepest soil layers
were contributing as much water as the top. Early fall, at the end of the dry period, all the
layers were depleted. The flat profile did not allow the uptake of water at a rate greater than
0.62 mm day
1
. During the first three stages, the daily rates of transpiration were 2.84, 2.64,
and 2.35 mm, respectively. Talsma and Gardner (1986) for various Eucalyptus observed the
same patterning.
Rooting Patterns
In wet conditions, the major resistance to water uptake appears to be inside the root.
Consequently, there is a good correlation between water uptake and rooting density.
Francisco Pugnaire/Functional Plant Ecology 7488_C009 Final Proof page 291 10.5.2007 1:41pm Compositor Name: TSuresh
Functional Attributes in Mediterranean-Type Ecosystems 291
Hence, the late spring profile of water uptake we observed with Q. coccifera can be considered
as a picture of its root density profile. The greatest accumulation of root mass was in the top
meter. Below 1 m root mass decreased gradually with depth. The theoretical profile proposed
by Jackson et al. (1996) for the sclerophyllous shrub group does not take into account the
deep-rooted species we identified earlier. This sclerophyllous shrub group values included
values from some chaparral, fynbos, heath, garrigue, and matorral stands. The root distri-
bution with depth is described by the equation of Gale and Grigal (1987) y ¼1 b
z
, where y is
the cumulative root fraction from the soil surface to depth z (cm) and b is an extinction
coefficient. For this largely Mediterranean group b ¼0.964. This means that 67% of the root
biomass are in the first 30 cm of soil and 90% in the 0–60 cm layer. These surprisingly high
values are far to our estimates for Q. coccifera (48% for the 0–50 cm horizon, Rambal 1984)
or values for Q. turbinella (53% for the 0–60 cm horizon). In the two species, the percent of
roots deeper than 2 m were important (20% and 12%, respectively). Deep roots play a very
important role during the summer period. As the soil dries, the layers below 2 m contribute an
increasing fraction of the total water uptake, reaching between 12% and 23% of the total
uptake depending of the severity of the drought (Rambal 1984).
WATER LOSS
Stomatal Regulation
Together with rooting pattern and leaf area, stomatal activity helps regulate water loss.
According to their phenology, species may avoid or cope with water constraint. For instance,
drought-deciduous species of the coastal sage community of California are drought evaders
and chaparral species drought tolerators. Nevertheless, as stressed by Mooney (1989) ‘‘some
coastal sage species that lose most of their leaves during the drought have been shown to
tolerate very high water stress, whereas others somehow control stress while maintaining
many of their leaves.’’ Phenological variations among individuals could also be very high.
Ne’eman (1993) found in Q. ithaburensis, a deciduous oak of Israel, that some trees were
clearly deciduous, while others had only a short duration of leaflessness and, as a conse-
quence, could be considered as evergreen. By analogy, there appears to be a continuum of
stomatal behavior in response to water stress: no stomata closure, progressive closure of
4
3
2
1
From May 29 to June 12
AET = 2.84 mm day
−1
Soil depth (m)
From July 10 to July 24
AET = 2.64 mm day
−1
0 10 20 30
4
3
2
1
From July 31 to August 21
AET = 2.37 mm day
−1
Relative root uptake (% day
−1
)
Soil depth (m)
0 10 20 30
From September 18 to October 16
AET = 0.62 mm day
−1
Relative root uptake (% day
−1
)
FIGURE 9.2 Patterns of water uptake with soil depth within four periods across a severe summer
drought. For each 50 cm thick soil layer, the water uptake is expressed in percent of the extractable
water used daily.
Francisco Pugnaire/Functional Plant Ecology 7488_C009 Final Proof page 292 10.5.2007 1:41pm Compositor Name: TSuresh
292 Functional Plant Ecology
stomata (see Acherar et al. 1991 for Mediterranean oaks) and threshold effect leading to an
early complete closure (see Aussenac and Valette 1982 for Pinus sp pl.). With a rapid rate of
drying, for example, with a shallow-rooted system, an early response of stomata closure was
observed in some cases whereas a delayed response was observed when a slower rate of
drying, for example, with a deep-rooted system, was imposed. Studies such as those of Poole
and Miller (1975, 1981) showed that some chaparral species are more sensitive to water stress
than others, as indicated by their water potential after stomata closure. These authors assume
that the degree of drought tolerance is linked to rooting depth. Thus, shallow-rooted species
tend to close their stomata at high water potential and to bear tissues with the greatest
drought tolerance.
Stomatal closing is considered to be under the control of leaf turgor pressure or leaf water
potential. Recently, however, some authors showed that leaf conductance is not always
closely coupled with leaf water potential or leaf turgor pressure. There is now some evidence
that soil water deficit can also induce stomatal closure even when the leaf water status remains
unchanged. These results suggest that leaf conductance is not only affected by leaf water
potential, but also, more directly, by soil or root water potential. One much-discussed
possibility is that the counterbalancing effects of two phytohormones, cytokinin and abscissic
acid, might provide information on the water status of the roots and induce stomatal closing
or opening, as the case may be (Zhang et al. 1987). But, for modeling purposes, the leaf water
status still remains the main control variable of the leaf stomatal conductance (Tardieu and
Davies 1993).
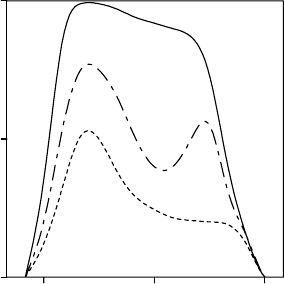
Daily curves of stomatal conductance in MTE species can be coarsely classified according
to three patterns following Hinckley et al. (1983) (Figure 9.3). Type 1 curves are bell-shaped
and represent situations in which soil water potential, leaf water potential, and vapor pressure
deficit do not limit stomatal conductance. Type 2 curves have two maxima, one at the start of
the day and the other in the afternoon, both separated by a depression at midday. They
correspond to situations where one or more of the previously mentioned factors limit
stomatal conductance. In type 3, the curves have a high point only at the start of the day as
6 12 18
0.0
0.5
1.0
Time
(h)
Relative stomatal
conductance
FIGURE 9.3 Typical patterns describing the daily courses of relative stomatal conductance during a
drought period. Type 1 curve is bell-shaped and represents optimal situations in which soil water
potential, leaf water potential, and vapor pressure deficit do not constraint transpiration. Curve of
type 2 has two maximums, one early in the morning and the other in midafternoon, both separated by
the so-called midday depression. They correspond to situations where water status and air dryness limit
stomatal conductance. In type 3, the curve shows only a maximum early in the morning. Leaf water
potential is at or below the turgor loss point for most part of the daylight period.
Francisco Pugnaire/Functional Plant Ecology 7488_C009 Final Proof page 293 10.5.2007 1:41pm Compositor Name: TSuresh
Functional Attributes in Mediterranean-Type Ecosystems 293

the leaf water potential of the plants, according to Hinckley, at or below the turgor loss point
for part of the day. The midday stomatal closure was reported by Tenhunen et al. (1987) for
many Mediterranean species. This drop in stomatal conductance has been interpreted as a
feature, which allows Mediterranean species to limit water loss when the atmospheric eva-
poration is at its maximum. These authors suggested that midday stomatal closure is deter-
mined by the leaf-to-air vapor pressure deficit, whereas for Hinckley et al. (1983), this
depends on the interaction among several factors, in particular the instantaneous water
potential of the plant. Cowan and Farquhar (1977) showed theoretically how stomatal
activity helps optimize water use on a daily timescale. This optimization pattern has been
validated for few Mediterranean species (William 1983, see also Xu and Baldocchi 2003).
Leaf Area Index
The importance of adjustment in leaf area is emphasized by Passioura (1976): ‘‘It is the
control of leaf area index and morphology which is often the most powerful means a
mesophytic plant has for influencing its fate when subject to long term water stress in the
field.’’ Over a large range of climates, changes in leaf area indices have been studied at both
individual and ecosystem scale along gradients from higher to lower rainfall amounts or from
more moisture to drier habitats in broad- or needle-leaf tree or shrub communities (Ladiges
and Ashton 1974, Specht and Specht 1989). In Southern Australia, Eucalyptus viminalis
trees occur over a wide range of rainfall conditions and soil types. Ladiges and Ashton
(1974) observed that at moist sites mature trees are tall and produce large leaves and, at
drier sites, trees are shorter and tend to produce smaller leaves. Poole and Miller (1981) hold
a similar view for Mediterranean shrub species of the California chaparral: ‘‘the main
response of the shrubs to different precipitation regimes in the chaparral range is to change
leaf-area index, not physiological parameters.’’ The importance of this adjustment is largely
species-dependent. The ranges of leaf-area index of some mature frequent MTE are summa-
rized in Table 9.3. Understanding how the leaf-area index of a site comes into a predictable,
dynamic equilibrium with the amount of water available is the target of researches in
ecohydrology (Eagleson 2002, Eamus et al. 2006).
WATER TRANSFER
Soil–Plant Resistance to Water Flow
A simple application of Ohm’s Law analogy relating water potential difference from soil-to-
leaf (DC) and transpiration rate (T ) has been widely used to estimate total flow resistance (R)
TABLE 9.3
Leaf Area Index Ranges of Mature Stands of Some Frequent Vegetation Types
Vegetation Type Dominant Species LAI Range References
Woodland Quercus ilex (evergreen) 2.9–6.0 Damesin et al. (1998a)
Woodland Quercus pubescens (deciduous) 2.0–4.2 Damesin et al. (1998a)
Shrubland Quercus coccifera (evergreen) 1.5–4.0 Rambal and Leterme (1987)
Chaparral Adenostoma fasciculatum 2.2–3.4 Rambal (2001)
Ceanothus megacarpus 1.5–1.6 Rambal (2001)
Warm-temperate mallee Eucalyptus spp. 1.5–6.0 Specht and Specht (1989)
Heathland south Australia Eucalyptus spp. 2.5–4.0 Rambal (2001)
LAI, leaf area index.
Francisco Pugnaire/Functional Plant Ecology 7488_C009 Final Proof page 294 10.5.2007 1:41pm Compositor Name: TSuresh
294 Functional Plant Ecology
expressed on a leaf-area basis: DC ¼TRassuming firstly, little capacitance effect in the plant,
and secondly, steady-state transpiration conditions. The pathway of water movement in soil
and plant can be considered as comprising two main resistances in series, the soil-to-root
resistance and the plant resistance. Partitioning soil and plant resistance is difficult. Gener-
ally, the plant resistance was assumed to be constant within a range of C and so, the relative
contribution of the soil resistance was estimated. For this, we applied Gardner (1964) who
had showed that soil resistance is inversely proportional to the hydraulic conductance of the
soil. As a consequence, the soil resistance is small at high water content and any observed
difference in resistance should be largely attributable to differences in plant resistance. Under
conditions of maximal transpiration (T
max
) in well-watered conditions: DC
max
¼T
max
R
min
.
Studying a large range of evergreen oak communities, we deduced a hierarchy of soil-to-leaf
resistance from the highest R
min
in xeric sites to the lowest in mesic sites (Rambal 1992). Thus,
for Q. ilex alone the ratio of xeric=mesic R
min
is 1.7. The presence and magnitude of
differences in resistance suggest that this attribute could be an important component in
drought tolerance. In the same way, Rambal and Leterme (1987) associated a decrease of
leaf area index from 2.5 to 1.5 in the Mediterranean evergreen oak Q. coccifera growing
across a rainfall gradient with changes in canopy structure and plant resistance. The role of
the hydraulic resistance in the relative sensing of soil water deficit by roots has been empha-
sized. At a given rate of transpiration and soil water deficit, a plant with high hydraulic
resistance lowers its leaf water potential to a greater degree than a plant with low resistance.
This plant may further be more sensitive to maintain its rate of photosynthesis and growth.
On the other hand, with a limited volume of water in the soil, an increase in hydraulic
resistance saves water during the wetter periods for use during the drier ones.
Patterns of Changes in DC with Increasing Water Stress
Richter (1976) observed that plant species ‘‘from sites with pronounced drought periods’’ did
not undergo C lower than that of desert plants. His analysis, for the first mentioned group, is
largely based on works of Duhme (1974) conducted on 26 species of MTEs. In this study,
Duhme measured C of 4.4 MPa for Q. coccifera, a similar value of those we reported in a
synthesis on Mediterranean evergreen oaks (Rambal and Debussche 1995). In this synthesis,
whatever the study site and the amount of rain fallen during the measurement periods,
minimum and predawn leaf water potentials were always higher than 4.4 and 3.8 MPa.
Other examples well illustrated this assumption of lower bound of water stress even during a
very dry year. Griffin (1973) observed at the end of the driest in 32 year period predawn
potentials of the evergreen Q. agrifolia, in the more xeric location, between 2.5 and 3.1 MPa.
These potentials remained also limited with the deciduous Q. douglasii and Q. lobata, 3.7 and
2.0 MPa, respectively (see also Damesin and Rambal 1995 for Q. pubescens values).
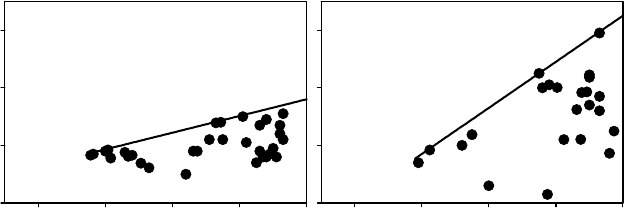
Nevertheless, the trajectories followed by minimum and predawn leaf water potentials to
reach their limits were very different according to locations and species. This was particularly
true for Q. ilex (Figure 9.4). DC decreased to zero with decreasing soil water availability and
predawn potential. As proposed by Ritchie and Hinckley (1975) ‘‘it is tempting to compare
species based on these curves (. ...) as indicators of species differences.’’ Waring and Cleary
(1967) on Douglas fir first observed this pattern. But it was initially considered as marginal.
Indeed, Hickman (1970), from measurements done on 44 species, concluded that the opposite
pattern in which DC increases with the water stress is the most common pattern. It corres-
ponds to species characterized as conformers. Species with the same pattern as our observa-
tions was named regulators. Hickman (1970) suggested ‘‘this pattern is probably typical of
most plant species in areas with modified (?) Mediterranean climates.’’ It was also described
by Aussenac and Valette (1982) for some trees (Cedrus atlantica, Pinus sp pl., Q. pubescens,
and Q. ilex) and for the shrub Buxus sempervirens.
Francisco Pugnaire/Functional Plant Ecology 7488_C009 Final Proof page 295 10.5.2007 1:41pm Compositor Name: TSuresh
Functional Attributes in Mediterranean-Type Ecosystems 295
An important question is asked by Reich and Hinckley (1989): ‘‘Does soil-to-leaf
hydraulic conductance decrease with decreasing soil moisture due only to increased resistance
in the soil, or is there a plant component as well?’’ (see also Bucci et al. 2005 for a substantial
account). Changes in plant resistance under water limitation are attributable to effects on
both roots and stems. As the soil dries, decreased permeability by root suberization and
increased fine root mortality can reduce the balance between extraction capacity and tran-
spiring leaf area. Xylem loss of vascular transport by cavitation might also cause an increase
in plant resistance. There was evidence of embolism formation in Temperate and Mediterra-
nean Quercus, one of the most common genera with ring-porous xylem anatomy (Cochard
and Tyree 1990). For 1 year old twig segment of Q. ilex, the loss of conductivity began at
1.8 MPa and linearly increased to reach a total xylem cavitation at 4.35 MPa (Lo Gullo
and Salleo 1993). When catastrophic xylem dysfunction occurs, Tyree and Sperry (1988)
showed that minor branches begin to die, leading to a loss of leaf area and a reduction in the
water flow, which improved water balance of the remaining living stems. Anatomical resist-
ance to the formation and spread of air embolisms in the xylem may be of critical importance.
There are a variety of features of xylem anatomy, which can increase the safety of water-
conducting systems in Mediterranean species (Carlquist 1989). Vasicentric tracheids adjacent
to many vessels act as subsidiary conducting system and occur in numerous Mediterranean
genera such as Quercus, Arctostaphylos, Phyllirea, Rhus, and Banksia. Vascular tracheids also
provide conductive tissues at high stress and are present in drought-deciduous and ericoid
evergreen species such as Cistus, Erica.
Hydraulic Architecture
Zimmermann (1983) introduced the principle of plant segmentation stating that embolism
should develop first in the terminal part of the trees (i.e., leaves and little branches), thus
preserving the other parts of the crown from embolism damage. The risk of xylem dysfunc-
tion especially in the petioles may determine the ability to resist to drought. Are Mediterra-
nean species less vulnerable than other species? Cochard et al. (1992) and Higgs and Wood
(1995) compared drought susceptibility by examining hydraulic dysfunction of the xylem
Camp Redon
−4 −3 −2 −1 0
0
1
2
D⌿
3
⌿
pd
Puéchabon
−4 −3 −2 −1 0
⌿
pd
FIGURE 9.4 Scatter plots relating predawn leaf water potential C
pd
, MPa, and DC, that is predawn
minus minimum potential from the same day, MPa. The boundary solid line gives information on how
DC declines with the drought. The data from Camp Redon (southern France) correspond to data from
mature Quercus ilex trees growing in mesic conditions on a deep soil; those from Pue
´
chabon (southern
France) have been obtained on the same oak species growing in dry xeric conditions on karstic soil. In
this location, Q. ilex functions as an isohydric plant (slope of DC vs. C
pd
1) that can maintain nearly
constant leaf water potential throughout the year despite changes in soil conditions.
Francisco Pugnaire/Functional Plant Ecology 7488_C009 Final Proof page 296 10.5.2007 1:41pm Compositor Name: TSuresh
296 Functional Plant Ecology
vessels in petioles of different oak species. The Mediterranean species (Q. pubescens, Q. cerris)
did not show the lowest vulnerability (nor the highest) to embolism formation in comparison
to the temperate ones (Q. petraea, Q. robur, Q. rubra). Early leaf senescence was also observed
near 4 MPa on the Californian deciduous oak Q. douglasii (Griffin 1973); whereas all
leaves of the deciduous Q. pubescens were yellowing at about 4.5 MPa in the Languedoc
(Damesin and Rambal 1995). There is also some difference between Mediterranean species
for their vulnerability to cavitation—partly explained by the distribution of xylem conduit
diameter—which can be related to their different distribution within the Mediterranean
Basin (Salleo et al. 1997, Cavender-Bares et al. 2005). As quoted by Preston et al. (2006),
wood density and vessel characteristics are functionally interrelated but wood density was
most strongly associated with soil water, and vessel traits showed contrasting relationships
with plant height.
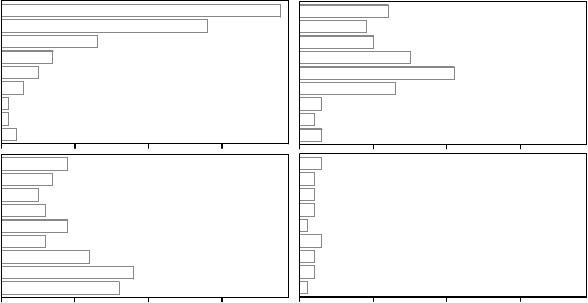
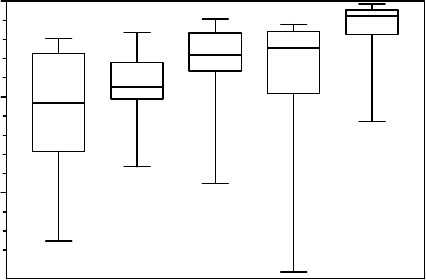
Maherali et al. (2004) compiled a database of 167 species and examined relationships
among resistance to xylem cavitation and water transport capacity measured by the specific
conductivity per unit of xylem area. For the Mediterranean woody species of this meta-
analysis (Figure 9.5), we found mostly chaparral shrub species (Ceanothus and Adenostoma
spp.) and some dominant trees growing around the Mediterranean Sea (Quercus spp.).
Medians of C
50
for species occurring in the more arid environments were 6–7 times more
negative than those growing in tropical rain forest. The C
50
medians are 5.3, 4.5, 2.8,
2.4, and 0.8 MPa for Mediterranean, desert, temperate forest, tropical dry forest, and
tropical rain forest, respectively. Resistance increased significantly with decreasing precipita-
tion and with the ratio of precipitation to potential evapotranspiration in evergreen angio-
sperms. The adaptive significance of increased resistance to cavitation with decreased
precipitation as a mechanism of drought tolerance is of primary importance in such species
because they need to preserve a water-conducting pathway for leaves year around. In
contrast, Maherali et al. (2004) did not find association between water transport capacity
and water availability suggesting that the evolutionary basis for a trade-off between cavita-
tion resistance and water transport capacity is rather weak.
Medit. Desert Temp.
forest
Trop.dry
forest
Trop.wet
forest
−10
−5
0
⌿
50
(MPa)
FIGURE 9.5 Box and whisker plots for the distribution of vulnerability to water stress-induced cavita-
tion (as determined by plant water potential at which 50% cavitation occurred, C
50
) for 167 woody
species grouped into five vegetation types (after Maherali et al. 2004). The number of species for
the vegetation types are 16, 20, 71, 19, and 41 for Mediterranean, desert, temperate forest, tropical
dry forest, and tropical rain forest, respectively. The corresponding medians are 5.3, 4.5, 2.8, 2.4,
and 0.8 MPa.
Francisco Pugnaire/Functional Plant Ecology 7488_C009 Final Proof page 297 10.5.2007 1:41pm Compositor Name: TSuresh
Functional Attributes in Mediterranean-Type Ecosystems 297
CARBON ASSIMILATION: LEAF PHOTOSYNTHETIC PERFORMANCES
A
SSIMILATION IN RELATION TO ENVIRONMENTAL CONDITIONS
Net CO
2
Assimilation in Optimal Conditions
The photosynthetic performance of Mediterranean species does not differ particularly from
that of species from other biomes (Rambal 2001). For example, in the genus Quercus,
Damesin et al. (1998a) analyzing the literature found that the Mediterranean species do not
differ in their maximum assimilation—mean value of 16.3 mmol m
2
s
1
calculated over five
species—from non-Mediterranean species—mean value of 17.2 mmol m
2
s
1
calculated over
five species. Numerous studies have been conducted concerning species of the Californian
chaparral and the Chilean matorral (Oechel et al. 1981) on the South African fynbos
(Mooney et al. 1983, Van der Heyden and Lewis 1989) and on the shrublands and woodlands
around the Mediterranean Sea (Tenhunen et al. 1987, Damesin et al. 1998a). Differences have
been demonstrated between growth forms (Oechel et al. 1981) or guilds, and between restoid–
ericoid and proteoid species (Van der Heyden and Lewis 1989). A robust relationship between
nitrogen content of the leaves and their photosynthetic capacities has often been found in
natural vegetation for a wide variety of plants (Wright et al. 2005). This correlation appears to
be a consequence of the limitations on photosynthetic capacity imposed by the levels of the
enzyme RuBP carboxylase and of the pigment–protein complexes. Mediterranean species do
not deviate from this rule (Field 1991).
This relationship holds for species with low nitrogen content as observed with 36 ever-
green sclerophyllous species growing at two sites in the coastal and mountain fynbos of South
Africa. Herppich et al. (2002) averaged mass-based leaf nitrogen content of 0.52 + 0.13,
0.76 + 0.18, 0.55 + 0.10, 1.00 + 0.29 for proteoid, ericoid, restioid, and other sclerophylls
in their coastal location and 0.74 + 0.13, 1.29 + 0.24, 0.60, 1.08 + 0.31 for the same groups in
their mountain location. They found a unique linear relationship between maximal light-
saturated photosynthesis and nitrogen content for all the species except the coastal proteoid.
Coastal proteoid too displayed a linear relationship with a steeper slope, that is, more
photosynthesis with the same amount of nitrogen. Evergreen species might allocate less N
to photosynthetic functions or they might allocate the same amount of N to photosynthetic
functions but allocate that N inefficiently (Warren and Adams 2004).
Response to Water Constraint and Photoprotection
Mediterranean climate leaves have to cope with excess intercepted solar radiation when
carbon assimilation is limited either by stomatal closure or a decrease of photosynthetic
capacity due to water stress and high temperatures (summer) or low temperatures (winter).
Indeed, absorption of light energy may be in excess of that required for carbon fixation and
may result in damage to the photosystem. Different physiological regulatory mechanisms
have been shown to occur during diurnal cycles to dissipate the excess of absorbed energy
without any damage for cells: a downregulation of photosynthesis via a decrease of the
photochemical efficiency of PSII (F
v
=F
m
) (Demmig-Adams et al. 1989, Damesin and
Rambal 1995, Faria et al. 1996, Me
´
thy et al. 1996) or via a decrease of chlorophyll content
(Kyparissis et al. 1995), a change in the components of the xanthophyll cycle, a high
antioxidative potential (Faria et al. 1996). It is difficult to assess if Mediterranean species
have a more efficient photoprotection mechanism than temperate or tropical species. In
particular, it would be interesting to examine if the Mediterranean species responses to high
irradiance are acclimation or adaptation. On that account, a great proportion of the plant
species growing in MTE produce and accumulate volatile organic compound (VOC) which
may also serve as an excess energy dissipation system during a period of restricted growth
Francisco Pugnaire/Functional Plant Ecology 7488_C009 Final Proof page 298 10.5.2007 1:41pm Compositor Name: TSuresh
298 Functional Plant Ecology
(Kesselmeier and Staudt 1999) although several studies pointed out that there is not neces-
sarily a specific role for every VOC emitted (see Pen
˜
uelas and Llusia 2004 for a comprehensive
account on this subject).
Modeling
Functioning at the biochemical level of the photosynthetic system, described by Farquhar and
von Caemmerer (1982), can be summarized by both maximum carboxylation V
cmax
and
electron transport rates J
max
. Mediterranean species fit in with the general scheme in terms
of this functioning, if reference is made to the few Mediterranean species included in
Wullschleger’s (1993) review, although this author did not propose a separate grouping for
these species. They do not deviate significantly from the empirical linear relation between
V
cmax
and J
max
that he observed. Other data support this trend for Mediterranean oaks and
Arbutus unedo (Hollinger 1992, Damesin et al. 1998a). This leaf photosynthesis model can be
next integrated in a canopy level carbon balance model (Hollinger 1992, Sala and Tenhunen
1996). Relations between stomatal conductance (g
s
) and assimilation (A) could be simulated
following the empirical model proposed by Ball et al. (1987). That is the so-called coupled
photosynthesis Ball–Berry stomatal model
g
s
¼ g
0
þ g
fac
AR
h
C
a
,
in which A is net assimilation rate (mmol m
2
s
1
), g
0
is a value representing the stomatal
conductance when A ¼0 at the light compensation point (generally set to about 10 mmol
m
2
s
1
), g
fac
is a dimensionless empirical factor expressing the relation of g
s
to A, to relative
humidity at the leaf surface R
h
(decimal fraction), and to CO
2
concentration at the leaf
surface C
a
(mmol mol
1
).
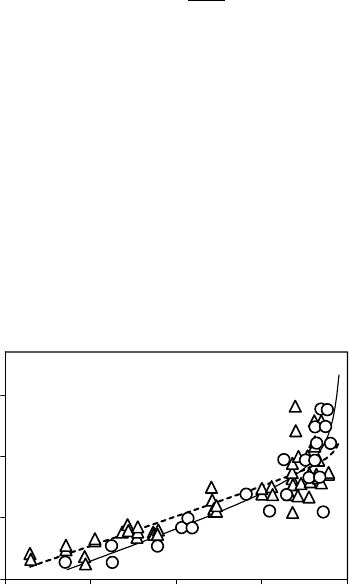
The functional dependency of g
fac
on predawn leaf water potential (C
pd
) was measured in
the field for Q. ilex (Sala and Tenhunen 1996) and Q. pubescens (Damesin and Rambal 1995).
Both studies showed linear relationships for C
pd
equal or lower than 1 MPa, that is, during
periods of reduced water availability (Figure 9.6). Xu and Baldocchi (2003) observed a strong
correlation between g
s
and AR
h
=C
a
during the growing season in Quercus douglasii. They
suggested that leaf age and severe water stress did not alter g
fac
; a constant g
fac
of 8–10 seems
typical for oaks (Goulden 1996, Xu and Baldocchi 2003). However, the effect of decreasing
−4 −3 −2 −1 0
0
10
20
30
⌿
pd
g
fac
FIGURE 9.6 Relationships between g
fac
and predawn water potential C
pd
for Quercus ilex and Quercus
pubescens. The data for the former oak species have been obtained by Sala and Tenhunen (1996) (empty
circle), and those for Q. pubescens by Damesin and Rambal (1995) (empty triangle up). For both data sets,
we fitted the equation g
fac
¼ (a=C
pd
) þ(bC
pd
þc). For Q. ilex (dotted), we obtained, a ¼0.31, b ¼4.76,
c ¼19.6, and r
2
¼0.76; for Quercus pubescens (solid line), a ¼1.64, b ¼4.97, c ¼17.35, and r
2
¼0.78.
Francisco Pugnaire/Functional Plant Ecology 7488_C009 Final Proof page 299 10.5.2007 1:41pm Compositor Name: TSuresh
Functional Attributes in Mediterranean-Type Ecosystems 299