Qiu X.G. (Ed.) High Temperature Superconductors
Подождите немного. Документ загружается.

412 High-temperature superconductors
1
2
3
4
5
6
7
8
9
10
1
2
3
4
5
6
7
8
9
20
1
2
3
4
5
6
7
8
9
30
1
2
3
4
5
6
7
8
9
40
1
2
43X
© Woodhead Publishing Limited, 2011
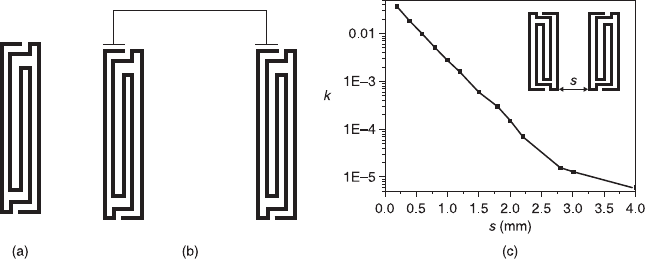
The resonator used in this filter is a spiral-in-spiral-out type resonator, as shown
in Fig. 10.14(a), which is slightly different from that shown in Fig. 10.8(f). The
main difference is that both ends of the microstrip line are embedded in the
resonator to form capacitance loading, further constraining the electric-magnetic
field. Moreover, the middle part of the microstrip line, which carries the highest
currents at resonance, was widened to increase the quality factor of the resonator.
The resonator with centre frequency of 1320 MHz is 10.64 mm long and 2.86 mm
wide. The cross-coupling needed for the transmission zeros can be introduced by
a microstrip line, as shown in Fig. 10.14(b). Figure 10.14(c) shows the simulated
coupling coefficient
κ
between two resonators, using a full-wave EM simulation
software Sonnet as a function of the space s. For the simulation, the substrate is
MgO with a thickness of 0.50 mm and permittivity of 9.65. It can be seen that
κ
decreases rapidly with s. When s changes from 0.2 mm to 3 mm (about a
resonator’s width), the coupling coefficient k becomes more than 3 orders of
magnitude less than its original value, making this resonator very suitable for the
design of an ultra-narrow bandpass filter.
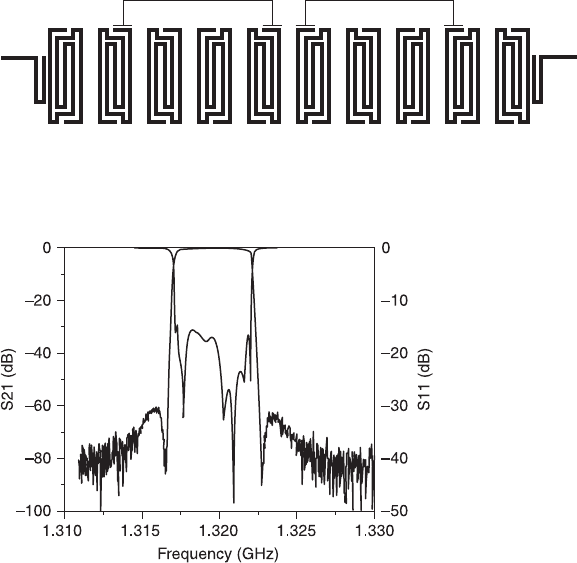
The filter layout was simulated and optimized using Sonnet, and the final layout
of the filter is shown in Fig. 10.15. The final full-wave EM simulated responses of
the filter are shown in Fig. 10.13 as solid lines. Comparing the full-wave EM
simulated responses with the synthesized theoretical responses, the out-of-band
responses are very similar. The passband response of the EM simulated return
loss is 21 dB, only slightly worse than the theoretical return loss of 22 dB.
The filter was then fabricated on a 0.5 mm thick MgO wafer with double-sided
YBCO films. The YBCO thin films have a thickness of 600 nm and a characteristic
temperature of 87 K. Both sides of the wafer are gold-plated with 200 nm thick
gold (Au) for the RF contacts. The whole dimension of the filter is
60 mm × 30 mm × 20 mm, including the brass housing. The RF measurement
10.14 The resonator used in the present work (a), the introduction of
cross coupling (b), and the simulated coupling coefficient k between
two adjacent resonators as a function of the separation space s.
Microwave filters using high-temperature superconductors 413
1
2
3
4
5
6
7
8
9
10
1
2
3
4
5
6
7
8
9
20
1
2
3
4
5
6
7
8
9
30
1
2
3
4
5
6
7
8
9
40
1
2
43X
© Woodhead Publishing Limited, 2011
was made using an HP 8510C network analyser and in a cryogenic cooler.
Figure 10.16 shows the measured results at 70 K and after tuning the filter. The
measured centre frequency is 1.319 GHz, and the return loss in the passband
is better than 15 dB. The insertion loss at the passband centre is 0.26 dB, which
corresponds to a filter Q of about 45 000. The transmission response is very similar
to the theoretically synthesized and the full-wave EM simulated responses, as
shown in Fig. 10.13. The fly-back values in the S21 curve are 60.7 dB and 62 dB
at the lower and upper frequency sides, respectively. Steep rejection slopes at the
band edges are obtained and rejections reach more than 60 dB in about 500 kHz
from the lower and upper passband edges.
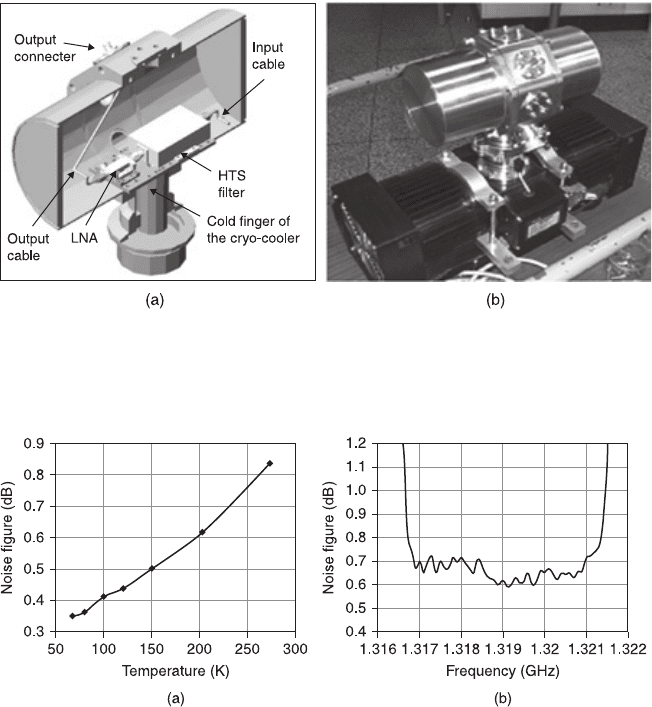
Combining this filter with a low noise amplifier (LNA), as well as a Sterling
cryo-cooler, an HTS subsystem was then constructed as shown schematically in
Fig. 10.17 (a). There are many types of cryo-coolers on the market which are
specially built for a long life under outdoor conditions in order to provide
high cooling power at a cryogenic temperature. What we chose for the HTS
wind profiler subsystem was Model K535 made by Ricor Cryogenic &
10.15 The final layout of the 10-pole quasi-elliptic filter (not to scale).
10.16 The measured response of the 10-pole filter at 70 K.
414 High-temperature superconductors
1
2
3
4
5
6
7
8
9
10
1
2
3
4
5
6
7
8
9
20
1
2
3
4
5
6
7
8
9
30
1
2
3
4
5
6
7
8
9
40
1
2
43X
© Woodhead Publishing Limited, 2011
Vacuum Systems, Israel, for its considerably compact volume and longer life time
(Fig. 10.17 (b)). The advantage of integrating the LNA with the HTS filter inside
the cryo-cooler is obvious, as the noise figure of LNA is temperature dependent
(Fig. 10.18 (a)). Since the cost of a cryo-cooler is inevitable for HTS filters, an
extra benefit of significant reduction of the noise figure can be obtained by also
putting the LNA in a low temperature without any new burden of cooling devices.
The noise figure of the HTS receiver front-end subsystem, measured using an
Agilent N8973A Noise Figure Analyzer at 65 K, is about 0.7 dB in the major part
(80%) of the whole passband, as shown in Fig. 10.18 (b).
10.17 Sketch (a) and photograph (b) of the HTS receiver front-end
subsystem.
10.18 Temperature dependence of the noise figure of the LNA used
in the HTS subsystem (a) and the noise figure of the HTS front-end
subsystem measured at 70 K (b).
Microwave filters using high-temperature superconductors 415
1
2
3
4
5
6
7
8
9
10
1
2
3
4
5
6
7
8
9
20
1
2
3
4
5
6
7
8
9
30
1
2
3
4
5
6
7
8
9
40
1
2
43X
© Woodhead Publishing Limited, 2011
10.5 Superconducting meteorological radar
10.5.1 Basic principle and configuration of wind profiler
A wind profiler is a type of meteorological radar that uses radar to measure vertical
profiles of the wind, i.e., detecting the wind speed and direction at various elevations
above the ground. The data synthesized from wind direction and speed is very
useful in meteorological forecasting and air quality monitoring for flight planning.
Pulse-Doppler radar is often used in wind profilers. In a typical profiler, the radar
can sample along each of five (or at least three) beams: one is aimed vertically to
measure vertical velocity, and four (or two) are tilted off-vertical and oriented
orthogonal to one another to measure the horizontal components of the air’s
motion. The radar transmits an electromagnetic pulse along each of the antenna’s
pointing directions. The length of the pulse emitted by the antenna determines the
volume of air illuminated by the radar beam. Small amounts of the transmitted
energy are scattered back and received by the radar. Delays of fixed intervals are
built into the data processing system so that the radar receives scattered energy
from discrete altitudes, referred to as range gates. The Doppler frequency shift of
the backscattered energy is determined and then used to calculate the velocity of
the air towards or away from the radar along each beam as a function of altitude.
The source of the backscattered energy is small-scale turbulent fluctuations that
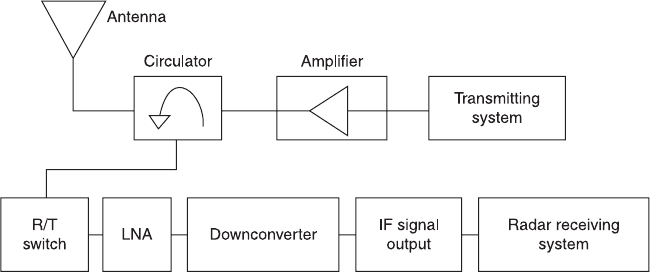
induce irregularities in the radio refractive index of the atmosphere. The circuit
diagram of a typical wind profiler is shown in Fig 10.19. The ‘transmitting system’
transmits a pulse signal through the antenna, and the echoes come back to the
‘downconverter’ through the LNA. The ‘radar receiving system’ analyses the
signal and produces wind profiles of the sky above the radar site.
The wind profiler measures the wind of the sky above the radar site in three
directions (i.e., the roof direction, east/west direction and south/north direction), and
produces corresponding wind charts. The collected wind chart data are then averaged
10.19 Circuit diagram of a typical wind profiler. IF, intermediate
frequency.
416 High-temperature superconductors
1
2
3
4
5
6
7
8
9
10
1
2
3
4
5
6
7
8
9
20
1
2
3
4
5
6
7
8
9
30
1
2
3
4
5
6
7
8
9
40
1
2
43X
© Woodhead Publishing Limited, 2011
and analyzed at 6 minute intervals so as to produce wind profiles. Typical wind
profiles are shown in Plate IV in colour section between pages 244 and 245. In the
profile, the horizontal axis denotes the time (from 5:42 am to 8:00 am with intervals
of every 6 minutes); the vertical axis denotes the height of the sky. The arrow-like
symbols denote the direction and velocity of the wind at the corresponding height
and in the corresponding time interval. The arrowhead denotes the wind direction
(according to the provision: up-north, down-south, left-west, right-east), and the
number of the arrow feather denotes the wind velocity (please refer to the legend).
The frequencies assigned to the wind profiler are in UHF and L band, which
are very crowded and noisy with radio, TV, and mobile communication signals
and therefore the radar is often paralyzed by the interference. This did indeed
happen, especially in or near the cities. For example, the wind profiles presented
in colour Plate IV are actually real observation data recorded by a weather station
in a suburb of Beijing. It is interesting to point out that the detecting range (or the
height above the radar) gradually got shorter (from 3000 m down to 1700 m or so)
after 6:30 am in the morning as people were getting up and more and more
mobile phones were switched on, indicating that the sensitivity of the radar was
affected by increasing interference (colour Plate IV (a)). Eight months later, rapid
growth in the number of mobile phones in Beijing caused the electromagnetic
environment to become much worse. This radar was blocked by the massive
interference noise and totally lost the ability to collect any reliable data, as shown
in colour Plate IV (b).
10.5.2 Laboratory tests of superconducting
meteorological radar
To solve the problem outlined above, it is necessary to employ pre-selective
filters. Unfortunately, due to the extremely narrow bandwidth (≤ 0.5 %), no
conventional device is available. The HTS filter can be designed to have a very
narrow band and very high rejection with very small loss, so it is expected that it
can help to improve the anti-interference ability of the wind profiler, without even
a tiny reduction of its sensitivity. In fact, because the LNA also works at a very
low temperature in the HTS subsystem, the sensitivity of the whole system will
actually increase. To prove this, two stages of experiments have been conducted
and the performance of the conventional wind profiler was compared with the
so-called HTS wind profiler, i.e., the corresponding part (the front-end, i.e., the
LNA) of a conventional radar was substituted by the HTS subsystem. The first
stage experiments are sensitivity comparison tests and anti-interference ability
comparison tests, conducted by measuring the sensitivity and the anti-interference
ability of the filters with quantitative instruments, such as a signal generator and
frequency spectrometer, etc. The second stage experiments are the field trail of a
superconducting meteorological radar with the conventional counterpart, which
will be introduced in the next section.
Microwave filters using high-temperature superconductors 417
1
2
3
4
5
6
7
8
9
10
1
2
3
4
5
6
7
8
9
20
1
2
3
4
5
6
7
8
9
30
1
2
3
4
5
6
7
8
9
40
1
2
43X
© Woodhead Publishing Limited, 2011
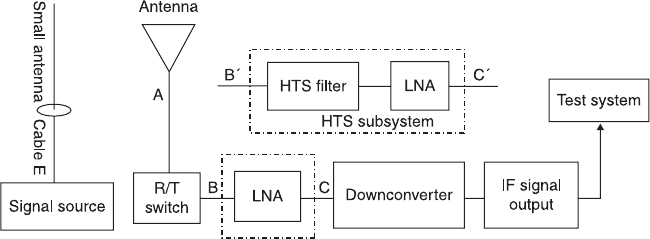
Sensitivity comparison experiments
The circuit diagram for the experiment is shown in Fig. 10.20. In this experiment,
an IFR2023B signal generator was used as a signal source, whose output
frequency was set to the wind profiler operating frequency. The signal is emitted
from a small antenna and received by the antenna of the radar system. The received
signal reaches the radar receiver front-end (in Fig. 10.20 between B and C) via the
R/T switch, then passes the down-converter and finally is converted as the
intermediate frequency (IF) signal. The IF signal is then sent to a frequency
spectrometer (HP E44118) and finally measured. The wind profiler’s sensitivity is
defined as the signal source output power (in dBm) when the measured signal-to-
noise ratio of the intermediate frequency signal is equal to 1.
During the experiment, the sensitivity of the conventional system was measured
first. Then the conventional front-end (i.e., the LNA, in Fig. 10.20 between B and
C) of the wind profiler was replaced by the HTS subsystem (in Fig. 10.20 between
B
'
and C
'
). Here an ‘HTS Filter + LNA’ configuration was used instead of a
‘LNA + HTS Filter’ configuration in order to avoid saturation of the LNA. Due
to the very small insertion loss of the HTS filter, this configuration should not
have any noticeable effect on the dynamic range of the LNA. The measured data
show that the sensitivity of the profiler employing HTS subsystem is –43.6 dBm,
the sensitivity of the system employing the conventional front-end is –39.9 dBm.
Thus, we find that the sensitivity of the HTS subsystem is 3.7 dB higher than that
of the conventional subsystem.
Anti-interference ability comparison experiments
The circuit diagram for the experiment is similar to that shown in Fig. 10.20. The
difference is that in this experiment the signal source was linked to point A,
bypassing the receiving antenna and introducing an interference signal with a
frequency of 1323 MHz. Similarly to the sensitivity comparison experiment, the IF
signal is monitored by a spectrum analyser while the interference signal is gradually
10.20 The circuit diagram for the sensitivity comparison experiment.
418 High-temperature superconductors
1
2
3
4
5
6
7
8
9
10
1
2
3
4
5
6
7
8
9
20
1
2
3
4
5
6
7
8
9
30
1
2
3
4
5
6
7
8
9
40
1
2
43X
© Woodhead Publishing Limited, 2011
increased. Anti-interference ability is defined as the power of the interference signal
(in dBm) when the IF output is about to increase. The measured data show that for
the conventional subsystem, an interference signal as low as –92.4 dBm has an
influence on the wind profiler, whereas for the HTS subsystem, the corresponding
value is –44 dBm. It can thus be concluded that the anti-interference ability of the
HTS subsystem is 48.4 dB higher than that of the conventional subsystem.
10.5.3 Field trail of superconducting meteorological radar
As previously mentioned, the wind profiler measures the wind in the air above the
radar site in three directions and produces the wind charts correspondingly. A
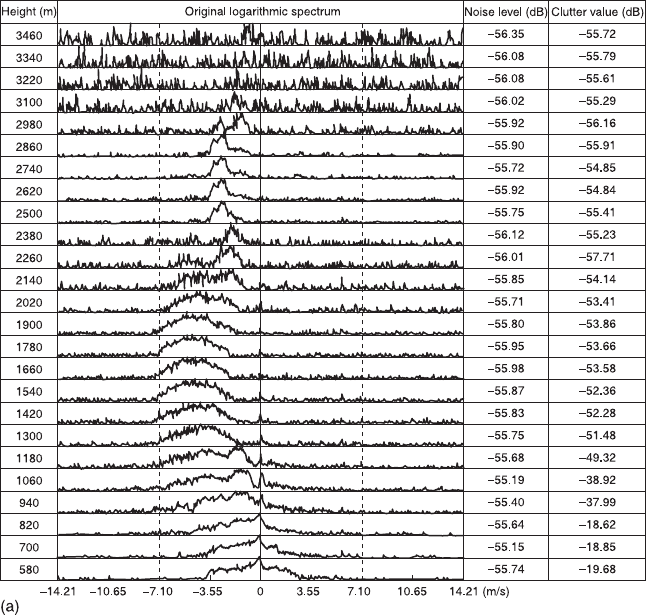
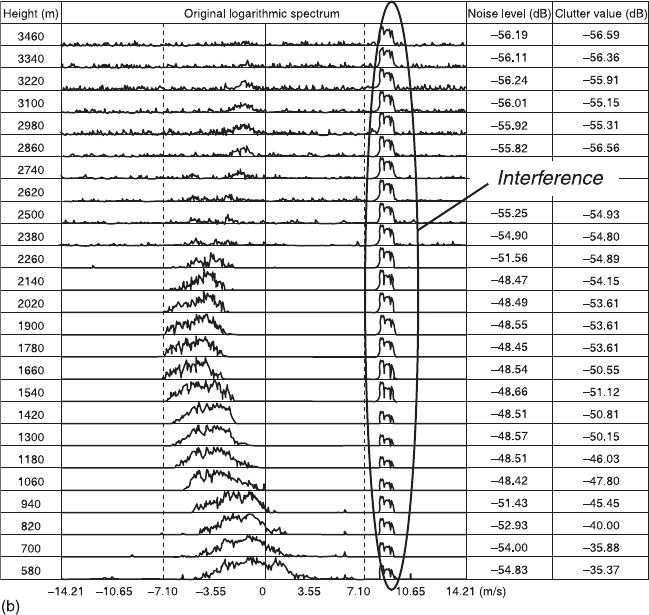
typical wind chart of the east/west direction is presented in Fig. 10.21, where the
horizontal axis is the wind velocity (m/s, corresponding to the frequency shift due
10.21 Wind charts produced by (a) using the conventional wind profiler
without interference, (b) using the conventional wind profiler with
interference (1322.5 MHz, –4.5 dBm), (c) using the HTS wind profiler
with interference (1322.5 MHz, +10 dBm).
Microwave filters using high-temperature superconductors 419
1
2
3
4
5
6
7
8
9
10
1
2
3
4
5
6
7
8
9
20
1
2
3
4
5
6
7
8
9
30
1
2
3
4
5
6
7
8
9
40
1
2
43X
© Woodhead Publishing Limited, 2011
10.21 Continued.
to the Doppler effect) and the vertical axis is the height of the sky above the radar
site (from 580 m to 3460 m with intervals of every 120 m) corresponding to the
time at which each different echo was received. The negative values of wind
velocity indicate a change in wind direction. Each curve in Fig 10.21 represents
the spectrum of the corresponding echo. The radar system measures the wind
charts of the sky above every 40 seconds. The collected wind chart data are then
averaged and analyzed at every 6 minutes, so as to produce the wind profiles.
The procedure of the second stage experiments (field trail) is as follows: firstly,
the wind charts and the wind profiles were measured using the conventional wind
profiler, without any interference signal. Then an interference signal with a
frequency of 1322.5 MHz and power of –4.5 dBm was applied and a new set of
wind charts and wind profiles were obtained. Finally, the wind charts and wind
profiles were measured using the HTS wind profiler (the LNA at the front end of
the conventional wind profiler being replaced by the HTS subsystem) with the
same frequency but much stronger (+10 dBm) interference signal.
420 High-temperature superconductors
1
2
3
4
5
6
7
8
9
10
1
2
3
4
5
6
7
8
9
20
1
2
3
4
5
6
7
8
9
30
1
2
3
4
5
6
7
8
9
40
1
2
43X
© Woodhead Publishing Limited, 2011
10.21 Continued.
It can be seen that a series of interference peaks appeared in the wind chart
measured using the conventional wind profiler while the interference signal was
introduced (Fig. 10.21 (b)). However, the wind charts produced by the HTS wind
profiler show no signs of being influence by the interference at all (Fig. 10.21 (c)),
even when a much stronger (up to +10 dBm) interference signal was applied.
Moreover, the HTS subsystem was able to detect wind up to a maximum height
of 4000 (Fig. 10.21 (c)), in contrast with more conventional systems, which reach
just 3400 metres (Fig. 10.21 (a) and (b)). This is consistent with the impression
that the sensitivity of the HTS radar system is higher than that of the conventional
system.
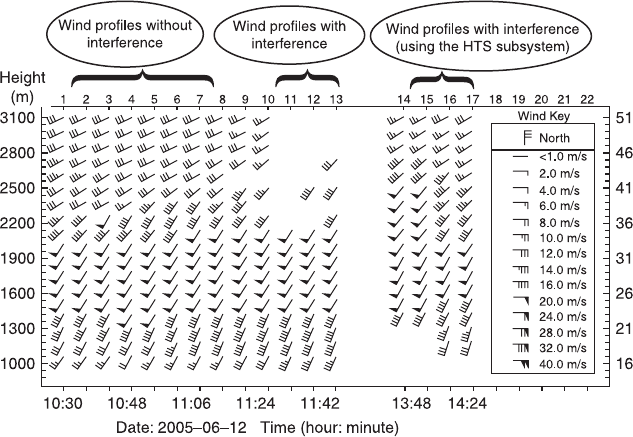
Figure 10.22 shows wind profiles produced from the wind charts, measured in
the same day by the conventional wind profiler and the HTS wind profiler,
respectively. It can be clearly seen that the conventional wind profiler cannot
Microwave filters using high-temperature superconductors 421
1
2
3
4
5
6
7
8
9
10
1
2
3
4
5
6
7
8
9
20
1
2
3
4
5
6
7
8
9
30
1
2
3
4
5
6
7
8
9
40
1
2
43X
© Woodhead Publishing Limited, 2011
attain wind profiles above 2000 m due to the influence of the interference signal,
which reproduced the phenomena observed in Fig 10.22. On the contrary, the
HTS wind profiler functioned well, even with a much serious interference signal.
10.6 Summary
The study of superconductivity at microwave frequency is important, not only
because of the information it provides about the fundamental nature of
superconductors, but also because of the potential applications of superconductors
in microwave devices.
Nowadays, the rapid developments of wireless communications, TV and radio
programmes, as well as different types of radars (aviation control, weather
forecast, etc.), have made the already very crowded frequency spectrum even
more severe. Advanced microwave devices with excellent performances (such as
better sensitivity, stronger anti-interference ability, etc.), are required to fulfil the
progressive demands of everyday life and to cope with the atrocious electromagnetic
environment. Due to their unique microwave properties, superconducting devices
have been applied in many areas. Of these passive microwave devices, the HTS
filter is the most popular and successfully used.
Based on the very small microwave surface resistance of HTS films, filters can
be constructed with a negligible insertion loss, a very large out-of-band rejection,
10.22 Wind profiles obtained under three different conditions by the
conventional wind profiler and the HTS wind profiler, respectively