RAND Corporation. Social Science for Counterterrorism
Подождите немного. Документ загружается.


Representing Social-Science Knowledge Analytically 405
Table 11.2
Relative Strengths of Theory-Informed and Atheoretical Empirical Work
Issue
Data-Driven
(Atheoretical)
Work
Theory and
Theory-
Informed
Empirical Work
Cautions ••••
Empirical disconfirmation of theory or hypotheses ••••
Explaining phenomena more simply than with
existing theory
••••
Making predictions where no respectable theory
exists
••••
Finding evidence that a previously unappreciated
factor matters
•••• ••
Disconfirmation of theory or hypotheses by
drawing on deeper, settled theory
••••
Predicting possible results for new situations •• ••••
Tightening and calibrating a model to make it more
useful
••••
Clarifying underlying principles and mechanisms ••••
Laying the basis for causal reasoning in policy
making
••••
NOTE: Strength increases with the number of bullets.
factors even though existing theory suggests great complexity. e best
examples of data-driven work permit predictions within the domain for
which data exist. ese predictions may be the best available because
theory does not exist or the inputs to theory are unknown. Empirical
work can also flag the importance of a previously unappreciated factor,
motivating improvements in theory.
e theory-driven approach is best for the lower rows of Table
11.2. It can disconfirm by using logic and established principles. It may
be able to make predictions well beyond the realm for which data exist
(a crucial consideration when relevant data are lacking), to sharpen
explanatory models, to clarify principles and mechanisms, and to sup-
port causal, explanatory reasoning of the type needed by decisionmakers.

406 Social Science for Counterterrorism: Putting the Pieces Together
e general conclusion is that a combination is needed of (1) causal
system theory where it is feasible, (2) empirical work informed by that
theory, and (3) more purely empirical work to inform, temper, and
motivate. More specifically, however, my conclusion, based on RAND’s
experience reviewing the social-science CT literature, is that
On the one hand, much more empirical work is needed, especially •
if the United States will be involved for years in CT/COIN [coun-
terinsurgency] activities. Further, existing data should be made
available to those who can analyze them well.*
On the other hand, current scholarly literature in quantitative •
social science (as distinct from history, anthropology, and so on) is
imbalanced toward the data-driven approach. More theory-driven
work is badly needed to improve communications and increase the
quality and coherence of related social science.
Structure of the Remainder of the Paper
Against this background, the next section of this paper sketches ideas
on how to represent social-science knowledge in an approach aspir-
ing to good theory. As suggested in Figure 11.1, the themes include
(1) causal system modeling with qualitative variables, multiresolution
“factor trees,” graphical and tabular depiction of interactions, and
treatment of “random” effects; (2) interactive and iterative modeling
for knowledge discovery and validation; and (3) a style of work called
exploratory analysis. e goal of analysis should be to identify likeli-
hoods and trends, and combinations of factors to be influenced, but
without the expectation of reliable predictions. After describing the
primary concepts of these themes, I sketch their use and suggest a way
ahead for CT research of this character.
*
Relevant data are often restricted but could be sanitized and released. e value of doing so
is illustrated by what has been learned from extensive data available about the long-running
Israeli-Palestinian conflict (Boaz, 2005; Berrebi, 2009; Berman and Laitin, forthcoming).

Representing Social-Science Knowledge Analytically 407
Figure 11.1
Key Elements of an Approach to Representing Knowledge
Causal system modeling with
– qualitative variables
– multiresolution “factor trees” and influence
diagrams
– graphical/tabular depiction of interactions
and processes
– random processes resulting from hidden variables
Interactive exploratory modeling for knowledge
discovery and validation
Exploratory analysis amidst uncertainty
Using approximations
to see forests from
trees
Identifying likelihoods
and trends, not
certainties
RAND MG849-11.1
Representing Knowledge with Causal System Modeling
What Is Feasible?
Before proceeding, it should be noted that we do not know how far
causal system modeling can be taken in the CT realm. e sheer com-
plexity of the phenomena will limit what can be accomplished. Some
might see an analogy to economics, where—after years of pursuing
computer-modeling approaches based on causal theory—leading prac-
titioners have largely embraced the empirical methods of econometrics
(see Angrist and Pischke, 2009, for example). e prevailing view is
that these have proven more fruitful, given sufficient data.
As discussed above, my own view is that empirical approaches are
valuable and even essential but that CT research suffers from a lack of
sufficient theory-driven analytic work. is paper is largely about ways
to do better in that regard. As a minimum, good causal system mod-
eling should prove valuable for structuring knowledge and improving
communication. I expect it to be useful as well for qualitative reason-
ing and option assessment. High-confidence quantitative prediction is
another matter altogether and may be beyond the pale, as discussed
below. I note further that econometricians benefit enormously from a
408 Social Science for Counterterrorism: Putting the Pieces Together
rich shared background in economic theory that allows them to com-
municate easily about, for example, the equilibrium theory of supply
and demand (David Ricardo), input-output relationships (Wassily
Leontief), and the role of product differentiation in global trade (Paul
Krugman). is assists their empirical research. CT research does not
yet have such a foundation of core theory. We should also recognize
how frequently imperfect theory is very useful. Decisionmakers in all
walks of life use simple devices such as doctrine manuals to remind
them of the many things to which they need to attend. ose reflect a
de facto theory. e recent counterinsurgerncy field manual (Nagl et
al., 2007) is a good example.
Principles and Aspirations
A first principle of the suggested theory-oriented approach is to reject
the search for simplistic conclusions such as “It’s all about X” (for
example, it’s all about poverty, repression, or radical Islam). In fact,
numerous factors contribute to CT phenomena. A second principle is
to strive for understandability. Decisionmakers need analysis based on
causal models allowing them to understand and reason about the phe-
nomena in question, including the effects of multiple factors, poten-
tial interventions, changes of circumstance, or changes in the system
itself. Such analysis should lend itself to encapsulation in a “story.” It
should integrate separate streams of knowledge. is is recognized in
the pleas of national governments for what is variously referred to as a
“comprehensive approach,” a “DIME/PMESII approach,” or a “whole-
of-government approach.”
6
Relationships to Past Work
How does one go about describing complicated systems? Methods cer-
tainly exist. System engineers have well-developed methods for deal-
ing with exceedingly complicated projects (Sage and Cuppan, 2001;
Haimes, 1998). Systems dynamics has been used in a wide range of
policy applications (Forrester, 1963, 1969; Sterman, 2000). My own
work on strategic planning and analysis describes ways to identify
the critical components of a system and to then ensure portfolio-style
Representing Social-Science Knowledge Analytically 409
investments in all of them, rather than in just those currently most
fashionable (Davis, 2002a; Davis, Shaver, and Beck, 2008).
Some crucial distinctions should be noted, however. In domains
such as classic system engineering, the components can be comprehen-
sively and precisely defined; their interactions can be specified so that
work can proceed in parallel on the components. at is, integration
can be accomplished by modular decomposition and careful specifica-
tion of interfaces (Baldwin, 2000). In problem domains such as coun-
terterrorism, and even in engineering when dealing with “systems of
systems” that include humans, matters are not so straightforward (Sage
and Cuppan, 2001).
7
e natural modules may not all be recognized,
may change with context, and may have subtle interactions. Model
composition is much more difficult than normal software engineer-
ing (Davis and Anderson, 2003). e system may be dynamic, even
“organic.” Technically, there is a need for “variable-structure modeling”
with different structures and decompositions at different times.
8
is
may be unsettling to those with a desire for neatness and stability, but
it comes more naturally to those familiar with the realities of human
behavior, networking, and complex adaptive systems generally.
9
It follows that there are many lessons to be drawn from past work
but that describing social-science knowledge poses special challenges.
Features of an Approach to Knowledge Representation
Some key features of the approach I will sketch are (1) qualitative mod-
eling, (2) relating variables (factors) to each other, (3) depicting the
combining logic of multifactor interactions, including feedbacks and
nonmonotonicties, (4) dealing with uncertainty (including random
effects), (5) and dealing with dynamics, such as learning and adapta-
tion. Taken together, these items represent a significant, albeit approx-
imate, first step in representing knowledge. Let us address them in
turn.
Qualitative Modeling. e best way to express social-science
knowledge is often with qualitative modeling—not as a poor second
choice tolerated by necessity but because qualitative factors are often
natural. is means accepting soft and squishy variables; to ignore them
would be as foolish as for a military commander to ignore the morale
410 Social Science for Counterterrorism: Putting the Pieces Together
of his troops—acting as though it had no effect.
10
Much of the CT
subject area is about comparably soft factors, as is evident in the social
science coming from historians, anthropologists, and psychologists.
Qualitative variables may be given a degree of rigor—for exam-
ple, by assigning them discrete values such as in the set Low, Marginal,
High and by then describing the circumstances in which the differ-
ent values apply. To avoid circularity, the distinctions drawn must be
observable in principle, even if observations are rare (as when intelli-
gence uncovers secret documents). Over time, the values of such quali-
tative variables can be more precisely defined.
In the spirit of causal system modeling, we should focus on the
purest elements of the phenomena in question, rather than thinking in
terms of dubious surrogate factors (that is, proxies) that may be more
easily measured. For example, a region’s level of democratization is not
well captured by data on whether elections occur. We cannot avoid
using surrogate measures if we are to test our knowledge empirically,
but we can defer doing so as long as possible so as to focus on the
deeper concepts.
11
Relating Factors with Factor Trees and Influence Diagrams. Many
factors, mostly qualitative, affect CT phenomena. How can they and
their relationships be represented comprehensibly? One mechanism is
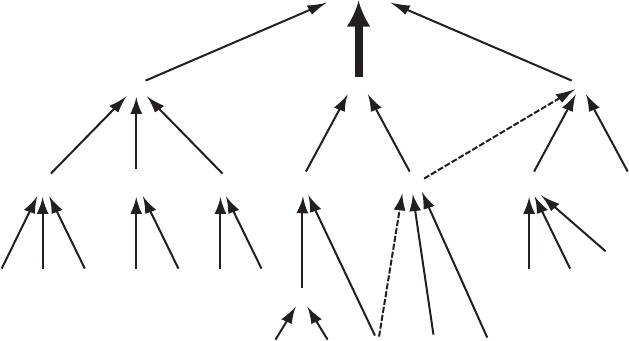
what may be called “factor trees.” Figure 11.2 illustrates the idea. If a
subject’s experts identify an alphabet soup of relevant factors, say A,
B, . . . Z, then the hope is to identify relationships among those factors
so that the overall causal structure can be represented as shown: with
only a few independent high-level factors mattering, but with those
factors dependent on lower-level factors. In the example of Figure 11.2,
A, K, and P are independent from a structural perspective (the values
of these factors may still be correlated). In contrast, R has some effect
on P as well as on K (the dashed line indicates a weaker effect). Simi-
larly, N has some effect on both D and R. e result is that the struc-
ture is a “nearly” hierarchical decomposition (weak interactions exist
among branches indicated with dashed lines). Such simple depictions
can sometimes make relative order out of chaos.
e factor-tree method draws on past work. Multiresolution mod-
eling (Davis and Bigelow, 1998) is a kind of systematic approximate
Representing Social-Science Knowledge Analytically 411
Figure 11.2
Rearranging Factors in a Nearly Hierarchical Decomposition
RAND MG849-11.2
Relevant factors A, B, C, D, E, F, G, H, I, J, K , L, M, N, O, P, Q, R, S, T, U, V, W, X, Y, Z
C
A
B
D
E G H I
J
L
K
O M
N
P
Q
R
S
T U
V W
X
Y Z
F
Outcome
abstraction useful in both hard and soft applications. In the social-
science domain, it has been successfully used to build behavioral models
of adversaries, for example (Davis, 2002b; National Research Council,
1996). e ubiquity of “nearly hierarchical decomposition” is described
in a classic essay by the late Nobelist Herbert Simon (Simon, 1978).
Graphical depictions such as Figure 11.2 are variants of the influence
diagrams of Jay Forrester’s system dynamics in which if two variables
are connected by an arrow, it means that an increase in the first vari-
able (at the arrow’s tail) will tend to increase the second variable (at the
arrow’s head). A negative sign on top of an arrow, as between B and A,
indicates that the effect is reversed—that an increase in the first vari-
able tends to decrease the second. e variables, or factors, are usually
thought of as having “levels” (for example, the degree of a population’s
discontent or the degree of an individual’s religious ardor).
12
As I use
diagrams in this paper, they may include dashed lines to indicate a
weak effect, as in Figure 11.2, or thicker lines to indicate a stronger
effect (e.g., factor K’s effects in this figure). is modest extension of
412 Social Science for Counterterrorism: Putting the Pieces Together
influence-diagram notation has been proven in research, collaboration,
and discussion with policymakers.
13
Representing Combining Logic of Multifactor Interactions. Dia-
grams such as Figure 11.1 describe what factors operate together and
affect others, but they do not say how. Do the factors have independent
effects or do they interact? Are the effects direct or indirect? Is there
some order in which they must arise?
One simple device for describing interactions at an elementary
level is a combining logic diagram (CLD) illustrated in Figure 11.3. A
CLD adds some “and/or” notation to an influence diagram, implicitly
assuming binary values such as yes or no (or true and false). e figure
indicates that A and B are substitutable for each other but that factor
C has independent importance. According to Figure 11.3, a positive
outcome (yes) occurs if either A or B is yes (that is, true), and C is also
yes. at is, C is a necessary condition, whereas A and B are alternative
conditions.
e assumption of binary values is crude but useful in convey-
ing approximate knowledge.
14
Fine-tuning can be deferred to model
builders, who need more precision. Such a cavalier attitude would be
Figure 11.3
A Combining Logic Diagram
RAND MG849-11.3
A
B
C
D
or
and
Representing Social-Science Knowledge Analytically 413
inappropriate in a more exact science, but the baseline of CT/COIN
social-science theory is arguably confusion calling out for sense-making,
even if approximate.
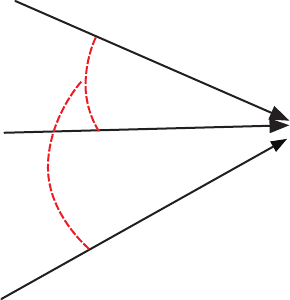
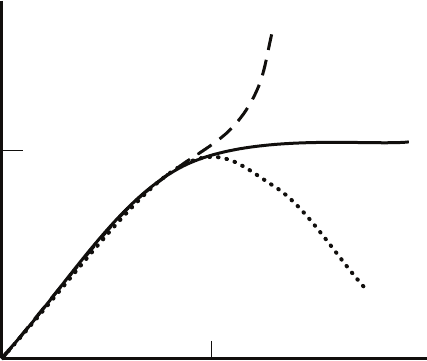
Nonmonotonicities. A second challenge is to describe simply how
an effect changes as a causal variable continues to increase. As in Figure
11.3, assume that an effect, D, depends on A, B, and C, but hold B
and C constant. Figure 11.4 contrasts three ways in which an effect, D,
might then vary with A. Case 1 illustrates monotonicity; cases 2 and
3 illustrate nonmonotonicity. Mathematically, a monotonic function’s
derivative never changes sign.
In principle, the functional form could be arbitrarily complex, but
much social-science knowledge can be captured by merely relating to
one of these types of relationship. Something like Case 3 appears in the
CT literature when researchers observe an inverted “U” relationship, as
when the incident rate of terrorism apparently increases with democra-
tization but eventually decreases again.
15
Figure 11.4
Monotonic and Nonmonotonic Effects (for constant
values of B and C)
RAND MG849-11.4
1
2
3
A
A
1
D
D
1
414 Social Science for Counterterrorism: Putting the Pieces Together
A great deal of effort could go into finding “best” functions to
represent effects observed empirically. Social-science knowledge is often
quite rough, however, especially when based on statistical analysis of
data averaging over a range of contexts. It may be necessary to allow for
the reversal of sign (that is, in an influence diagram, the arrow from A
to C would have to bear a +/- because the sign of the effect is not con-
stant). at may happen as a result of random effects discussed below.
Feedbacks. A special case of great interest involves “feedback,”
where increasing a factor causes an effect, which then affects the pro-
cess giving rise to the effect. If increased fervor increases the likelihood
of terrorist attacks, and if increased terrorist attacks in turn arouse even
more fervor, then a “positive feedback effect” exists. However, at some
point, the attacks may go too far, kill the wrong people, or cause severe
retribution, in which case fervor for attacks will decrease, as will the
attacks themselves. is would be an instance of negative feedback.
Feedback effects are easily denoted in an influence diagram as
in Figure 11.5. Feedbacks have long been a core element of engineer-
ing’s control theory and system dynamics (Forrester, 1963, 1969; Ster-
man, 2000). Again, the notation of Figure 11.5 means that although
increasing A and B leads to an increase in C, there is a feedback effect:
As C increases, A is reduced (indicated by the negative sign), thereby
decreasing the subsequent effect on C.
Feedbacks are ubiquitous in natural systems. If all feedback loops
were shown in social-science influence diagrams, they might clutter the
diagram hopelessly and render the very concept of “causality” trouble-
some. I suggest that two simplifications save the day:
Many feedback effects are relatively small over the time scale of •
interest.
Many feedback effects need not be addressed explicitly because •
they occur on very short, even “instantaneous,” time scales until
the combined effects of the several independent variables “settle
down.”