R?ssler U. Solid State Theory: An Introduction
Подождите немного. Документ загружается.

3.5 Optical Phonons 55
3.5 Optical Phonons
Phonon dispersions of solids with a crystal structure, containing more than one
atom in the unit cell exhibit, besides the acoustic phonons, additional branches
starting with finite frequencies at q = 0 in the center of the Brillouin zone.
An example has been dealt with in Problem 3.1. We know from its solution,
that in this phonon mode the atoms of the unit cell move π out of phase
with each other as demonstrated in Fig.
3.4. Some of these phonons are dipole
active, i.e., they can be excited optically by infra-red light, thus, determining
the response of the solid to the external electric field of an electromagnetic
wave in this spectral range. They are, therefore, called optical phonons.Their
properties will be the subject of this section.
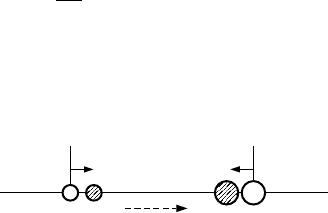
Let us consider the situation for a crystal unit cell with two ions carrying
charges η
τ
,whereτ = ± is the index for the basis, as depicted in Fig.
3.4.The
electric dipole moment of the solid (here denoted as M ) can b e expressed as
M =
n,τ
η
τ
R
0
nτ
+ u
nτ
. (3.92)
For the static lattice in equilibrium, M
0
=
n,τ
η
τ
R
0
nτ
defines the spo nta-
neous electric dipole moment. Solids with M
0
= 0 are called ferroelectric. We
consider here the case M
0
= 0, which results for the considered binary solid
with two ions with opposite charge in the unit cell. An electric field drives the
two charged ions into opposite directions, thus, inducing a dipole moment. In
a time-dependent electric field E(t), this system can be resonantly excited at
the frequency of the optical phonon. In the language of the response formal-
ism, the system Hamiltonian (
3.41) has to be extended by the time-dependent
perturbation (see (
2.58))
V
ext
(t)=−M · E(t). (3.93)
It causes a (dielectric) pola ri zation with components
P
i
=
M
i
V
=
j
χ
ij
E
j
,i,j=1, 2, 3 (3.94)
with the diele ctric susceptibility χ as a response function, which is a symmetric
second ra nk tensor. T h e vector components P
i
and M
j
can be identified with
+
_
R
0
n
+
R
n
0
_
u
n+
u
n
_
E(t)
Fig. 3.4. Characteristic ion displacements in a unit cell for an optical phonon
56 3 Lattice Dynamics: Phonons
the observables
ˆ
A and
ˆ
B, respectively, of the response formalism outlined in
Chap.
2. After Fourier transformation, we write
P
i
ω
=
j
i
¯hV
+∞
−∞
e
iωt
θ(t)[
ˆ
M
i
(t),
ˆ
M
j
(0)]
0
dtE
j
(ω) (3.95)
=
j
χ
ij
(ω)E
j
(ω), (3.96)
with the dipole operator given by
ˆ
M(t)=
nτ
η
τ
ˆ
u
nτ
(t)=
sq
nτ
η
τ
√
NM
τ
e
s
τ
(q)e
iq·R
0
n
Q
s
(q,t). (3.97)
The normal co ordinate Q
s
(q,t) can be expressed in terms of phonon operators
to write
ˆ
M
i
(t)=
sq
M
s
i
(q)
a
†
s
(−q,t)+a
s
(q,t)
, (3.98)
with the component
M
s
i
(q)=
nτ
η
τ
¯h
2NM
τ
ω
s
(q)
!
1/2
e
s
τi
(q)e
iq·R
0
n
(3.99)
of the dipole moment connected with a phonon in the mode s, q. The dipole
correlation function [
ˆ
M
i
(t),
ˆ
M
j
(0)]
0
can be evaluated using P r oblem 3.5,
together with n
s
(q,T)=n
s
(−q,T)towrite
[a
†
s
(−q,t),a
s
′
(q
′
, 0)]
0
= −δ
ss
′
δ
−qq
′
e
iω
s
(−q)t
(3.100)
and yields, with ω
s
(q)=ω
s
(−q),
[
ˆ
M
i
(t),
ˆ
M
j
(0)]
0
=
sq
M
s
i
(q)M
s
j
(−q)
&
−e
iω
s
(q)t
+e
−iω
s
(q)t
'
. (3.101)
Let us now consider the limit of long wavelengths λ ≫ a (where |q| =2π/λ
and a is the lattice constant), which holds for far-infrared light, to simplify
M
i
(q) with the dipole approximation
e
iq·R
0
n
=1+iq · R
0
n
+ ...≃ 1 (3.102)
and distinguish between longitudinal (s = L) and transverse pho n ons (s =T)
with the properties
M
L
e
L
τ
(q)q and M
T
e
T
τ
(q) ⊥ q, respectively. (3.103)
In the first case and for an electromagnetic wave propagating in the direction
of q, one has M
L
·E = 0, i.e., the transverse light cannot excite a longitudinal
3.5 Optical Phonons 57
phonon mode. In the second case, there is a contribution to P
ω
and thus,
to the susceptibility. In the long-wavelength limit, with
M
T
i
(q → 0) =
¯h
2ω
T
(0)
!
1/2
τ
η
τ
%
N
M
τ
e
T
τi
(0) =: M
T
i
, (3.104)
one finds for the dielectric susceptibility
χ
ij
(ω) = lim
Γ→0
iM
T
i
M
T∗
j
¯hV
∞
0
&
e
i(ω
T
(0)+ω+iΓ)t
− e
−i(ω
T
(0)−ω−iΓ)t
'
dt.
(3.105)
Here, the exponential with the parameter Γ has been introduced for the adia-
batic switching on of the perturbation V
ext
of (
3.93), and the lower integration
limit is a consequence of the step function in (
3.95). After inte gration, one has
χ
ij
(ω) = l im
Γ→0
M
T
i
M
T∗
j
¯hV
1
ω
T
(0) + ω +iΓ
+
1
ω
T
(0) − ω − iΓ
. (3.106)
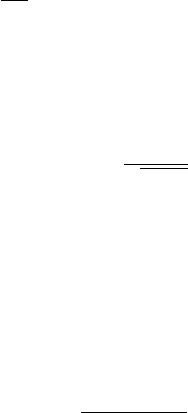
The susceptibility exhibits a characteristic pole structure in the complex ω-
plane, with poles at ω = ±ω
T
(0) − iΓ (see Fig.
3.5a) and frequencies ω
T
(0) =
ω
T
in the infra-red spectral r ange.
For solids with a cubic lattice, χ
ij
(ω) simplifies to a scalar χ
ij
(ω)=
χ(ω)δ
ij
, which determines the complex frequency-dependent dielectric func-
tion
ε(ω)=ε
∞
+
1
ε
0
χ(ω)=ε
1
(ω)+iε
2
(ω), (3.107)
where ε
0
is the vacuum dielectric constant, while ε
∞
accounts for the dielectric
background, which is caused by contributions of oscillators in the electronic
Imω Imε(ω)
Reω
-ω
T
(0) ω
T
(0) -ω
T
(0)
ω
T
(0)
ω
(a) (b)
Fig. 3.5. (a)Complexω plane with poles of the dielectric function; (b)Realpart
of the d ielectric function without (solid)andwith(dashed) damping vs. frequency

58 3 Lattice Dynamics: Phonons
system of the solid (see Chaps.
4 and 5), with resonances at much higher
frequencies than those of the o ptical phonons. Therefore, it is called high-
frequency dielectric constant. The imaginary part of the dielectric function is
related to the absorption coefficient (see Chap.
10) and takes the form
ε
2
(ω)=Im
χ(ω)
ε
0
= lim
Γ→0
|M
T
|
2
¯hV ε
0
+
Γ
(ω
T
− ω)
2
+Γ
2
−
Γ
(ω
T
+ ω)
2
+Γ
2
,
. (3.108)
Each term in the last bracket is a Lorentzian, which for Γ → 0 b ecomes a δ
function peaked at ω = −ω
T
and ω = ω
T
(see Fig.
3.5b), corresponding to
emission and absorption respectively of an optical phonon at q =0.Note,
that this final result with the δ functions would also result by applying (
2.77)
directly to (
3.106)fori = j. Combining both terms, the real and imaginary
part of the dielectric function can be written as
ε
1
(ω)=ε
∞
+ lim
Γ→0
|M
T
|
2
¯hV ε
0
2ω
T
(ω
2
T
− ω
2
)
(ω
2
T
− ω
2
)
2
+ ω
2
Γ
2
, (3.109)
ε
2
(ω) = lim
Γ→0
|M
T
|
2
¯hV ε
0
2ω
T
ωΓ
(ω
2
T
− ω
2
)
2
+ ω
2
Γ
2
. (3.110)
We note in passing that ε
1
(ω)andε
2
(ω) a re connected with each other by
the Kramers–Kronig relations (see Sect.
2.6).
The parameter Γ is introduced as a mathematical trick to regularize the
integral in (
3.105). But in a more general view, it can be understood as also
being caused by interactions not explicitly included in the present model. By
taking into account electron–phonon interaction (see Chap.
7) or anharmonic
effects due t o higher order terms in the expansion (
3.6) it would b e fi nite, thus,
indicating a finite phonon lifetime or a damping of the phonon oscillator. In
fact, an o ptical phonon can decay into two acoustic phonons. Microscopically,
such processes mean dissipation of energy from the optical phonon to o th er
degrees of freedom.
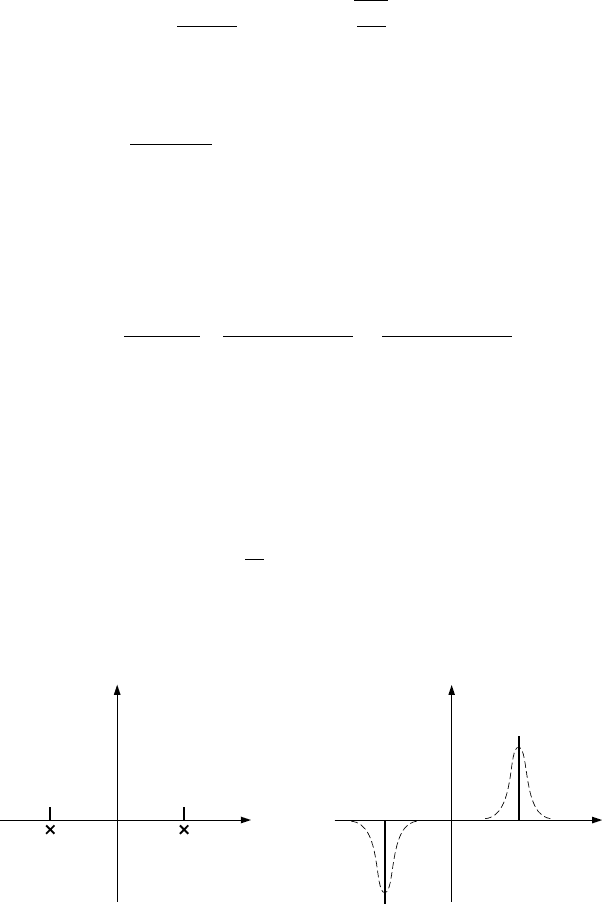
We go into a more detailed discussion of the optical properties by looking
at ε
1
(ω) and the reflection coefficient R(ω),whichareplottedinFig.
3.6.For
ω = 0 (and Γ = 0), the real part of the dielectric function can be written as
ε(0) = ε
∞
+S/ω
2
T
,knownasthestatic dielectric constant, while for frequencies
ω>>ω
T
(or ω →∞in (
3.109)) it approaches the high frequency value
ε
∞
. In-between, it passes through the resonance at ω
T
and is negative up
to a frequency identified with that of the longitudinal phonon ω
L
at which
ε
1
(ω
L
) = 0. Without damping, this relation yields
ω
2
L
= ω
2
T
+
S
ε
∞
>ω
2
T
. (3.111)
3.5 Optical Phonons 59
R(ω)
ε(0)
1
0
ε
∝
ε
1
(ω)
ω
ω
1
1
0
ω
T
ω
L
∝
Fig. 3.6. Real part of the dielectric function (upper part) and reflection coefficient
(lower part) without (solid)andwith(dashed) damping vs. frequency
By including Γ, one obtains the dashed curve for ε
1
(ω)inFig.
3.6,whichis
characteristic for a damped oscillator with frequency ω
T
.
The reflection coefficient is defined by the complex index of refraction
N = n
1
+in
2
(all quantities depending on ω):
R(ω)=
"
"
"
"
1 − N(ω)
1+N(ω)
"
"
"
"
=
(1 − n
1
(ω))
2
+ n
2
2
(ω)
(1 + n
1
(ω))
2
+ n
2
2
(ω)
!
1/2
. (3.112)
Without damping, using ε
1
= n
2
1
−n
2
2
,andε
2
=2n
1
n
2
, we find in the interval
ω
T
<ω<ω
L
that ε
1
is negative while ε
2
vanishes, which leads to n
1
=0and
n
2
= 0 and consequently to R (ω) = 1. In other words, the solid cann ot prop-
agate light in this frequency range, i.e., all light is perfectly reflected from the
surface. It is called Reststrahlen band because the reflected light is do minated
by these frequencies. Taking into account damping gives the more realistic
(dashed) curve shown in Fig.
3.6. It is in accordance with experimental spec-
tra, which can be picked up from textbooks like [
89] or from data collections
like [
94].
From (
3.111), we have S = ε
∞
(ω
2
L
−ω
2
T
) and can express the (real part of
the) dielectric function (see (
3.109) for Γ = 0) as
ε(ω)=ε
∞
ω
2
L
− ω
2
ω
2
T
− ω
2
(3.113)
in terms o f the characteristic optical phonon frequencies and the material
constant ε
∞
.Forω = 0, this expression reduces to

60 3 Lattice Dynamics: Phonons
ε(0)
ε
∞
=
ω
2
L
ω
2
T
(3.114)
known as the Lyddane–Sachs–Teller
5
relation. Making use of this relation, we
also may write S = ω
2
T
(ε(0) − ε
∞
) in terms of the macroscopic quantities
ω
T
,ε(0), and ε
∞
. On the other hand, S =2ω
T
|M
T
|
2
/¯hV ε
0
is determined by
the microscopic parameters of the system (see (
3.104)), the charge η
±
= ±η
and the masses M
±
of the ions. In the long-wavelength limit of the optical
mode the latter move against each other with eigenvectors e
T
±
= ±
#
(M
∓
/M ),
where M = M
+
+ M
−
. This allows us to express
η =
μV ε
0
N
(ε(0) − ε
∞
)
!
1/2
ω
T
(3.115)
in terms of the macroscopic material parameters (here the reduced mass μ =
(1/M
+
+1/M
−
)
−1
appears b ecause o f the relative motion of the two ions
in the unit cell, see Problem 3.1). As this expression for η contains also the
transverse phonon frequency ω
T
, it is called the transverse charge [
89]. It is
related to the strength of the phonon oscillator and can be determined from
the measured spectrum by a line-shape fit.
In crystalline solids with more complex unit cells than the one with two
oppositely charged ions assumed here, there are several triples of optical
phonon branches with different longitudinal-transverse splittings, giving rise
to different transverse effective charges [
95].
3.6 Examples: Phonon Dispersion Curves
Phonon dispersion curves, showing the phonon frequencies ω
s
(q)fordifferent
branches s, are usually plotted versus q along different high symmetry direc-
tions in the Brillouin zone. For the examples to be discussed in this section,
which all have fcc or bcc point lattices, we refer to the Brillouin zones depicted
in Figs.
1.1 and 1.2. Phonon dispersion curves are obtained either experimen-
tally from inelastic scattering preferentially with neutr ons (for a more recent
introduction and examples see [
96, 97]) and also with photons and atoms, or
from model calculations of different sophistication. Both kinds of investigation
have influenced and stimulated each other and are well documented [
77–79],
thus, at present the phonon dispersion curves of solids are well known. For
collections of phonon dispersion curves, together with a compilation of the
original references, we refer to [
76, 81, 94]. A selection will be presented
and discussed in this section to provide the knowledge how to read phonon
dispersion curves and understand their principal material specific features.
5
Russell Hancock Lyddane 1913–2001, Robert Green Sachs 1916–1990, Edward
Teller 1908–2003
3.6 Examples: Phonon Dispersion Curves 61
In all the examples presented below, experimental data are shown together
with calculated dispersion curves. In order to judge the quality of the theo-
retical data, it is necessary to briefly characterize the different models used.
Historically (and this has been in the first place a matter of available computer
power), a variety of phenomenological models has been developed. Depending
on their complexity, these models are characterized by a number of param-
eters, which have to be determined by fits to the experimental data. We
have already learned about the simplest of these phenomenological models
with massive spheres (representing rigid ions) and springs (representing the
interionic forces due to chemical binding) in Sects.
3.1 and 3.2 (including Prob-
lems 3.1 and 3.2). For given masses of the ions, this rigid-ion model contains
the force constants as adjustable parameters (their number depending on the
symmetry of the lattice and the considered number of neighb ors coupled by
springs, see Prob lem 3.2). As demonstrated by comparing measured with fit-
ted dispersion curves for Al in Fig.
3.7 and for Fe in Fig. 3.8,thismodelworks
well for metals.
However, this rigid-ion model does not account for a polarization con-
nected with a motion of the ions in ionic crystals. For these systems, so-called
shell models of different complexity have been developed. By decomposing
the ion into the nucleus with the closed shells of core electrons and the shell
of valence e lectrons, responsible for the chemical binding, it becomes possi-
ble to introduce additional parameters or force constants representing springs
between each two movable parts of the model. Especially, a spring b etween
the closed-shell ion and the shell of valence electrons can be used to account
for the polarization of the atom. With this increased number of parameters,
shell models a re qu ite flexible and have been successfully applied to ionic crys-
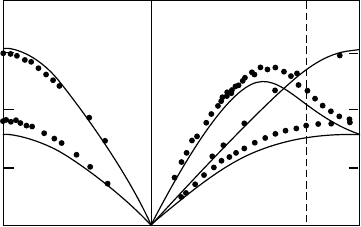
tals with heteropolar binding like KI (Fig.
3.9). KI crystallizes in the rocksalt
structure with two ions in the Wigner–Seitz cell and, therefore, its phonon
dispersion curves have acoustic (TA, LA) and optical branches (TO, LO).
6
4
2
0
ΧΓ Κ∆ ΣΧ
Al
L
T
L
T
1
ω [10
13
rad s
–1
]
T
2
Fig. 3.7. Phonon dispersion curves for Al (fcc structure). Symbols are experimental
data from inelastic neutron scattering, dispersion curves calculated with the rigid
ion model using three force constants fitted to elastic constants (after [
77])
62 3 Lattice Dynamics: Phonons
Fe
2
Γ∆ ΣΓΛ
υ [THz]
6
4
L
T
8
10
NH PF
Fig. 3.8. Phonon dispersion curves for α−Fe (bcc structure). Symbols are experi-
mental data from inelastic neutron scattering, dispersion curves calculated with the
rigid ion model using force constants for up to five nearest neighbors (after [
81])
ΧΣΓΓ∆
L
υ [THz]
4
3
2
1
Λ
L0
T0
LA
TA
KI
Fig. 3.9. Phonon dispersion curves for KI (rocksalt structure). Symbols (open for L,
full for T modes) are experimental data from inelastic neutron scattering, dispersion
curves calculated with an 11-parameter shell model (after [
76])
In solids with dominating covalent binding, like those made of the group-IV
elements, which crystallize in the diamond structure (two interpenetrating fcc
lattices with four nearest neighbors to each atom), the valence electron density
exhibits a strong maximum halfway between each pair of nearest neighb o rs
(see Chap.
5). This bond charge is characteristic for covalent binding. It turns
out to be important not only for the stability of the diamond structure but
also for the lattice dynamics. Because the rigid-io n models as well as the shell
models fall short of describing the bond charge and its motion, a bond charge
model has been invented, which intro d uces springs between neighboring bond
charges. This mod el has been used to calculate the phonon dispersio n curves
of Si in Fig.
3.10.
Of particular nature are solid rare gases, which, due to the weak van der
Waals forces, exist only at low temperatures. Their characteristic phonon fre-
quencies are much smaller than those of other solids, therefore, already very
3.6 Examples: Phonon Dispersion Curves 63
ΧΓ∆ΚΣ ΛΓ
L
15
10
5
0
Si
υ [THz]
L
L
L
T
T
T
2
T
2
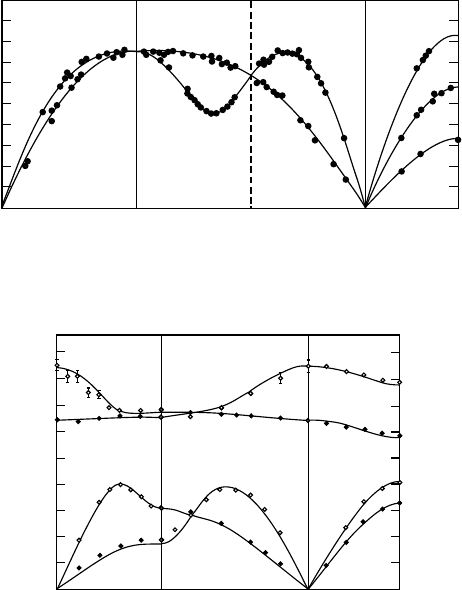
Fig. 3.10. Phonon dispersion curves for Si (diamond structure). Symbols (open
for L, full for T modes) are experimental data from inelastic neutron scattering,
dispersion curves calculated with the bond-charge model (after [
76])
He(bcc)
4
3.0
2.0
1.0
hω [meV]
ΓΗ ΓΝ∆ΛΣ
L
L
L
T
T
2
T
1
Fig. 3.11. Phonon dispersion curves for solid
4
He in the bcc structure. Symbols
(open for L and full for T modes) are exp erimental data from inelastic neutron scat-
tering, dispersion curves calculated with the self-consistent harmonic approximation
(after [
76])
little thermal energy creates lattice displacements that require the consider-
ation of anharmonic corrections. Th is is done in the self-consistent harmonic
approximation (SCHA) used in Figs.
3.11 and 3.12 (see also Problem 3.8).
These different models, although successful in many cases, turned out to
be in conflict with experimental data of increasing accuracy. Discrepancies
were found in particular for phonon eigenvectors, which have been mea-
sured besides the frequencies [
98]. At the same time, theoretical concepts and
computer power became available for microscopic lattice dynamics based on
ab-initio methods [
99, 100]. These methods aim at the self-consistent solution
of the time-dependent Schr¨odinger equation for the motion of the ions in the
adiabatic p otential (
3.1)
n
P
2
n
2M
+ U({R
n
})
Φ=i¯h
˙
Φ (3.116)
64 3 Lattice Dynamics: Phonons
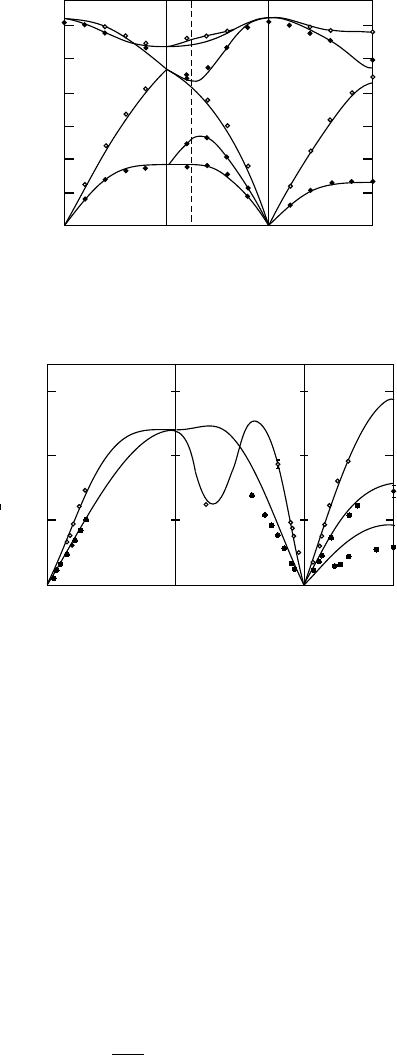
3
2
1
Γ∆Χ Σ Γ
L
Λ
He(fcc)
4
υ [THz]
Fig. 3.12. Phonon dispersion curves for solid
4
He under hydrostatic pressure in the
fcc structure. For symbols (experiment) and lines (model calculations) see caption
of Fig.
3.11 (after [76])
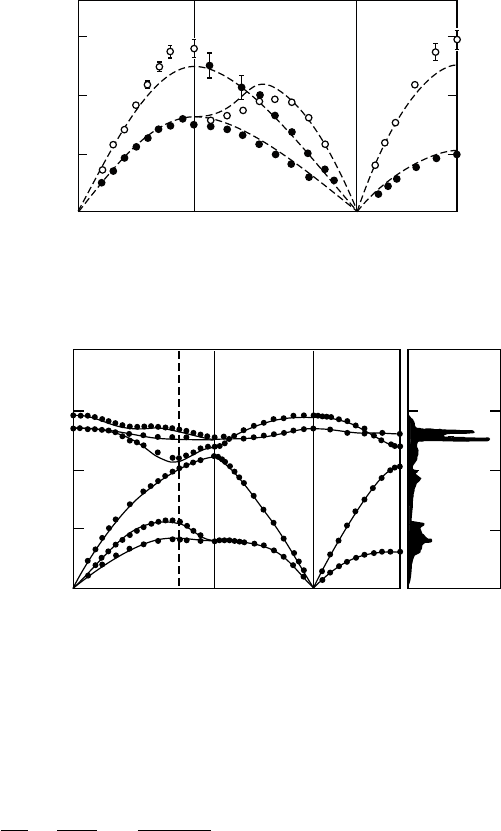
ΧΓΚΓ L DOS
wave number [cm
–1
]
GaAs
400
300
200
100
0
Fig. 3.13. Phonon dispersion curves and density of states (DOS) for GaAs (zinc
blende structure). Symbols are experimental data from inelastic neutron scattering,
dispersion curves are ab-initio results from DFPT (after [
101])
and of the time-independent Schr¨odinger equation for the electrons in the
equilibrium configuration of the ions
l
p
2
l
2m
+
1
8πε
0
k,l
k=l
e
2
|r
k
− r
l
|
+
n,l
v(r
l
− R
n
)
Ψ
0
= E
el
Ψ
0
. (3.117)
This becomes possible within the density–functional theory (DFT), which
will be introduced in Chap.
5, as an extension to the density–functional per-
turbation theory (DFPT) [
98–100]. As an example of such calculations we
show phonon dispersio n curves of GaAs in Fig.
3.13, together with the phonon
density of states.
When looking at the phonon dispersion curves, one finds different units
for the phonon frequencies ν,wavenumbers¯ν,orenergies¯hω, following from
the relations E =¯hω = hν = hc¯ν. The scales are typically THz or 10
12
s
−1