Sha W., Malinov S. Titanium Alloys: Modelling of Microstructure, Properties and Applications
Подождите немного. Документ загружается.

Titanium alloys: modelling of microstructure218
and different vanadium concentrations. Subsequently, the difference in the
energies of the two phases, ∆g, and the activation barrier for nucleation,
∆G
C
*
, are calculated using Eq. [8.7] (see Fig. 8.4a). In order to limit the
number of unknown parameters in the model, we make the assumption that
the interface mobility is high, so that the atoms are able to move freely
4 wt.% V
6 wt.% V
8 wt.% V
10 wt.% V
12 wt.% V
14 wt.% V
4 wt.% V
6 wt.% V
8 wt.% V
10 wt.% V
12 wt.% V
14 wt.% V
∆
G
*
C
/k
T
100
10
1
0.1
750 800 850 900 950 1000
T
(°C)
(a)
750 800 850 900 950 1000
T
(°C)
(b)
Rate of nucleation (nuclei/µm.s)
0.01
0.008
0.006
0.004
0.002
0
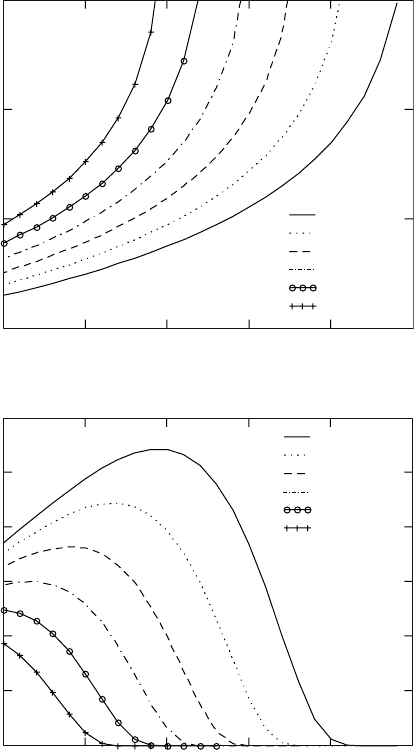
8.4
Calculated (a) barrier for nucleation and (b) rate of nucleation for
the β to α transformation in Ti-6Al-4V alloy as functions of the
vanadium content and the temperature. In calculating ∆
G
/k
T
,
T
in
Kelvin is used.
Finite element method: morphology 219
across the interface. The diffusion controls the growth and the lamella grows
just as fast as the diffusion allows. In this case, the vanadium concentration
in β phase at the interface is equal to equilibrium concentration (see Fig.
5.1b) and the free parameters in the model are the number of nucleation sites
N
v
and the surface energy γ. The next step is to fit the calculated thickness of
the α plates to the experimental data by setting the N
v
and γ values free but
constant for all the temperatures, concentrations and cooling rates used.
From the fitting of the free parameters, the values of
N
v
b
4
k
= 1.3 10
h
×
nucleus/(s · m) and
γ ()
3
S
θ
= 0.012 J/m
2
for the β to α
phase transformation in Ti-6Al-4V alloy are obtained. The plots of the calculated
barrier for nucleation (Fig. 8.4a) and the rate of nucleation (Fig. 8.4b) are for
these values of
N
v
b
k
h
and
γ ()
3
S
θ
and applying Eqs. [8.7] and [8.8],
respectively.
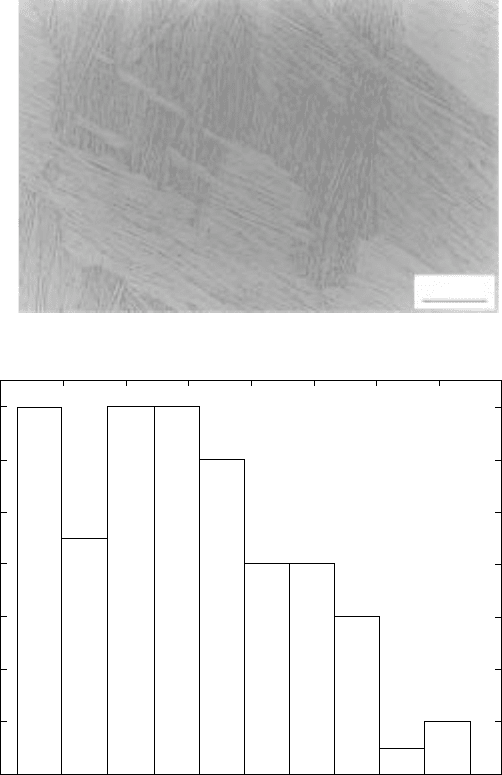
The simulated distribution of the α lamellae thickness for the above values
of N
v
and γ is plotted in Fig. 8.5b. This simulation from the model is compared
with the experimentally observed microstructure of the Ti-6Al-4V alloy after
cooling with the same cooling rate (Fig. 8.5a). A good agreement between
the experimental mean lamellae size and the prediction from the FEM is
obtained. The 1-D model predicts the existence of a notable fraction of
lamellae with small thickness, which nucleate at the end of the process of
transformation and do not have enough driving force and time to grow.
Perhaps such lamellae really exist, but they cannot be observed in the optical
microstructure because of their small thickness. Similar good agreement
between the FEM simulations for the α lamellae thickness and experimental
observations is obtained for other cooling rates. The model predictions for
the average thickness of the α lamellae for cooling rates of 20 and 10 °C/min
are 1.7 and 2.1 µm, respectively.
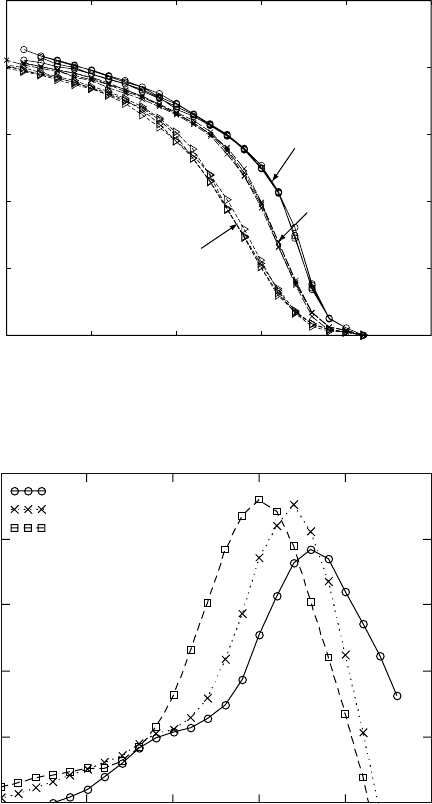
The 1-D model is further used to simulate the kinetics of the β to α phase
transformation in the Ti-6Al-4V alloy. Figure 8.6 shows the model simulations
for the amount of the α phase as a function of the temperature for different
constant cooling rates. For each cooling rate a number of runs were performed,
and the results are reproducible. The shapes of the curves tracing the kinetics
of the β to α phase transformation are classical. The simulated influence of
the cooling rate on the kinetics of the transformation is in agreement with the
experimental data from the differential scanning calorimetry study of the
same transformation (Chapter 7). There are some differences between the
experimental calorimetry kinetics curves in Chapter 7 and the FEM simulations
here. A possible reason for this difference is that the processes of the 2-D and
3-D impingement cannot be taken into account in the 1-D model.
The 1-D model is also used for analysis of the nucleation rate of the β to
α phase transformation in Ti-6Al-4V alloys. Figure 8.7 presents the FEM
Titanium alloys: modelling of microstructure220
simulations for the real nucleation rate for different cooling rates. The nucleation
rates presented in Figs. 8.4b and 8.7 should be well distinguished. Figs. 8.4b
shows the theoretical nucleation rate for different temperatures and vanadium
concentrations and is obtained by the plotting of Eq. [8.8]. Figure 8.7 shows
the model simulations for the real nucleation rate for the current temperature
50 µm
(a)
Cooling rate 40 °C/min
Mean lamellae
size = 1.47 µm
0 0.5 1 1.5 2 2.5 3 3.5 4
Size (m)
(b)
× 10
–6
Frequency
14
12
10
8
6
4
2
0
8.5 (a)
Microstructure of Ti-6Al-4V alloy after cooling at a cooling rate
of 40 °C/min and (b) distribution of the lamellae thickness of the α
phase for the same cooling rate calculated from the FEM.
Finite element method: morphology 221
and the vanadium concentration profile in the residual β phase at the
corresponding moment in the β phase. The simulated rate of nucleation first
increases with the decrease in the temperature (increase in the degree of
undercooling below β-transus temperature). The reason for this is that the
barrier for nucleation of α phase significantly decreases with the undercooling.
The maximum of the nucleation rate is around 900 °C. This observation is in
Amount of α phase
1
0.8
0.6
0.4
0.2
0
750 800 850 900 950 1000
T
(°C)
10 °C/min
20 °C/min
40 °C/min
8.6
Kinetics of the β to α transformation in Ti-6Al-4V alloy for
different cooling rates calculated from the FEM.
750 800 850 900 950 1000
T
(°C)
Cooling rate 10 °C/min
Cooling rate 20 °C/min
Cooling rate 40 °C/min
Rate of nucleation (nuclei/mm.s)
50
40
30
20
10
0
8.7
FEM simulation for the real rate of nucleation at different cooling
rates.

Titanium alloys: modelling of microstructure222
agreement with the TTT diagram for the Ti-6Al-4V alloys (Chapter 14)
according to which the nose point is in the range of 850–900 °C, depending
on the alloy composition. Naturally, higher cooling rates shift the maximum
of the nucleation rate to lower temperatures. Further decrease in the temperature
leads to decrease in the rate of nucleation. There are three concurrent reasons
for this: (i) the diffusion and the migration of the atoms across the interface
are slower, (ii) the amount of the β phase is decreased, and (iii) the vanadium
concentration in the residual β phase is increased.
8.6 The 2-D model
In order to describe more realistically the β to α phase transformation, we
will show 2-D simulation of the nucleation and growth of the α phase lamellae
within a former β grain. We assume that the nucleus of α phase is formed at
the β grain boundary and then grows to the grain interior. The mechanism of
nucleation of the α phase at the β grain boundary, used in 2-D model, is the
same as the mechanism used in the 1-D problem.
After the α/β interface is created during the nucleation stage, it starts
migrating into the surrounding β phase, by the transfer of vanadium atoms
across the interface. Since the α plates grow mainly parallel to {110}β plane,
the mobility M
1
of vanadium across the interface in the direction of the
longitudinal dimension is much higher than the mobility M
2
across the interface
in the transverse direction. Hence, the growth oriented parallel to the {110}β
plane can be expected to be mainly diffusion controlled, whilst the growth in
the transverse direction is mixed or even interface controlled. The mobility
determines the corresponding flux of vanadium atoms across the interface,
Eq. [8.12], which in its turn defines the boundary conditions at the α/β
interface for the vanadium diffusion in the β phase.
The growth rate can be evaluated by solving the diffusion equation [8.15]
in the domain occupied by the β phase. The value of vanadium concentration
at any point of the interface C
i
will be that which satisfies the boundary
condition Eq. [8.17]. The mobility of vanadium atoms M
1
and M
2
in the two
directions are free parameters in the model and are determined by fitting the
calculated shape of the α plates to the metallographic observations (Chapters
6 and 7). The following values of
M
V
1
m
2
–5
R
= 6.4 10×
µm · wt.%/(K · s) and
M
V
2
m
2
–7
R
= 3.5 10×
µm · wt.%/(K · s) for the β to α phase transformation in
Ti-6Al-4V are obtained.
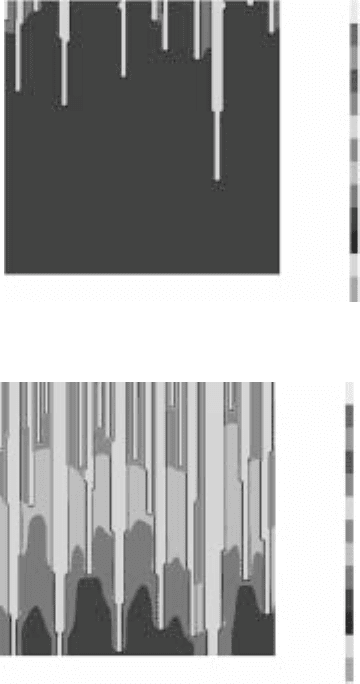
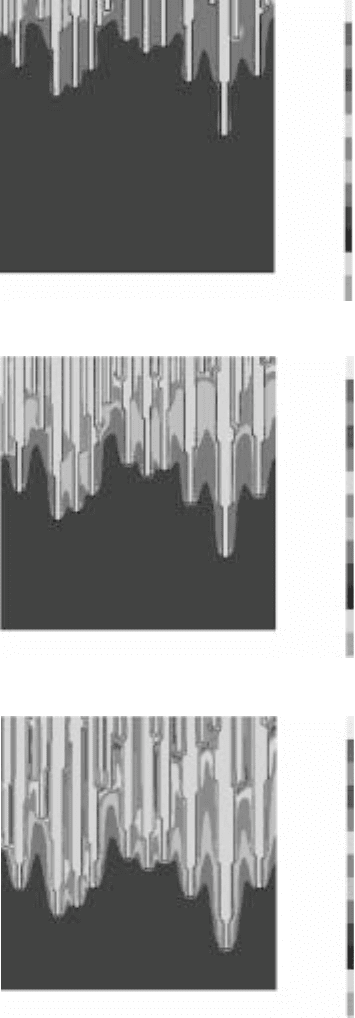
Using the computer package, we simulate the process of nucleation and
growth of a colony of α phase lamellae on a square with length 40 µm for
constant cooling rates of 10 °C/min (Fig. 8.8a–d) and 30 °C/min (Fig. 8.8e–h).
Two observations are apparent from the comparison of the simulations:
Finite element method: morphology 223
(a) Cooling rate 10 °C/min at 910 °C
Temp 910 °C
.13
.12
.11
.10
.09
.08
.07
.06
.05
.04
.03
.02
(b) Cooling rate 10 °C/min at 850 °C
Temp 850 °C
.13
.12
.11
.10
.09
.08
.07
.06
.05
.04
.03
.02
8.8
FEM simulations for the microstructure evolution of the β to α
phase transformation in Ti-6Al-4V alloy at continuous cooling with
constant cooling rate. The scales to the right of each figure represent
vanadium concentration. (a)-(d) 10 °C/min; (e)-(h) 30 °C/min; (a) and
(e)
T
= 910 °C; (b) and (f)
T
= 850 °C; (c) and (g)
T
= 790 °C; and
(d) and (h)
T
= 730 °C.
(i) The degree of the β to α phase transformation at the same temperatures
is at much advanced stage when the lower cooling rate is applied
(compare Fig. 8.8a with 8.8e, 8.8b with 8.8f, etc.). This is in agreement
with the experimental study of the kinetics of the same phase
transformation at the same cooling rates using differential scanning
calorimetry (Chapter 7).

Titanium alloys: modelling of microstructure224
(c) Cooling rate 10 °C/min at 790 °C
Temp 790 °C
.13
.12
.11
.10
.09
.08
.07
.06
.05
.04
.03
.02
(d) Cooling rate 10 °C/min at 730 °C
Temp 730 °C
.13
.12
.11
.10
.09
.08
.07
.06
.05
.04
.03
.02
(e) Cooling rate 30 °C/min at 910 °C
Temp 910 °C
.13
.12
.11
.10
.09
.08
.07
.06
.05
.04
.03
.02
8.8
Continued
Finite element method: morphology 225
(f) Cooling rate 30 °C/min at 850 °C
Temp 850 °C
.13
.12
.11
.10
.09
.08
.07
.06
.05
.04
.03
.02
(g) Cooling rate 30 °C/min at 790 °C
Temp 790 °C
.13
.12
.11
.10
.09
.08
.07
.06
.05
.04
.03
.02
(h) Cooling rate 30 °C/min at 730 °C
Temp 730 °C
.13
.12
.11
.10
.09
.08
.07
.06
.05
.04
.03
.02
8.8
Continued
Titanium alloys: modelling of microstructure226
(ii) The thickness of the grain boundary α phase lamellae of the
Widmanstätten morphology is larger and their number is smaller when
the slower cooling rate is applied (compare Fig. 8.8a–d with Fig. 8.8e–
h). This is in agreement with the metallographic observation of the
features of the phase transformation and a general knowledge of the
influence of the cooling rate on the α phase lamellae morphology and
the size and distribution of the fine microstructure in the Ti-6Al-4V
alloys.
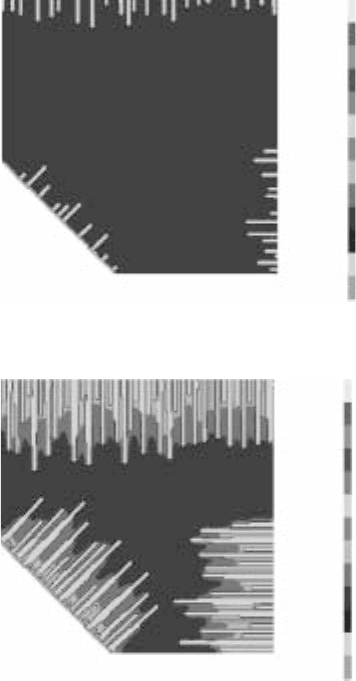
A more realistic numerical simulation of the β to α phase transformation,
when the grain boundary α phase colonies grow in different directions, is
presented in Fig. 8.9. This case takes into account the 2-D impingement of
the colonies growing in the different directions. We consider the nucleation
and growth of α plates on a sector of a β phase grain with a long dimension
of 150 µm. The evolution of the morphology of the microstructure at different
stages (temperatures) simulated from the model is traced in Fig. 8.9a–e. The
transformation starts with the first nucleus at around 960 °C. With further
decrease of the temperature, α phase colonies grow in the different directions
until the transformation is nearly completed at about 800 °C. The calculated
average thickness of the α plates is about 6 µm, which is in good agreement
with the metallographic observations (Chapters 6 and 7).
As the next step, we simulate the evolution of the β to α phase transformation
under isothermal conditions. The starting microstructure is β phase domain
and the temperature is instantly set at any constant temperature in the α + β
equilibrium range. Figure 8.10a–d traces the morphology and the kinetics of
growth for colony of α phase lamellae on a square with length 40 µm. After
long periods of time, the concentration gradients in the β phase decrease, the
interface vanadium concentration converges to the equilibrium concentration
and the chemical potential difference ∆
µ
V
driving the vanadium atoms across
the interface converges to zero. At this stage, it can be said that the equilibrium
in respect to the amounts of the α and the β phases, as well as their chemical
compositions at this temperature, is reached, and the transformation process
is completed. Note here that the β to α phase transformation at isothermal
conditions predicted from the FEM kinetics does not fit well to the experimental
data. The model presented here shows that, at 900 °C, the transformation is
completed between the 20th
and the 30th minute (Fig. 8.10d). However, the
experimental data in Chapter 6 and the TTT diagram of this alloy conclude
that, at the same temperature, the transformation should complete between
the first and the sixth minute, depending on the real composition of the alloy.
There are at least two reasons for this difference: (i) in this model we consider
nucleation and growth of only one α colony, which is far from the realistic
case of simultaneous nucleation and growth from real starting microstructure
with many grains in both direction of each grain boundary; and (ii) we
Finite element method: morphology 227
consider the 2-D case, which does not take into account the diffusional
redistribution and the growth in the third direction.
It this respect it is worth mentioning that it was possible to fit the kinetics
under isothermal conditions predicted from the FEM to the experimental one
when the diffusion coefficient of vanadium in the β phase was increased by
from 10 to 50 times.
(a) at 930 °C
Temp 930 °C
.13
.12
.11
.10
.09
.08
.07
.06
.05
.04
.03
.02
(b) at 880 °C
Temp 880 °C
.13
.12
.11
.10
.09
.08
.07
.06
.05
.04
.03
.02
8.9
FEM simulations for the microstructure evolution of the β to α
phase transformation in Ti-6Al-4V alloy at continuous cooling with
constant cooling rate of 5 °C/min, assuming α colony growth in three
different directions. The scales to the right of each figure represent
vanadium concentration. (a) 930 °C; (b) 880 °C; (c) 850 °C; (d) 800 °C;
(e) 730 °C.