Tennick A. Practical PowerPivot & DAX Formulas for Excel 2010
Подождите немного. Документ загружается.

224 Practical PowerPivot & DAX Formulas for Excel 2010
Syntax
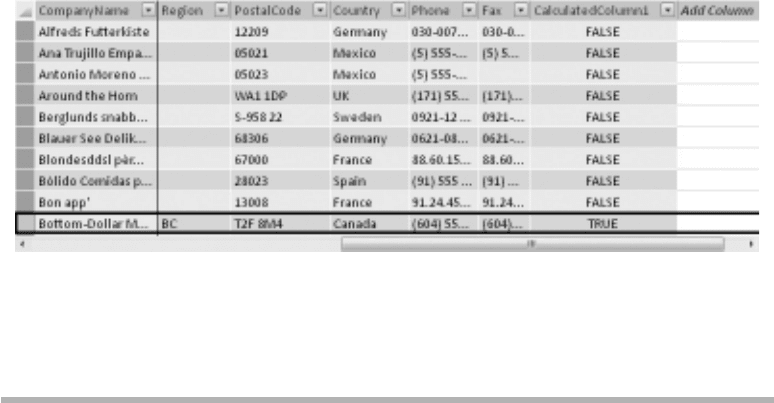
=IF(ISBLANK(Customers[Region]),FALSE(),TRUE())
Result
Analysis
We’ve met this example a few times. For instance, it was used earlier in this chapter for
the FALSE() function.
VALUES()
This is the final function in this chapter. Please note that VALUES() can’t be used
directly to give a value for a calculated column or a measure, as it returns a table of rows.
Don’t confuse VALUES() with VALUE()—the latter is a Text function for converting
strings into numbers.
VALUES() is a Filter function. The examples are measures. Your figures may differ if
you have a different release of Northwind from the one used here.
Syntax
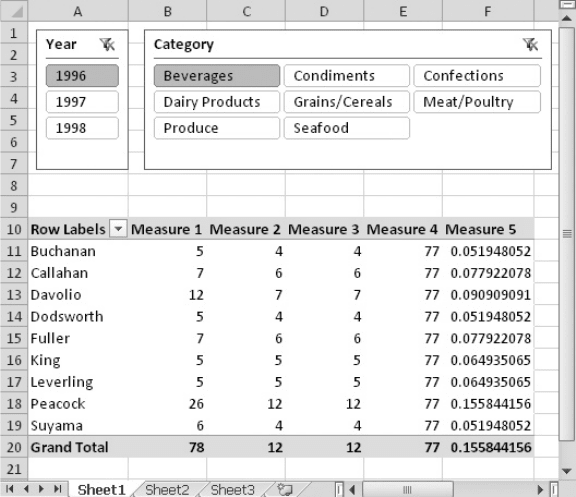
=COUNTROWS('Order Details')
=COUNTROWS(DISTINCT('Order Details'[ProductID]))
=COUNTROWS(VALUES('Order Details'[ProductID]))
=CALCULATE(COUNTROWS(VALUES('Order Details'[ProductID])),
ALL('Order Details'))
=[Measure 3]/[Measure 4]
Chapter 6: Fundamental Functions 225
Result
Analysis
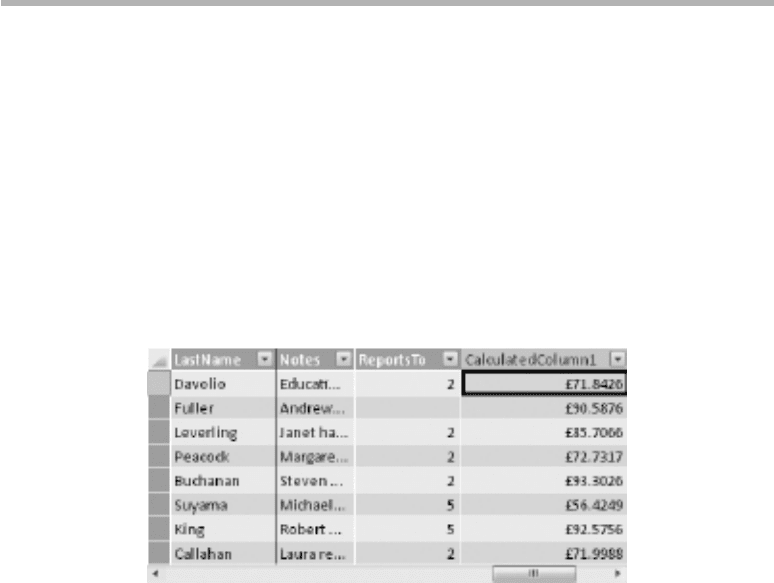
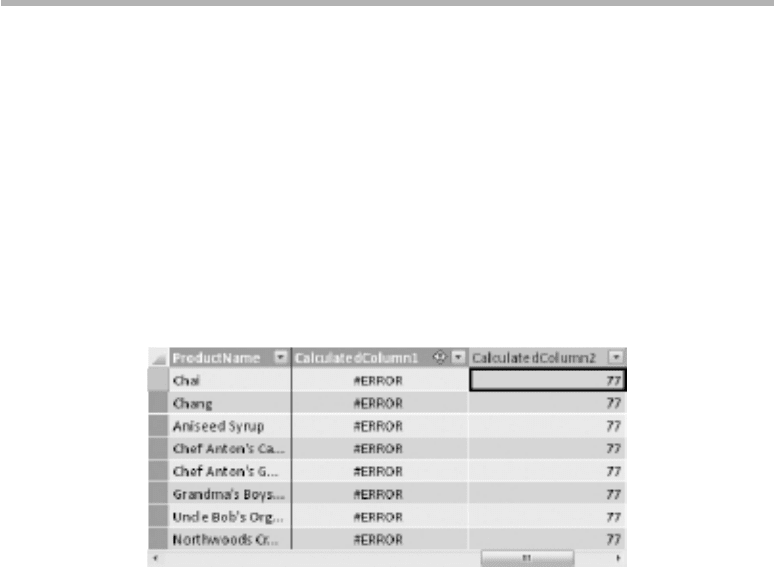
These are fairly complex examples with which to finish the chapter. The first example
shows how many order lines (as opposed to orders) are attributable to each employee.
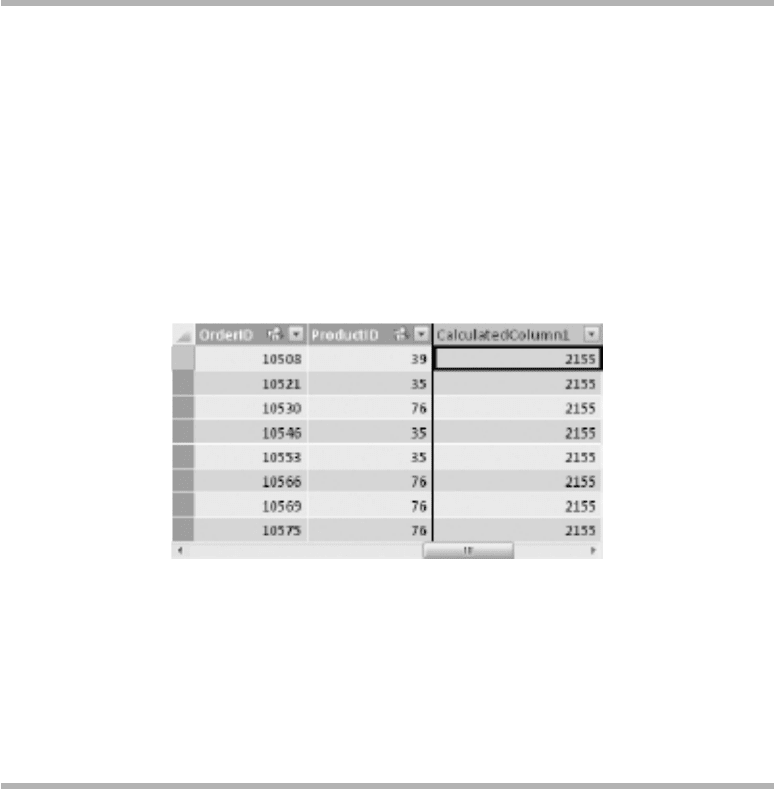
If you look at the Order Details table in the PowerPivot window, you can see there are
2155 rows, which matches the Grand Total (to see that figure, remove any slice on Year
or Category). The second and third examples tell us how many distinct products were
sold by each employee. The fourth calculated column is showing the total number of
distinct products in all the order lines. Because it’s using ALL('Order Details'),
it overrides all filter contexts including that of employee. The final calculated column
is a “percentage of all” column—the denominator is fixed. In 1996, Buchanan had five
order lines for products belonging to the Beverages category. Of these, four were unique
products—in other words, two of the order lines must have been for the same product.
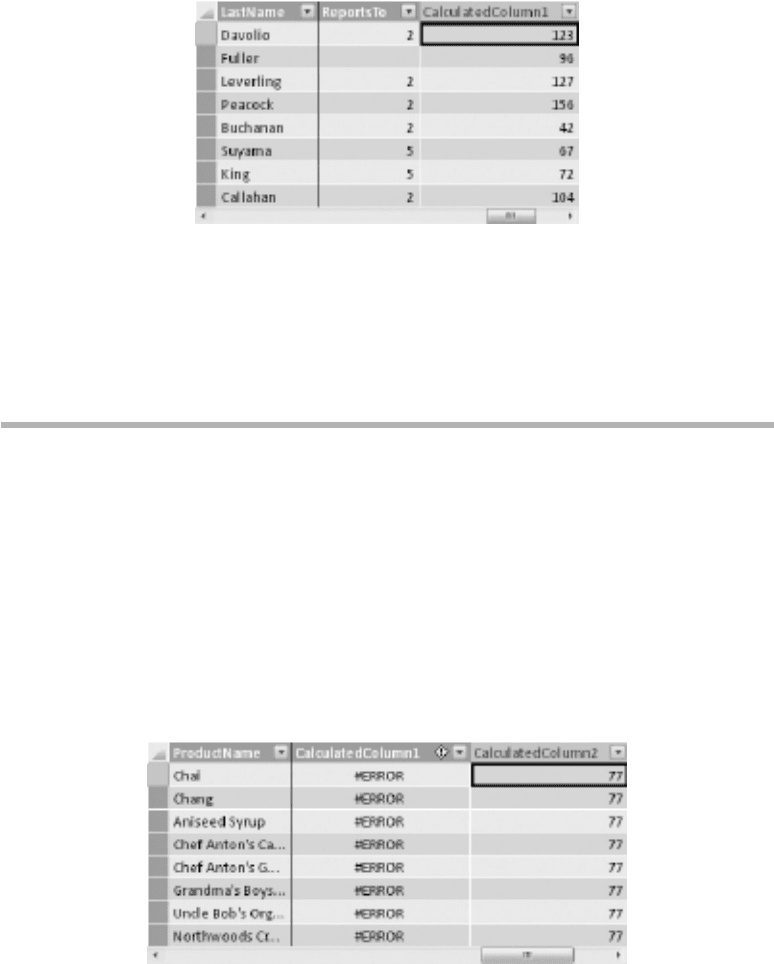
The total number of unique products (regardless of category) appearing in order lines
is 77. If you prefer a “percentage of parent” answer showing the total number of unique
products by category, change the fourth formula to this:
=CALCULATE(COUNTROWS(VALUES('Order Details'[ProductID])),ALL('Orders'))
226 Practical PowerPivot & DAX Formulas for Excel 2010
If you try this, in 1996, Buchanan sold 4 out of a possible 12 products from the
Beverages category.
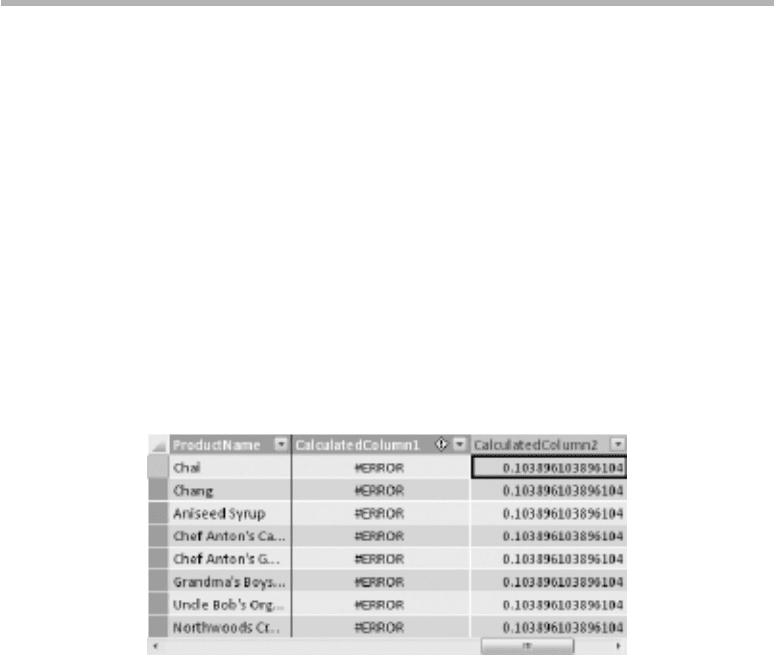
Like DISTINCT(), VALUES() eliminates duplicate values. Unlike DISTINCT(),
it will include the Unknown member if there is one. Unknown members can occur
as a result of referential integrity violations between related tables. This is possible if
the data from one table is refreshed independently of the data in a related table. In
our sample Northwind data, there are no Unknown members, so the second and third
examples presented give the same answers. CALCULATE() and ALL() are examined
earlier in this chapter. COUNTROWS() is covered in the next chapter.
Aggregate Functions:
Statistical Functions
and SUM()/SUMX()
Functions
Chapter 7
228 Practical PowerPivot & DAX Formulas for Excel 2010
T
he aggregate functions include the Statistical functions and both SUM() and
SUMX() from the Math & Trig functions. Such functions often result in
numeric values. The functions can be used equally well as calculated columns
or as measures. If used as calculated columns, they are often added to the Values drop-zone
in the PowerPivot Field List and displayed in the central data area of a pivot table.
They are ideally suited for producing totals and subtotals. In this chapter, the alphabetical
order of the functions has not been observed completely. For example, AVERAGEX()
appears before AVERAGEA(), but after AVERAGE()—this is to highlight the difference
between a base column function, such as AVERAGE(), and its table function equivalent,
AVERAGEX(). AVERAGEA(), another column function, then follows. In general, the
X-functions, for instance, AVERAGEX(), accept a table argument. The base functions,
like AVERAGE(), accept a column argument, and they operate on numeric or date
values. The A-functions, for example, AVERAGEA(), also accept a column argument, but
they usually work on every value in a column, even text and blank values.
C
Key concepts Aggregating data, averaging data, counting rows, summing data,
finding minimum and maximum values
C
Keywords AVERAGE(), AVERAGEX(), AVERAGEA(), COUNT(), COUNTX(),
COUNTA(), COUNTAX(), COUNTBLANK(), COUNTROWS(), MAX(), MAXX(),
MAXA(), MIN(), MINX(), MINA(), SUM(), SUMX()
AVERAGE()
AVERAGE() finds the mean of all the numeric values in the specified column. The
average of date values is returned as a serial number.
This example is a calculated column in the Order Details table.
Syntax
='Order Details'[Sales Amount] - AVERAGE('Order Details'[Sales Amount])
Result
Chapter 7: Aggregate Functions 229
Analysis
The example calculates the deviation from the mean for the sales on each order line.
Blank or TRUE/FALSE values are ignored. Zeros count toward the total number of
rows. You can’t calculate AVERAGE() on a column that contains text. The AVERAGE()
function only accepts a column—the following expression is invalid as an input:
=AVERAGE('Order Details'[Quantity] * 'Order Details'[UnitPrice])
AVERAGEX()
This is an X-function. It takes a table as its first parameter—if you try a column instead,
you’ll receive an error. The second parameter is the column, or expression with scalar
result, that you wish to average.
This example is a calculated column in the Employees table.
Syntax
=AVERAGEX(RELATEDTABLE(Orders),Orders[Freight])
Result
Analysis
Here, RELATEDTABLE() is used to generate a table, which is then passed into
AVERAGEX() as the first argument. The second argument causes AVERAGEX() to
calculate the mean freight charge of all orders gained by each employee. Michael
Suyama has the lowest freight charges.
230 Practical PowerPivot & DAX Formulas for Excel 2010
AVERAGEA()
Here we see the first of the A-functions. Unlike the X-functions, the A-functions
require a column as their first parameter. Also, unlike the X-functions, the A-functions
take only a single parameter. In those respects, AVERAGEA() is similar to the base
function, AVERAGE(). However, there is a major difference between the base functions
and the A-functions—the A-functions can cope with non-numeric and non-date data.
These examples are calculated columns in the Products table.
Syntax
=AVERAGE(Products[Discontinued])
=AVERAGEA(Products[Discontinued])
Result
Analysis
The Discontinued column has a data type of TRUE/FALSE. The first example,
AVERAGE(), generates an error. AVERAGEA() does not give an error. A TRUE counts
as 1 and a FALSE as 0. A text value would also count as 0. If you multiply the result
here by 77 (the total number of rows), the answer is 8. This indicates that 8 products are
discontinued. The COUNTROWS() function would give you the total number of rows in
a table. You could achieve the same answer (8) with the following formulas:
=COUNTROWS(FILTER(Products,[Discontinued]=TRUE))
=COUNTAX(FILTER(Products,[Discontinued]=TRUE),[Discontinued])COUNTAX()
and COUNTROWS() are examined in this chapter, and FILTER() was discussed
in the last chapter.
Chapter 7: Aggregate Functions 231
COUNT()
COUNT() is a base aggregate function. Just as with AVERAGE(), there are A-function
and X-function variations. In addition, there is also an AX-function version as well.
This example is a calculated column in the Order Details table.
Syntax
=COUNT('Order Details'[Discount])
Result
Analysis
The result is 2155. This does not necessarily mean there are 2155 rows in the table.
Rather, it indicates that 2155 rows contain a number (or date) in the specified column.
To return the number of rows in the table, COUNTROWS() is better, as COUNT() does
not count non-numeric or non-date values. In this case, every row in the Discount
column contains a number, so it does represent the total count of the rows in the table.
COUNTX()
This is the X-function version of the base COUNT() function.
This example is a calculated column in the Employees table.
Syntax
=COUNTX(RELATEDTABLE(Orders),Orders[EmployeeID])
232 Practical PowerPivot & DAX Formulas for Excel 2010
Result
Analysis
The answer shows how many orders were attributable to each employee. It works as the
EmployeeID column is numeric. COUNTX() also works on dates. If you want to count
non-numeric or non-date values in a table, try COUNTAX(). If you wish to count the
same in a column, use COUNTA(). These two functions are covered next.
COUNTA()
This time, it’s the A-function version of COUNT().
These examples are calculated columns in the Products table.
Syntax
=COUNT(Products[Discontinued])
=COUNTA(Products[Discontinued])
Result
Chapter 7: Aggregate Functions 233
Analysis
The Discontinued column has a data type of TRUE/FALSE. Consequently, the first
example results in an error as it uses COUNT(). But COUNTA() is rather more successful.
COUNTAX()
COUNTAX() is the AX-function variety of COUNT(). The A means count non-numeric
and non-date values, and the X means count a table-column rather than just a column.
These examples are calculated columns in the Products table.
Syntax
=COUNTX(Products,Products[Discontinued])
=COUNTAX(Products,Products[Discontinued])
Result
Analysis
The first formula fails as the Discontinued column is a TRUE/FALSE column. The
second formula produces the same result as the following formula:
=COUNTA(Products[Discontinued])
COUNTA() is simpler. COUNTAX() is more powerful, as you can apply it to another
related table (using RELATEDTABLE()) or to a filtered table (using FILTER()).