Труды Всемирного конгресса Международного общества солнечной энергии - 2007. Том 2
Подождите немного. Документ загружается.


EXPERIMENTAL STUDY OF ELECTRICITY GENERATION BY PHOTOVOLTAIC
THERMAL COLLECTORS: COMPARISON WITH CONVENTIOAL
PHOTOVOLTAIC PANELS
Jiachen Su, Shujuan Wang¢, Changhe Chen
Key Laboratory for Thermal Science and Power Engineering of the Ministry of Education,
Department of Thermal Engineering, Tsinghua University
Beijing 100084, P. R. China
wangshuj@tsinghua.edu.cn
ABSTRACT
A hybrid photovoltaic/thermal collector (PV/T) is designed
to improve electrical efficiency and supply thermal energy
and electrical energy simultaneously. In this work, A PV/T
system was built, which includes PV/T collector, water tank,
pump, measurement apparatus, and data collecting system.
A conventional PV panel is installed for comparison. The
study focuses on the electrical, thermal efficiency of the
system, and the comparison of different components
temperature. The results show that electrical efficiency of
PV/T is remarkably improved by the cooling comparing
with that of PV; meanwhile the thermal energy produced is
also considerable. The highest water tank temperature for
21 days indicates there is an upper limit of water
temperature which should be considered for practical use of
hot water. Some suggestions for the optimization of the
design of PV/T system are also given.
1. INTRODUCTION
The electrical efficiency of solar cells is generally
temperature dependent and it is reduced when the
temperature increases. The following equation shows how
the efficiency decreases as the temperature increases
[1]:
(- )nn TTμ=+ (1)
Hybrid photovoltaic-thermal (PV/T) system is designed to
maintain relative low temperature to improve electrical
efficiency by flowing either water or air below photovoltaic
cell, as well as take advantage of the thermal energy, thus
convert solar energy into both electrical and thermal energy,
increase the overall energy conversion efficiency.
Different kinds of hybrid PV/T systems have been
proposed in the past. Kern and Russell [2] gave the concept
of PV/T collector using water or air as the cooling fluid.
The performance of a hybrid PV/T is evaluated in the
research of Huang et al. [3], and compared to a solar
collector. Raghuraman [4] and Yasushi Morita [5] et al.
studied the numerical method predicting the performance
of liquid and air PV/T flat plate collectors. Sound papers on
PV/T collectors have been written by H. A. Zondag et al.
[6], where nine different kinds of design of PV/T collectors
are studied and compared.
In this work, a PV/T system is constructed and its
performance has been investigated under current Beijing
environment, aiming to provide both electricity and hot
water. The analysis is carried out for electrical and thermal
efficiency of PV/T; comparison is made with a photovoltaic
cell (PV) on the photovoltaic conversion characteristic and
PV temperature.
3 SOLAR COLLECTOR TECHNOLOGIES AND SYSTEMS
873
2. EXPERIMENTAL PV/T SYSTEM
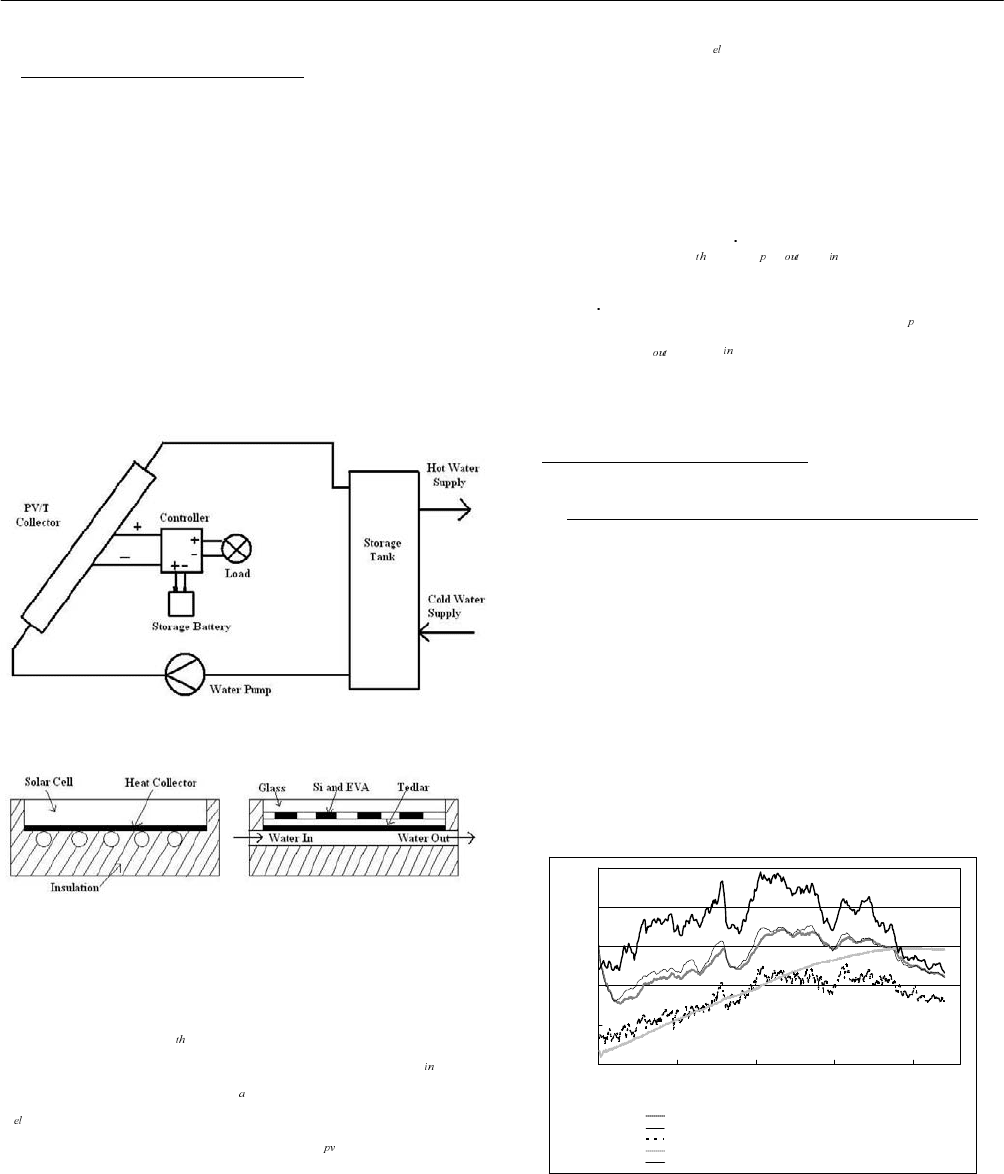
The PV/T system is shown schematically in Fig. 1 and the
cross-sectional view of the components of the system is
presented in Fig. 2. The PV/T system consists of a PV cell
(126 W), and an insulated cylindrical water storage tank of
capacity 150L. The PV cell is attached by a flat solar heat
collector (1.5 m
2
), where water circulates through pipes to
extract heat generated by PV cell. The system uses thermal
insulation material to avoid thermal losses form the non-PV
cell system surfaces. The PV/T is connected to the water
tank through insulated pipes. A water pump of 25 W is used
to circulate the water.
Fig. 1: Schematic diagram of hybrid PV/T system.
Fig. 2: Cross-sectional view of PV/T.
The experiment was carried out outdoors in Beijing, China
for determination of the performance of PV/T system. The
thermal efficiency (
η ) of the system is a function of the
solar radiation (
G ), the input water temperature ( T ) and
the ambient temperature (
T ). The electrical efficiency
η of the system depends mainly on the incoming solar
radiation and the PV cell temperature (
T ) [7].
The electrical efficiency is calculated by:
/
I
VGAη = (2)
Where I and V are the current and the voltage of PV cell,
and A the PV/T area.
The thermal efficiency is calculated by:
()/mC T T GAη =− (3)
Where
m is the water mass flow rate, C the water
specific heat,
T and T are the output and input water
temperature, respectively.
3. RESULTS AND DISCUSSIONS
3.1 The Comparison of PV/T and PV Cell Temperature
The main purpose of PV/T design is to decrease the PV cell
temperature thus enhance the electricity conversion
efficiency. For comparison, a traditional PV cell is
constructed to demonstrate the improvement of temperature.
Fig. 3 shows the temperature variation of PV/T and
traditional PV cell. Ambient temperature and water tank
temperature are also given for the reference. It can been
seen that the temperature of PV/T is always higher than that
of PV cell and the maximum difference 7.6 ć was
achieved by the cooling effect during the day time.
25
30
35
40
45
50
0 100 200 300 400
Time, minute (From 9:41AM to 17:00 PM)
Temperature,
ć
Temperature of the bottom of PV/T panel
Temperature of the top of PV/T panel
Ambient temperature
Water tank temperature
PV cell temperature
Fig. 3: Comparison of several typical temperatures.
Proceedings of ISES Solar World Congress 2007: Solar Energy and Human Settlement
874
0
100
200
300
400
500
600
700
0 100 200 300 400 500
Time, minute (From 9:41 am to 17:00 PM)
Irradiation,W/m2
Fig. 4: Irradiation during the day time for the reference,
which is typical in the summer of Beijing.
3.2 Efficiency Analysis
The PV/T system and PV cell was tested for 21 days in the
natural environment in May and June, Beijing. Comparing
PV/T and PV cell, as expected, the increase in the electrical
efficiency of PV/T is remarkable, from 0.36% to 2.6%. The
reason is certainly due to the structural difference; and thus
it has become clear that the inlet temperature and heat
transfer resistance introduced in the cell-heat collector
interface are the key design points in the study of the
optimum structure of PV/T system.
Fig. 5: Electrical efficiency of PV/T and PV cell for 21
days in May and June, 2007.
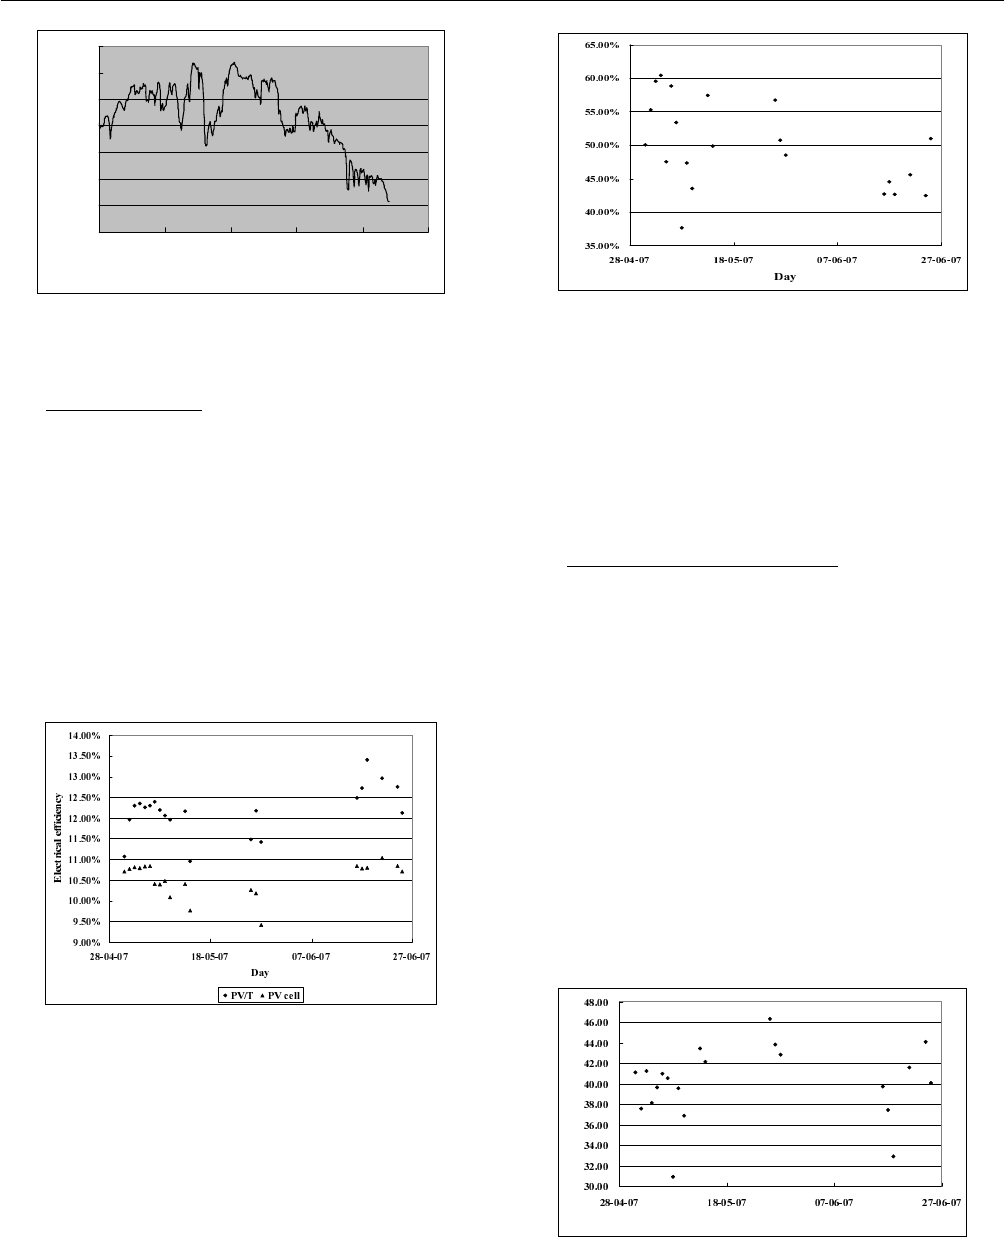
Fig. 6 indicates that the thermal efficiency of PV/T system
varies from 36% to 61%, due to different weather
conditions, especially solar irradiance. It is also need to be
noted that the PV/T system has a lower thermal efficiency
than the conventional thermal collector. This is because the
conversion of solar energy to electricity and increased heat
loss on the surface with the glass cover missing compared
Thermal efficiency
Fig. 6: Thermal efficiency of PV/T for 21 days in May and
June, 2007.
with the thermal collector. However, the PV/T system can
produce a remark able amount of thermal energy and also
electricity using equal surface area, especially when the
thermal energy and electricity are both needed and
installation room is limited.
3.3 Water Tank Temperature Analysis
It is clear from Fig. 7 that there is an upper limit on the
water tank temperature, basically no more than 45 ć
which should be considered when it comes to the
application of hot water. Whether the PV/T design is
successful or not mainly depends on the cooling effect that
can be achieved for the solar cells. So low water
temperature desired by cooling and the thermal energy
demand (comparatively high temperature) are a paradox to
some extent. Anyway this problem could be solved when
the PV/T is integrated into a system whose thermal energy
demands of temperature is sufficiently low to insure the
desired cooling effect, like floor heating systems and water
supply of swimming pool, etc..
Day
Water tank temperature
Fig. 7: The highest water tank temperature that can be
attained in a day.

3 SOLAR COLLECTOR TECHNOLOGIES AND SYSTEMS
875
4. CONCLUSIONS
A hybrid PV/T system was successfully constructed by
pasting crystalline silicon solar cells onto a flat-plate heat
collector and conventional PV cell was also installed for
comparison. Experiment was carried out outdoors in May
and June in Beijing and 21 days’ data was collected for
analysis.
A comparison of the PV/T system to a conventional PV cell
showed increased electrical efficiency; the main purpose of
PV/T design and the need of structure optimization made
the inlet temperature and heat transport between PV and
collector become key design points in the future.
The thermal efficiency of PV/T is lower than conventional
heat collector, but this can be compensated by the
advantage of PV/T system that can provide multi-energy
forms and architecture uniform.
The improvement of electrical efficiency is due to the
cooling of the PV cells by low temperature water
circulation. The designed final water temperature should
therefore be seriously considered in the application of hot
water.
5. NOMENCLATURE
n the maximum power point efficiency of the
photovoltaic collector at reference conditions
μ the photovoltaic efficiency temperature coefficient
T the photovoltaic cell temperature (ć)
T the reference temperature (ć)
η thermal efficiency
η electrical efficiency
G total global solar radiation (W/m
2
)
T inlet water temperature to collector (ć)
T outlet water temperature to collector (ć)
T ambient temperature (ć)
T PV module temperature (ć)
I
charge current of PV cell to storage battery (A)
V charge voltage of PV cell to storage battery (V)
A
the PV/T area (m
2
)
m water mass flow rate (m
3
/h)
C the water specific heat ( kJ/kg K⋅ )
6. REFERENCES
(1) Duffie, J. A. Beckman, W. A., 1991. Solar Engineering
of Thermal Processes, second ed. John Willey and Sons
Inc., New York, pp. 777, 250-326
(2) E. C. Kern Jr, and M. C. Russell, combined
Photovoltaic & thermal hybrid collector system, Proc.
13
th
IEEE Photovoltaic Specialist, Washington DC,
USA, (1978) 1153-1157
(3) Huang, B. J., Lin, T. H., Hung, W. C., Sun, F. S., 2001.
Performance evaluation of solar photovoltaic/thermal
systems. Solar Energy 70, 443-448
(4) P. Raghuraman, Analytical predictions of liquid and air
photovoltaic/thermal flat plate collector performance, J.
Sol. Energy Eng., 103 (1981) 291-298
(5) Yasushi Morita, Toru Fujisawa, and Tatsuo Tani,
Moment Performance of Photovoltaic/Thermal Hybrid
Panel (Numerical Analysis and Exergetic Evaluation).
Electrical Engineering in Japan, Vol. 133, No. 2, 2000
(6) H. A. Zondag, D. W. de Vries, W. G. J. van Helden, et al.
The yield of different combined PV-thermal collector
designs. Solar Energy, 2003 (74): 253-269
(7) S. A. Kalogirou, Y. Tripanagnostopoulos. Hybrid PV/T
solar systems for domestic hot water and electricity
production. Energy Conversion and Management 47
(2006) 3368-3382

POTENTIAL APPLICATION OF COMBISYSTEM FOR AN AUSTRALIAN
CLIMATIC REGION
E. Halawa
1
,
F. Bruno
2
,
W. Saman
3
Sustainable Energy Centre - University of South Australia
Mawson Lakes SA 5095 - Mawson Lakes – Adelaide, Australia
1
edward.halawa@unisa.edu.au,
2
frank.bruno@unisa.edu.au,
3
wasim.saman@unisa.edu.au
ABSTRACT
Australian climate is characterised by its more sunny days
with mild winter condition compared to Europe. Solar
water heating systems have been in the market for many
years to provide domestic hot water to main cities in
Australia. The market for these systems have been
constantly growing and relevant Australian Standards have
been developed. This trend is expected to remain in the
near future. The paper reports on the results of a recent
numerical study on the potential application of a solar
combisystem to provide both space heating and domestic
hot water (DHW) for a two storey house in Adelaide,
Australia. The house space heating requirement was
estimated using AccuRate, a building energy rating
software developed in Australia, whilst the domestic hot
water requirement is based on the Australian Standard AS
4234. The system modelling was carried out using the
TRNSYS simulation package. In the study, the thermal
performance of flat plate and evacuated type collectors are
compared. A number of factors such as effects of tank size,
collector slopes and system configuration are investigated.
1. INTRODUCTION
In Australia, space heating represents about 38% and
domestic water heating about 27 % of the energy demand
of residential buildings. [AGO, 1999].
Solar water heating is a well-established technology. In
1999/2000 the number of solar hot water heaters installed
in domestic sector in Australia reached 36000 units,
consisting of 32000 electric boosted systems and 6000 gas
boosted systems (Ellis & Associates, 2001). In Australia
more market penetration of this technology is expected due
to improved public environmental awareness and
government’s financial inducements (Lee et al., 2003).
Solar space heating systems, on the other hand, have not
gained market acceptance due mainly to high initial cost. In
addition, only a small amount of total annual heat collected
by the system is eventually utilised due to the short period
of the heating season throughout the year.
Combisystems - which provide both space heating and
domestic hot water - have been introduced in homes in a
number of European countries. About one quarter of solar
collectors installed in central Europe in 2001 are used for
combisystems (Frei, 2003). The total area of collectors
installed in 2001 in Sweden was larger for combysystems
than for DHW (Weiss, 2003).
The combisystem’s appeal in Europe is largely due to the
fact that residential space heating requirements are much
higher (up to 3 – 5 times) than for DHW, especially in
middle and northern Europe (Gajvert & Fiedler, 2003).
Australian conditions are different. As mentioned earlier,
Australian heating energy requirements are only slightly
above DHW requirements. Also, compared to Europe, the
majority of Australian regions enjoys relatively large
3 SOLAR COLLECTOR TECHNOLOGIES AND SYSTEMS
877
number of sunny days throughout the year even in regions /
cities where heating energy requirements are dominant such
as Adelaide (South Australia) and Melbourne (Victoria).
This paper presents the results of a study on the potential
application of a solar combisystem to provide both space
heating and DHW for an environmentally friendly two
storey house in Adelaide, Australia.
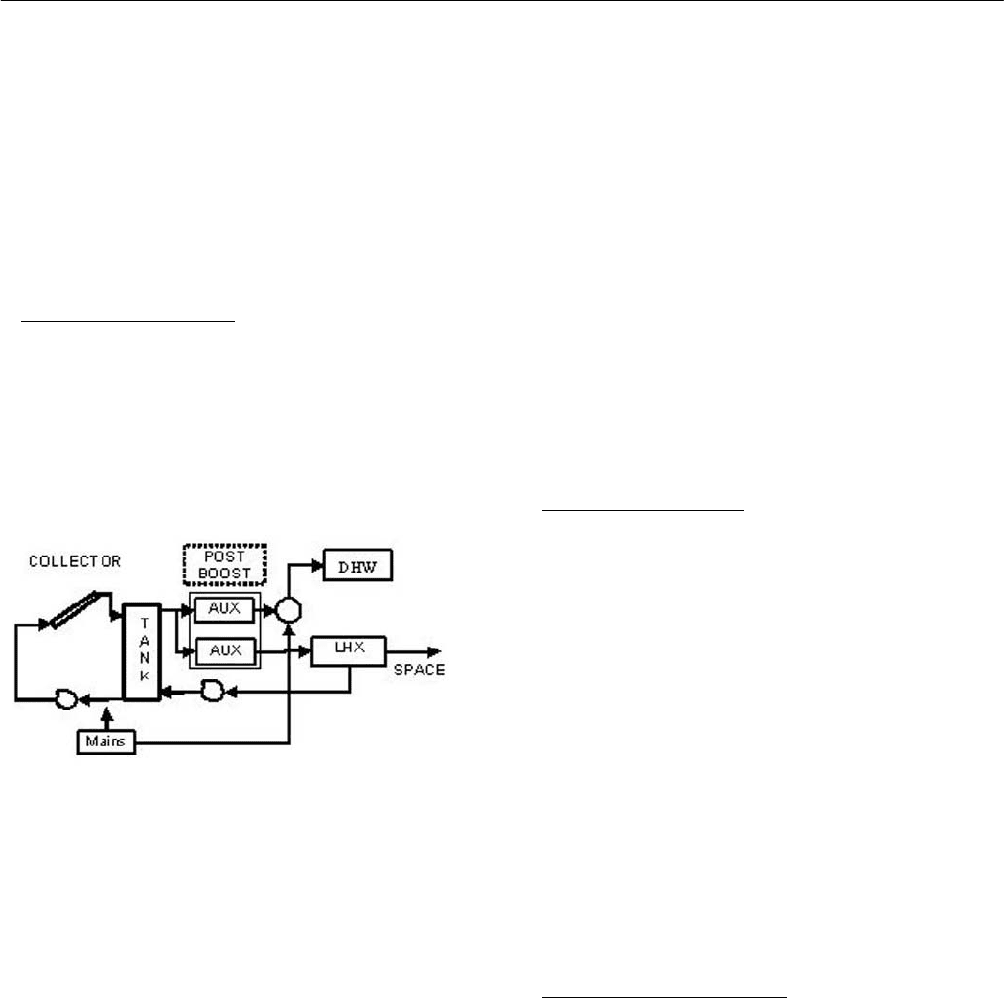
2. SYSTEM DESCRIPTION
Fig. 1 shows the schematic of the system modelled. The
system consists of a collector array, a hot water storage
tank and gas post-boost system in the pipe outlets, piping
for hot water and cold water from the mains and the two
loads.
Fig. 1: Schematic of the Proposed Solar CombiSystem.
Energy is delivered to the house through a water-to-air load
heat exchanger, namely a fan coil unit.
Based on the local solar hot water manufacturer’s advice
and on recent technology developments in Europe (Weiss,
2003), it was decided to serve both loads using a single
stratified storage tank. The water heated by the solar
collector is stored in the tank and is delivered as hot water
at the temperature of 50ºC. If solar energy heats the upper
portion of the tank above 50ºC then a bypass system takes
mains water and mixes it with the hot water to deliver it at
50ºC.
The gas post boost system maintains the temperature of
water entering the load heat exchanger at 60ºC. The boost
system is located in the pipe outlets and is of sufficient
capacity that it can supply all of the domestic hot water and
space heating energy requirements.
Water at 60ºC or higher is removed from the top of the tank,
circulated through a water-to-air load heat exchanger (LHX)
and returned to the tank. The flow rate of the water is
controlled so that it exactly meets the house heating load.
Since the heating load profile was provided (see Section 4),
no building modelling was incorporated. However, the set
room point temperature is assumed 21ºC and LHX heats
the air to 35ºC. This data is used to estimate the water flow
rate to heat the space.
The system simulation was carried out using the
TRNSYS 16 simulation package (TRNSYS 16, 2004).
3. HOUSE DESCRIPTION
The house has two storeys with a total floor area of 213 m
2
(first floor: 140 m
2
and second floor: 73 m
2
). It has reverse
brick veneer external walls insulated with R2.5 rockwool
batts with reflective foil The roof/ceiling of the house is
insulated with R4 rockwool batts.
The windows of the house are double glazed 4 mm clear
with 12 mm argon filled and low E film. It has solid
construction external doors.
All these and other detailed house specifications were input
to the AccuRate software to estimate the hourly energy
requirements of the house for a one year period. Adelaide
weather data was used in the simulation.
4. HEATING LOAD PROFILES
The monthly figures for DHW loads were derived from
Australian Standard 4234-1999 which provides seasonal
(monthly) load profile, hourly load profile and monthly
cold water temperatures.
Monthly space heating (SH) loads were estimated using an
Australian building energy rating software, AccuRate
(Hearne website, 2006). This software was used to model
the house because it has a built-in library which contains
local manufacturers’ data for various building materials
Proceedings of ISES Solar World Congress 2007: Solar Energy and Human Settlement
878
(walls, windows, etc) relevant to Australian conditions.
Fig. 2 shows monthly profiles of DHW and SH loads.
0
500
1000
1500
2000
2500
3000
3500
Jan Feb Mar Apr May Jun Jul Aug Sep Oct Nov Dec
Month
Load, MJ
DHW SH TOTAL
Fig. 2: Monthly DHW and SH load profiles.
Annual figures for each load type are: 12,546 MJ (DHW)
and 6,010 MJ (SH). Although annual SH load is less than
annual DHW load, on the monthly basis the SH load
represents the larger portion of peak winter loads of June –
August. The heating load for the months from April to
September represents 68.2% of the annual heating load
compared to 31.8% for summer months.
These two factors significantly affect the thermal
performance of the proposed combisystem.
5. COLLECTORS AND TANK SPECIFICATIONS
In the study, two types of collectors were studied and their
performances were compared. The first collector is of flat
plate (FP) type having the following instantaneous
efficiency curve coefficients: a
0
= 0.74, a
1
= 14.23
kJ/hgm
2
K, and a
2
= 0.056016 kJ/hgm
2
K
2
.
The second collector is of an evacuated tube (ET) type with
the following instantaneous efficiency curve coefficients: a
0
= 0.717, a
1
= 5.472 kJ/hgm
2
K, and a
2
= 0.0306 kJ/hgm
2
K
2
.
The system has the following values of incident angle
modifier (IAM):
ȱ 0 10 20 30 40 50 60 70 80 90
K 1.0 1.0 0.99 0.98 0.96 0.93 0.87 0.74 0.38 0
K 1.0 1.02 1.08 1.18 1.37 1.4 1.34 1.24 0.95 0
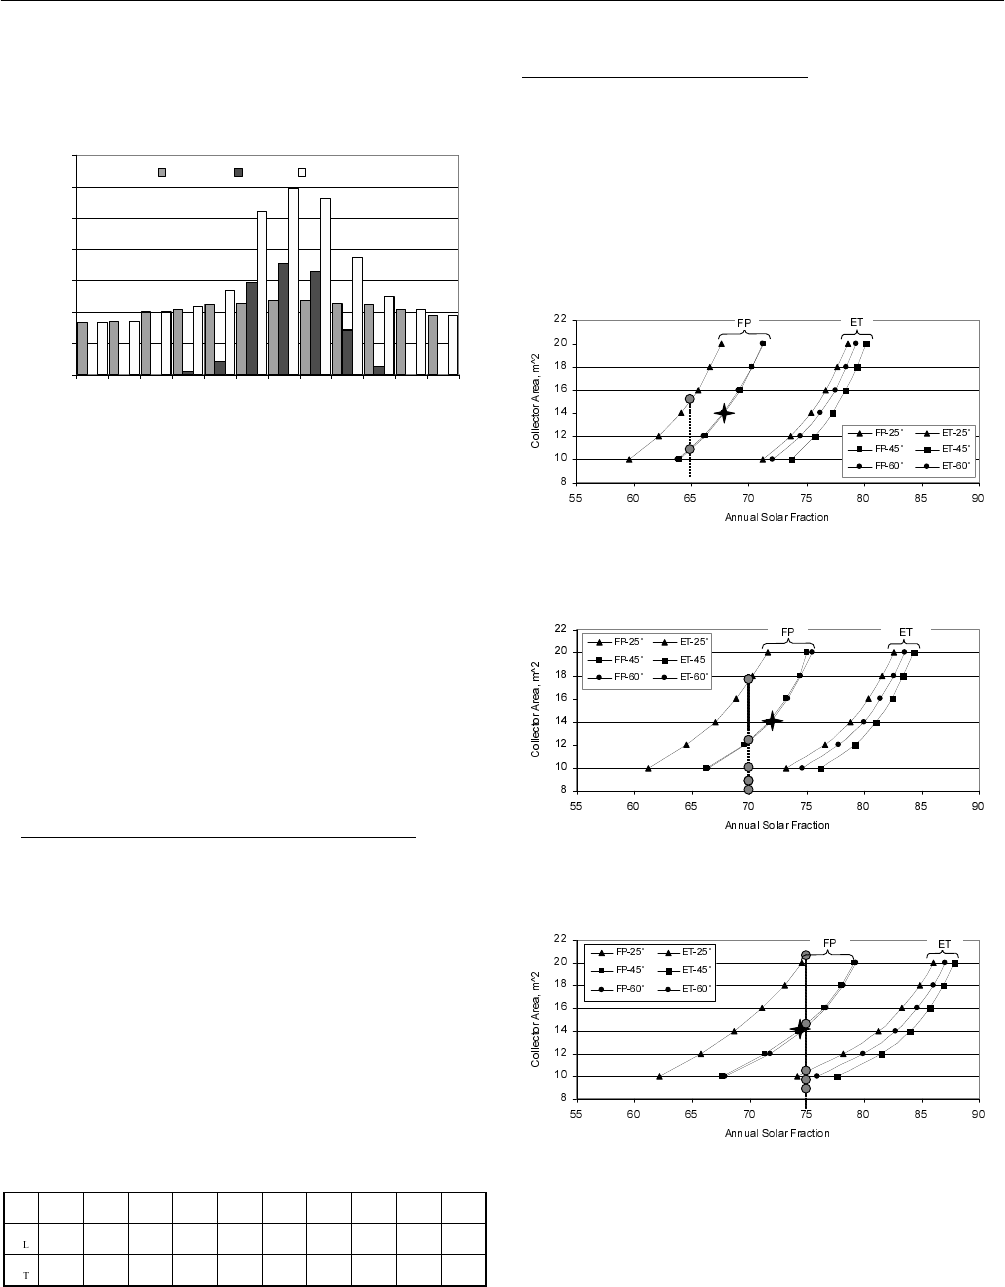
6. RESULTS AND DISCUSSIONS
Figures 3-5 show the simulation results for both systems
with different collector areas and slopes attached with a 315
L, 450 L or 630 L tank. The graphical presentation of the
results is such that one can easily locate a point in each
curve of each figure which gives a certain value of the
annual solar fraction.
Fig. 3: Annual Solar Fraction vs. Collector Area – 315 L
storage tank.
Fig. 4: Annual Solar Fraction vs. Collector Area – 450 L
storage tank.
Fig. 5: Annual Solar Fraction vs. Collector Area – 630 L
storage tank.
For example, an annual fraction of 65% can be produced by
the FP system attached to a 315 L tank and tilted at 25º
3 SOLAR COLLECTOR TECHNOLOGIES AND SYSTEMS
879
with a collector area about 15 m
2
(see the top black circle
on the vertical red line, Figure 3). The same solar fraction
can be produced if the system is tilted 45º or 60º with 11 m
2
collector area.
Using the ET system, the same solar fraction can be
attained at a much reduced solar collector area at different
collector slopes.
In Fig. 4, the system with a 450 L tank, a solar fraction of
70% can be attained by the FP system tilted at 25º with a
collector area of nearly 18 m
2
; or, if tilted at 45 or 60º, the
same fraction can be attained with 12 m
2
collector area.
Using the ET system, the same solar fraction can be
attained with a collector area of about 8 – 9 m
2
at collector
slopes of 25 – 60º.
In Fig. 5, the system with a 630 L tank, a solar fraction of
75% can be attained by the FP system tilted at 25º with a
collector area of about 21 m
2
. If tilted at 45 or 60º, the same
fraction can be attained with a collector area of about 15 m
2
.
Using the ET system, the same solar fraction can be
attained with a collector area of about 9 – 11 m
2
at collector
slopes of 25 – 60ºC.
Effect of tank volume
From Figures 3 - 5 we can also see the effect of tank
volume on the performance of a system with a given
specification. For example, the points marked with a cross
star represent the FP system with a collector area of 14 m
2
tilted at either 45 or 60º. As shown, an increase in tank
volume from 315 L to 630 L increases the solar fraction
from about 67.5% to about 74%. However at higher tank
volumes (630 – 945) this effect is marginal (the results for
tank volumes above 630 are not shown).
Effect of Collector Slope
Four collector slopes were simulated to see how it affects
the systems’ performance. The 25º slope represents the
conventional roof pitch in South Australia, the 45º and 60º
represent the favourable slope angle in terms of solar gain
during winter. The 90º slope (vertical position) makes it
possible to position the solar system in the north wall of the
building.
As shown, for the FP system, 45º and 60º slopes give the
best solar fractions for fixed solar collector areas and tank
volumes. For the ET system, the 45º slope gives the highest
solar fraction for a fixed collector area and tank volume.
For both systems, the vertical position (90º) should be
avoided as it results in poor solar fractions.
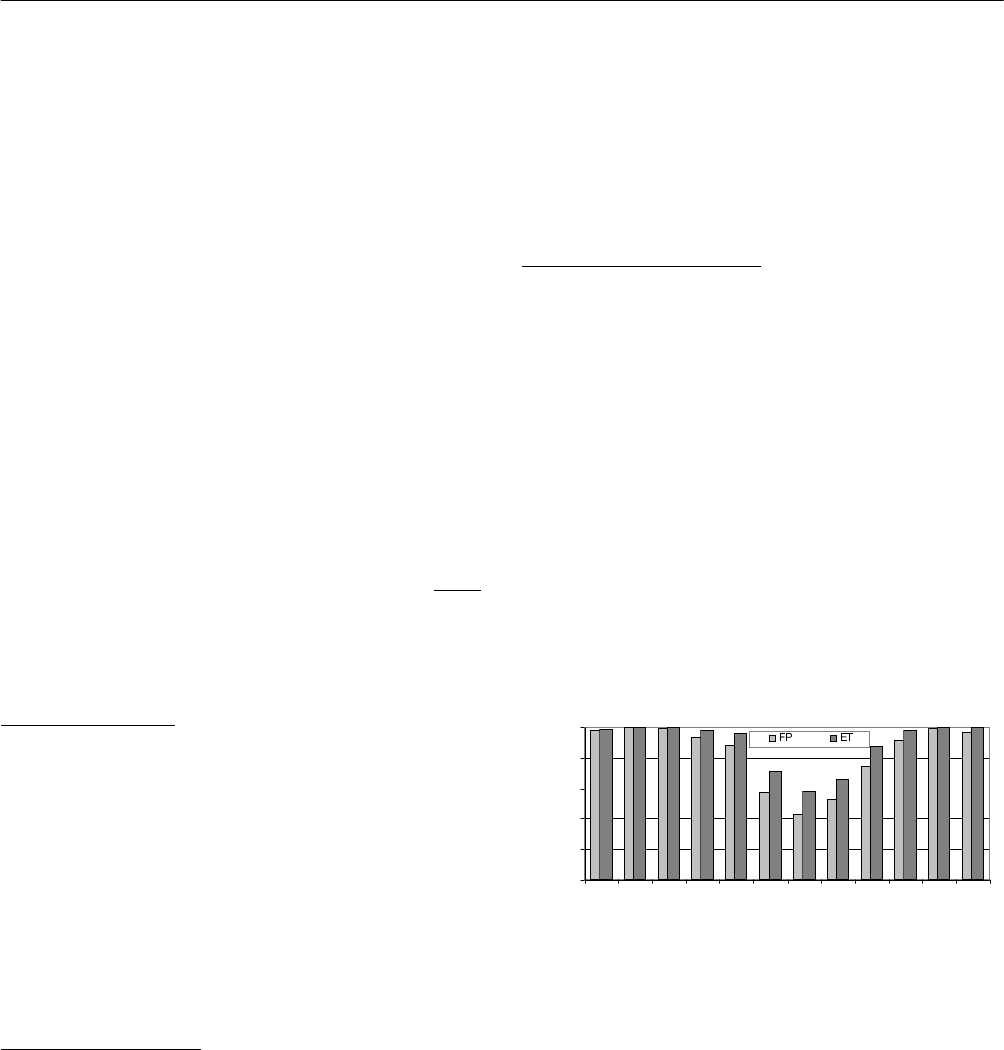
Monthly System Performance
Figure 6 shows the monthly solar fraction of a system with
12 m
2
collector area mounted with 45º slope facing north
with a 450 L tank. The figure represents the trend of the
system’s thermal performance on a monthly basis in
general for both FP and ET systems.
As shown, the systems are able to provide most of the heat
energy requirements during summer, spring and autumn
and about 50% (FP) and 60% (ET) of the heating energy
requirements during the peak winter months of June –
August. The latter is mainly for winter space heating load.
The figure also shows a slightly better performance of the
ET system during the winter months compared with the FP
system.
0.0
0.2
0.4
0.6
0.8
1.0
Jan Feb Mar Apr May Jun Jul Aug Sep Oct Nov Dec
Month
Annual Solar Fraction
Fig. 6: Monthly Solar Fraction for A
C
= 12 m
2
, tank = 450
L, Slope = 45º.
It is worth comparing the results from the present study
with that from Europe. According to Charron et al. (2007),
small systems in the Netherlands consists of 4 to 6 m
2
collector with 0.3 m
3
storage tank. In Switzerland, Austria
and Sweden larger systems (with a solar fraction of 20 to
60%) typically use 15 – 30 m
2
of collector area with 1 – 3
m
3
thermal storage tank. The more favorable climatic
conditions for Australia make it possible to have smaller
systems with similar outputs.

Proceedings of ISES Solar World Congress 2007: Solar Energy and Human Settlement
880
7. CONCLUSIONS
Thermal performance analysis of solar combisystem with a
flat plate solar water heating system and the solar
evacuated tube collector system has been carried out.
Following is the summary of the findings:
As expected, the thermal performance of the
evacuated tube system is significantly better than the
flat plate system mainly due to the way the collector
surface absorbs the solar radiation and reduces heat
losses due to vacuum tube covering the absorber. This
results in a reduced collector area required to attain a
certain solar fraction.
Both systems seem to have optimum performance when
tilted at 45º at different collector areas and tank volume.
At this slope, a FP system with 450 L tank with
collector area of 12 m
2
give the solar fraction of 70%.
The ET system attains the same solar fraction at a
collector area of 8 m
2
.
The analysis reported here deals only with theoretical
performance of both systems using technical specifications
available from both systems. The analysis does not deal
with long term performance, technical reliability and the
cost of each of the systems. The continuation of this work
involves developing combined systems for the provision of
hot water, heating and cooling to improve the year round
utilization of the solar heat collected and thus improve the
economic feasibility of the system.
8. NOMENCLATURE
a
0
= collector intercept efficiency
a
1
= negative of first order efficieny coefficient, kJ/hgm
2
K
a
2
= negative of second order efficieny coefficient,
kJ/hgm
2
K
2
A
C
= collector area, m
2
K
L
= incident angle modifier, longitudinal direction
K
T
= incident angle modifier, transversal direction
9. REFERENCES
(1) Australian Greenhouse Office, Australian Residential
Building Sector – Greenhouse Gas Emissions 1990 –
2010 – Executive Summary Report, 1999.
(2) Australian Standard AS 4234-1994: Solar Water
Heaters – Domestic and Heat Pump – Calculations of
Energy Consumption.
(3) H. Gajbert & F. Fiedler, 2003: Solar combisystems – A
State of the Art Report – PhD Course on Solar Heating
– Dipl. Civil Engineering, Technical University of
Denmark (DTU), July 2003.
(4) Hearne Website - http://www.hearne.co.nz/ -
Residential Building Thermal Performance Assessment
(2006) – viewed 20 June 2007.
(5) M. Ellis. & Associates, Analysis of Potential for
Minimum Energy Performance Standards for
Miscellaneous Water Heaters – Prepared for the
Australian Greenhouse Office – Final Report.
(6) R. Charoon, A. Athienitis, M. Passini, Integrated
Design and Optimization for Zero Energy Solar Homes,
www.nrcan.gc.ca – viewed 4 July 2007.
(7) T. Lee., D. Ferrari, E. Donnelly,: Active Solar Space
Heating for a Cool Temperate Climate: A Case Study,
41
st
ANZES Solar Energy Society Conference, 2003,
Melbourne.
(8) TRNSYS 16 Reference Manual, 2004.
(9) U. Frei, Solar Thermal Collectors – State of the Art and
Further Development. ISES Solar World Congress
2003, Göteborg, Sweden.
(10) W. Weiss, Solar Heating Systems – Status and Recent
Develpments. ISES Solar World Congress 2003,
Göteborg, Sweden.

DESIGN OF A CONTROL SYSTEM USED TO SIMULATE THE DAILY VARIATION OF
SOLAR RADIATION USING ELECTRICAL POWER
Ashmore Mawire
Department of Physics and Electronics
North West University
Mafikeng Campus
Private Bag X2046
Mmabatho 2735
South Africa
ashmawire02@yahoo.co.uk
Michael McPherson
Department of Physics and Electronics
North West University
Mafikeng Campus
Private Bag X2046
Mmabatho 2735
South Africa
ABSTRACT
In order to simulate the daily variation of solar radiation, a
Visual Basic computer program has been designed to
control the power supplied to an electrical hot plate. The
program employed a combined feedforward and feedback
structure. The design can be used as a solar radiation
simulator for the design of solar concentrators and for
characterizing a TES system.
1. INTRODUCTION
The daily variation of solar radiation is of importance in
solar thermal applications which include solar water
heating and solar cooking. Domestic solar water heaters
require a knowledge of the amount of solar radiation for
their efficiency to improve [1-2]. Conventional solar
cookers without heat storage also need a measurement of
the solar energy to characterize and optimize them
accordingly [3-5]. The disadvantages of solar cookers
without thermal energy storage (TES) are that the cook ing
cannot be carried out when the sun is not available, that the
operator is dangerously directly exposed to the sun’s rays
and that the cooking capacity cannot be maximized.
Solar cookers using TES eliminate these drawbacks [6-7].
It is necessary to characterize the TES capability even
without a collector/ concentrator to capture the incident solar
energy. This can be done by using electrical power which
heats up the heat transfer fluid (HTF) in the TES. A
prototype TES and cooking system and its test facility has
been developed [8]. The solar concentrator is being
simulated by an electrical hot plate that is in thermal contact
with a hollow copper spiral coil through which a HTF flows.
Two different solar radiation models to simulate the daily
variation of solar energy have been reported [9-10]. It is
essential to use any one of the models to enable the electrical
power to follow the daily variation of solar radiation.
Simulating the solar radiation with electrical power is also
advantageous in harsh climatic conditions [11] where it is
hard to fully utilize the available solar radiation.
2. SYSTEM DESCRIPTION
2.1 Hardware Setup
The hardware setup for power control is illustrated by the
diagram of Fig. 1. A computer connected to an HP 34970A
data-logger [12] via an RS 232 interface is used to
implement the power control algorithm. Using the
Standards Commands for Programmable Instruments (SCPI)
instructions it is possible to control the functionalities of
the data-logger by utilizing the computer. An analogue
signal that is generated by the digital to analogue converter