Wai-Fah Chen.The Civil Engineering Handbook
Подождите немного. Документ загружается.

62-40 The Civil Engineering Handbook, Second Edition
analyses based on elastic theory to generate pavement thickness requirements against two failure criteria:
a fatigue-cracking criterion for the asphalt layer and a rutting criterion for the subgrade.
More comprehensive mechanistic procedures, capable of handling the following aspects in pavement
design, are available in the literature: (a) viscoelastic behavior of bituminous materials, (b) nonlinear
response of untreated granular and cohesive materials, (c) aging of bituminous materials, (d) material
variabilities, (e) dynamic effect of traffic loading, (f ) effect of mixed traffic loading, and (g) interdependency
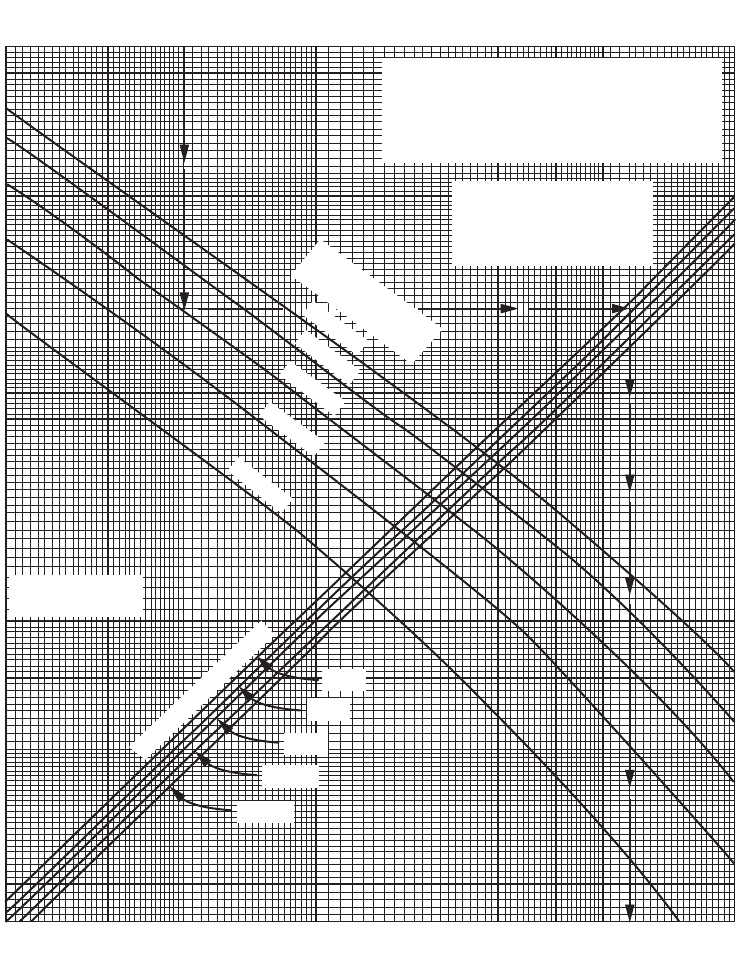
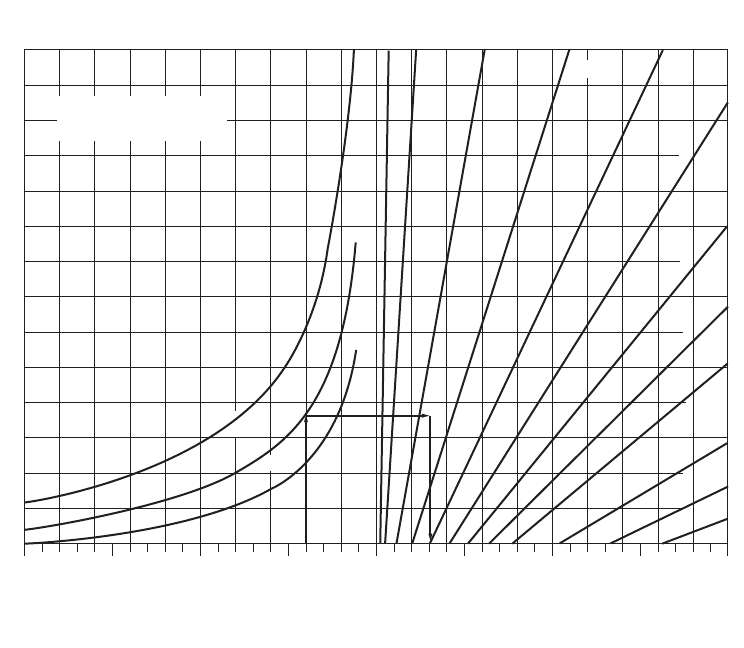
FIGURE 62.22 Critical area flexible pavement thickness for DC 10-30, 30CF, 40, and 40CF. (Source: Federal Aviation
Administration. 1978. Airport Pavement Design and Evaluation. Advisory Circular AC No. 150/5320-6C. With permission.)
NOTE: CURVES BASED ON 20-YEAR
PAVEMENT LIFE
CONTACT AREA = 331 SQ IN.
DUAL SPACING = 54 IN.
TANDEM SPACING = 64 IN.
CENTER-LINE GEAR SPACING = 37.5 IN.
THICKNESS - BITUMINOUS
SURFACES
5-IN. CRITICAL AREAS
4-IN. NONCRITICAL AREAS
GROSS AIRCRAFT
WEIGHT, LB
600,000
500,000
400,000
300,000
200,000
1 in. = 2.54 cm
1 ib. = 0.454 kg
ANNUAL DEPARTURES
1200
3000
6000
15,000
25,000
345678910 1520 30
40 50
THICKNESS, IN.
345678910 15202530
40 50
CBR
Highway and Airport Pavement Design 62-41
of the development of different distresses, including pavement roughness. Unfortunately, quantification
of necessary material properties and analysis of pavement response by these procedures are often com-
plicated, time consuming, skill demanding, and costly. Although there are great potentials for these
procedures when fully implemented, simplifications such as that adopted by the Asphalt Institute method
will have to be applied for pavement design in practice.
62.6 Structural Design of Rigid Pavements
Structural design of rigid pavements includes thickness and reinforcement designs. Two major forms of
thickness design methods are being used today for concrete pavements. The first form is an approach
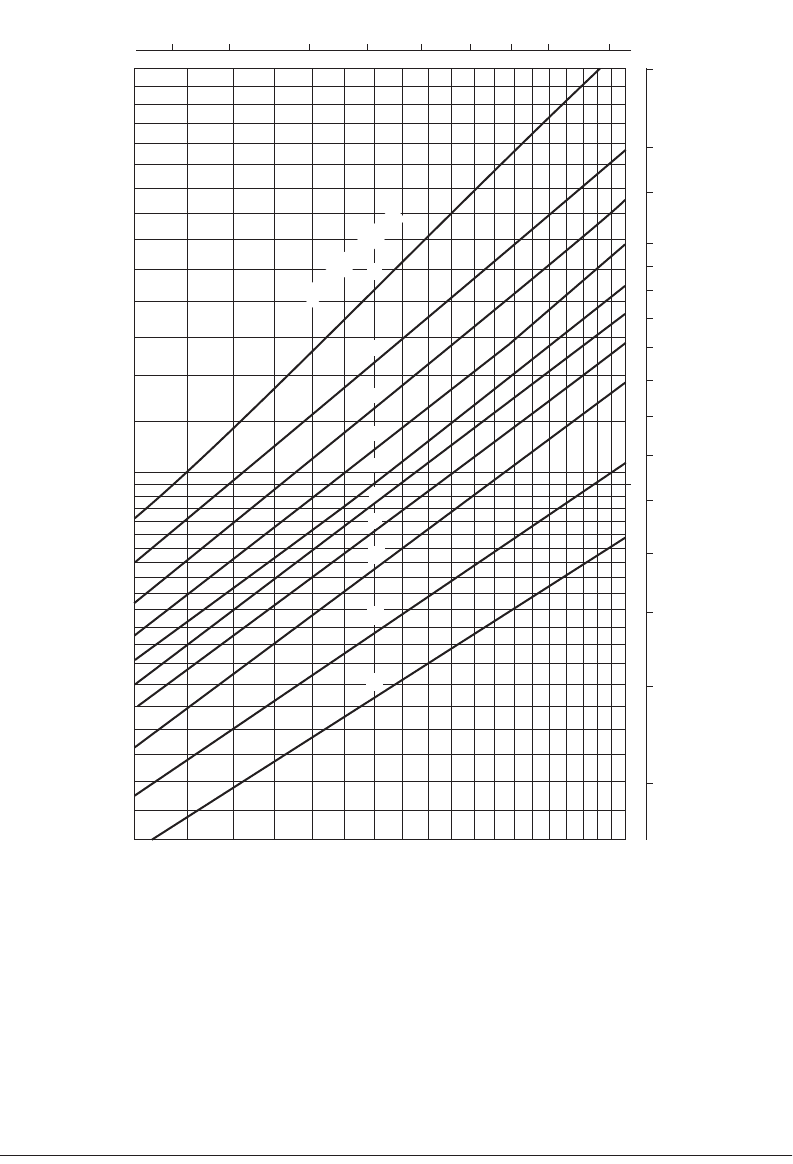
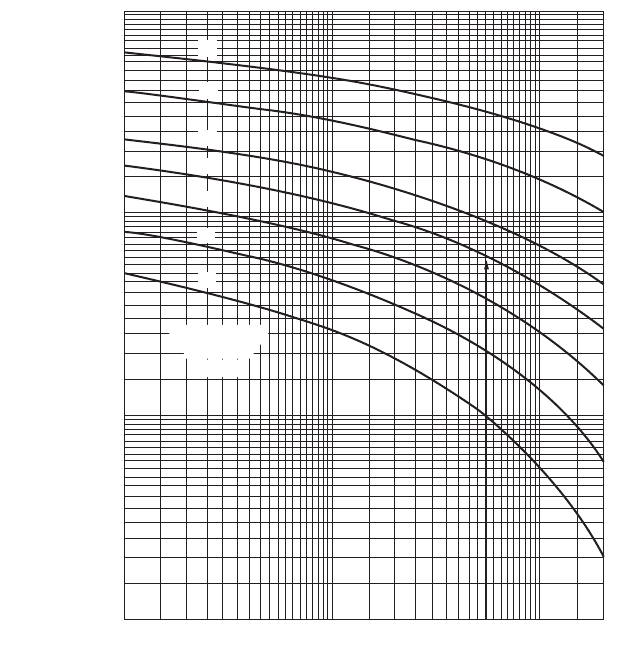
FIGURE 62.23 Minimum base course thickness requirements. (Source: Federal Aviation Administration. 1978.
Airport Pavement Design and Evaluation. Advisory Circular AC No. 150/5320-6C, p. 53. With permission.)
TOTAL PAVEMENT THICKNESS, IN.
(cm)
100
90
80
70
60
50
45
40
35
30
25
20
15
10
678910 15
MINIMUM BASE COURSE THICKNESS, IN.
20 25
70
60
50
40
30
(cm)
55
250
200
175
150
140
130
120
110
100
90
80
5045403530252017
SUBGRADE CBR
4
5
8
7
6
9
20
15
12
10

62-42 The Civil Engineering Handbook, Second Edition
that relies on empirical relationships derived from performance of full-scale test pavements and in-service
pavements. The design procedure of AASHTO [1993] is an example. The second form develops relation-
ships in terms of the properties of pavement materials as well as load-induced and thermal stresses and
calibrates these relationships with pavement performance data. The PCA [1984] and the FAA [1978]
methods of design adopt this approach. Thickness design procedures by AASHTO, PCA, and FAA are
discussed in this section. Reinforcement designs by the AASHTO and FAA procedures will be presented.
AASHTO Thickness Design for Rigid Highway Pavements
The serviceability-based concept of the AASHTO design procedure for rigid pavements [AASHTO, 1993]
is similar to its design procedure for flexible pavements. Pavement thickness requirements are established
from data of the AASHO road test [Highway Research Board, 1962]. Input requirements such as reliability
information and serviceability loss for design have been described in the section on AASHTO flexible
pavement design. Details for other input requirements are described in this section.
Pavement Material Properties
The elastic modulus E
c
and modulus of rupture S
c
of concrete are required input parameters. E
c
is
determined by the procedure specified in ASTM C469. It could also be estimated using the following
correlation recommended by ACI [1977]:
(62.26)
where f
c
= the concrete compressive strength in psi as determined by AASHTO T22, T140 [AASHTO,
1989] or ASTM C39 [ASTM, 1992].
TA BLE 62.13 FAA-Recommended Equivalency
Factors for Stabilized Base and Subbase
Material
Equivalency
Factor
(a) Equivalency Factors for Stabilized Base Course
Bituminous surface course 1.2–1.6
Bituminous base course 1.2–1.6
Cold-laid bituminous base course 1.0–1.2
Mixed-in-place base course 1.0–1.2
Cement-treated base course 1.2–1.6
Soil cement base course N/A
Crushed aggregate base course 1.0
Subbase course N/A
(b) Equivalency Factors for Stabilized Subbase Course
Bituminous surface course 1.7–2.3
Bituminous base course 1.7–2.3
Cold-laid bituminous base course 1.5–1.7
Mixed-in-place base course 1.5–1.7
Cement-treated base course 1.6–2.3
Soil cement base course 1.5–2.0
Crushed aggregate base course 1.4–2.0
Subbase course 1.0
Source: Federal Aviation Administration. 1978. Airport
Pavement Design and Evaluation. Reprinted from FAA
Advisory Circular. Report FAA/AC-150/5320-6C.
7 December 1978; NTIS Accession No. AD-A075 537/1.
E
c
psi() 57 000 f
c
()
0.5
,=
Highway and Airport Pavement Design 62-43
S
c
is the mean 28-day modulus of rupture determined using third-point loading as specified by
AASHTO T97 [AASHTO, 1989] or ASTM C39 [ASTM, 1992].
Modulus of Subgrade Reaction
The value of modulus of subgrade reaction k to be used in the design is affected by the depth of bedrock
and the characteristics of the subbase layer, if used. Figure 62.25 is first applied to account for the presence
of subbase course and obtain the composite modulus of subgrade reaction. Figure 62.26 is next used to
include adjustment for the depth of rigid foundation. It is noted from Fig. 62.25 that the subgrade soil
property required for input is the resilient modulus M
r
.
Example 62.15
This example entails computation of composite subgrade reaction. A concrete pavement is constructed
on a 6-in.-thick subbase with elastic modulus of 20,000 psi. The resilient modulus of the subgrade soil
is 7000 psi. The depth of subgrade to bedrock is 5 ft.
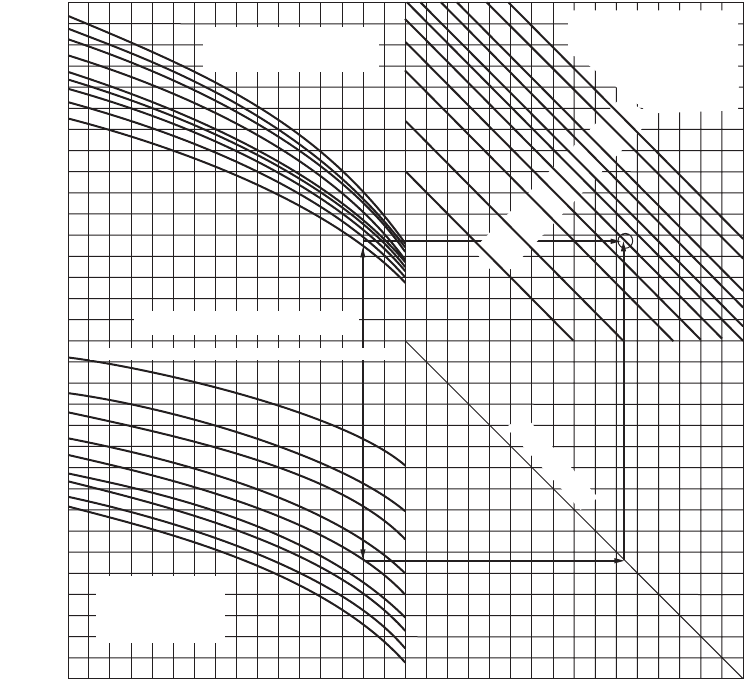
Entering Fig. 62.25, with D
SB
= 6 in., E
SB
= 20,000 psi, and M
r
= 7000 psi, obtain k
•
= 400 pci. With
bedrock depth of 5 ft., composite k = 500 pci, from Fig. 62.26.
Effective Modulus of Subgrade Reaction
Like the effective roadbed soil resilient modulus M
r
for flexible pavement design, an effective k is computed
to represent the combined effect of seasonal variations of k. The procedure is identical to the computation
of effective M
r
, except that the relative damage u is now computed as
(62.27)
Instead of solving the above equation, u can be obtained from Fig. 62.27.
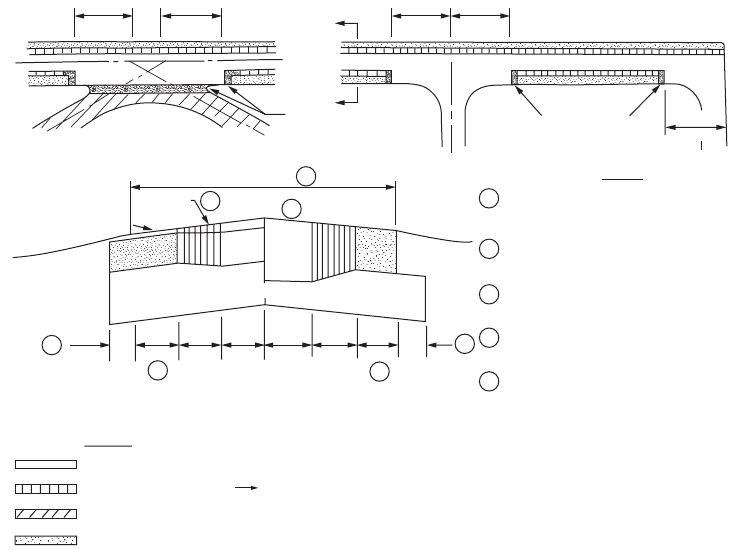
FIGURE 62.24 Typical plan and cross section for runway pavements. (Source: Federal Aviation Administration.
1978. Airport Pavement Design and Evaluation. Advisory Circular AC No. 150/5320-6C, p. 35. With permission.)
200’
(61m)
200’
(61m)
200’
(61m)
200’
(61m)
200’
(61m)
RUNWAY WIDTHS IN ACCORDANCE WITH
APPLICABLE ADVISORY CIRCULAR.
TRANSVERSE SLOPES IN ACCORDANCE
WITH APPLICABLE ADVISORY CIRCULAR.
SURFACE, BASE, PCC, ETC., THICKNESS
AS INDICATED ON DESIGN CHART.
MINIMUM 12" (30 cm) UP TO 30" (90cm)
ALLOWABLE.
FOR RUNWAYS WIDER THAN 150’ (45.7 m)
THIS DIMENSION WILL INCREASE.
NOTES
A
A
TRANSITIONS
RUNWAY WIDTH
6@ 25’ (7.6 m)
BASE
PCC
SUBBASE
THICKNESS = T
THICKNESS TAPERS = T O.7 T
THICKNESS = 0.9 T
THICKNESS = 0.7 T
LEGEND
SUBBASE
SURFACE
2"(1 cm) MINIMUM
SURFACE THICKNESS
1
1
2
3
4
4
5
5
5
2
3
4
TRANSITIONS
P1 P1
uD
0.75
0.39k
0.25
–()
3.42
=
62-44 The Civil Engineering Handbook, Second Edition
Depending on the type of subbase and subgrade materials, the effective k must be reduced according
to Fig. 62.28 to account for likely loss of support by foundation erosion and/or differential soil move-
ments. Suggested values of LS in Fig. 62.28 are given in Table 62.14.
Example 62.16
The value of composite k values determined at 1-month intervals are 400, 400, 450, 450, 500, 500, 450,
450, 450, 450, 450, and 450. Projected slab thickness is 10 in. and LS = 1.0. Determine effective k.
By means of Eq. (62.27) or Fig. 62.27, the relative damage for each k can be determined. Hence, total
u = 100 + 100 + 97 + 97 + 93 + 93 + 94 + 94 + 94 + 94 + 94 + 94 = 1144. Average u = 95.3 and average
k = 470 pci. Entering Fig. 62.28 with LS = 1.0 and D = 10 in., read effective k = 150 pci.
Load Transfer Coefficient
Load transfer coefficient J is a numerical index developed from experience and stress analysis. Table 62.15
presents the J values for the AASHO road test conditions. Lower J values are associated with pavements
with load transfer devices (such as dowel bars) and those with tied shoulders. For cases where a range
of J values applies, higher values should be used with low k values, high thermal coefficients, and large
variations of temperature. When dowel bars are used, the AASHTO guide recommends that the dowel
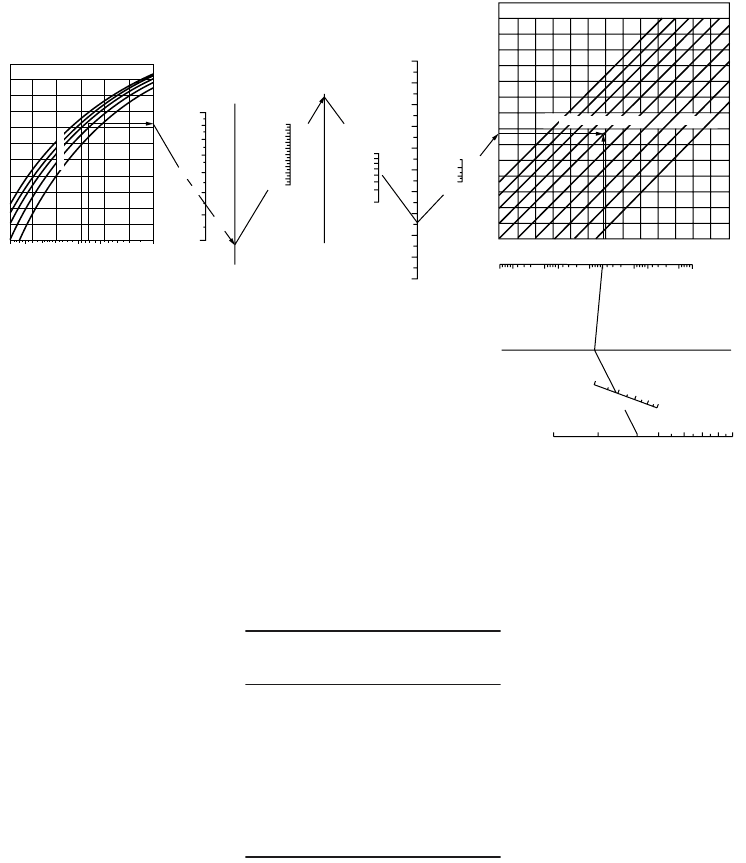
FIGURE 62.25 Chart for estimating composite k
•
. (Source: AASHTO. 1993. AASHTO Guides for Design of Pavement
Structures. Copyright 1993 by the American Association of State Highway and Transportation Officials, Washington,
D.C. Used by permission.)
Subbase Elastic
Modulus, E
SB
(psi)
k
•
(pci)
(Assumes Semi—
infinite Subgrade
Depth)
2000
1500
1000
800
600
500
400
300
200
100
50
Subbase Thickness, D
SB
(inches)
Roadbed
Soil Resilient
Modulus, M
R
(psi)
18 16 14 12 10 8 6
15,000
30,000
50,000
75,000
100,000
200,000
400,000
600,000
1,000,000
1000
10,000
20,000
12,000
16,000
2000
3000
5000
7000
(Turning Line)
Composite Modulus of
Subgrade Reaction,
Highway and Airport Pavement Design 62-45
diameter should be equal to the slab thickness multiplied by 1/8, with normal dowel spacing and length
of 12 in. and 18 in., respectively.
Drainage Coefficient
To allow for changes in thickness requirement due to differences in drainage properties, pavement layers,
and subgrade, a drainage coefficient C
d
was included in the design. Setting C
d
= 1 for conditions at the
AASHO road test, Table 62.16 shows the C
d
values for other conditions. The percentage of time during
the year that the pavement structure would be exposed to moisture levels approaching saturation can be
estimated from the annual rainfall and the prevailing drainage condition.
Thickness Requirement
The required slab thickness is obtained using the nomograph in Fig. 62.29. If the environmental effects
of roadbed swelling and frost heave are important, they are considered in the same way as for flexible
pavements.
Example 62.17
Apply the AASHTO procedure to design a concrete pavement slab thickness for ESAL = 11 ¥ 10
6
. The
design reliability is 95%, with a standard deviation of 0.3. The initial and terminal serviceability levels
are 4.5 and 2.5, respectively. Other design parameters are E
c
= 5 ¥ 10
6
, S
¢
c
= 650 psi, J = 3.2, and C
d
= 1.0.
Design PSI loss = 4.5 – 2.5 = 2.0. From Fig. 62.29, D = 10 in.
FIGURE 62.26 Chart for k as a function of bedrock depth. (Source: AASHTO. 1993. AASHTO Guides for Design of
Pavement Structures. Copyright 1993 by the American Association of State Highway and Transportation Officials,
Washington, D.C. Used by permission.)
Subgrade Depth to Rigid
Foundation, D
SG
(ft.)
Roadbed Soil Resilient Modulus, M
R
(psi)
2
5
10
50 100 200 300 400
500
600
700
800
1000
1200
1400
Modulus of Subgrade Reaction, k
•
(pci)
Assuming Semi-infinite Subgrade Depth
Modulus of Subgrade Reaction, k (pci)
(Modified to account for presence of
rigid foundation near surface)
20,000 15,000 10,000 5,000 500 1000 1500 20000
62-46 The Civil Engineering Handbook, Second Edition
AASHTO Reinforcement Design for Rigid Highway Pavements
Reinforcements are introduced into concrete pavements for the purpose of crack-width control. They
are designed to hold cracks tightly closed so that the pavement remains an integral structural unit. The
amount of reinforcement required is a function of slab length (or joint spacing) and thermal properties
of the pavement material.
Reinforcements are not required in jointed plain concrete pavements (JPCP) whose lengths are rela-
tively short. As a rough guide proposed by AASHTO, the joint spacing (in feet) for JPCP should not
greatly exceed twice the slab thickness (in inches), and the ratio of slab width to length should not exceed
1.25.
Reinforcement Design for JRCP
The percentage of steel reinforcement (either longitudinal or transverse reinforcement) required for
jointed reinforced concrete pavement (JRCP) is given by
(62.28)
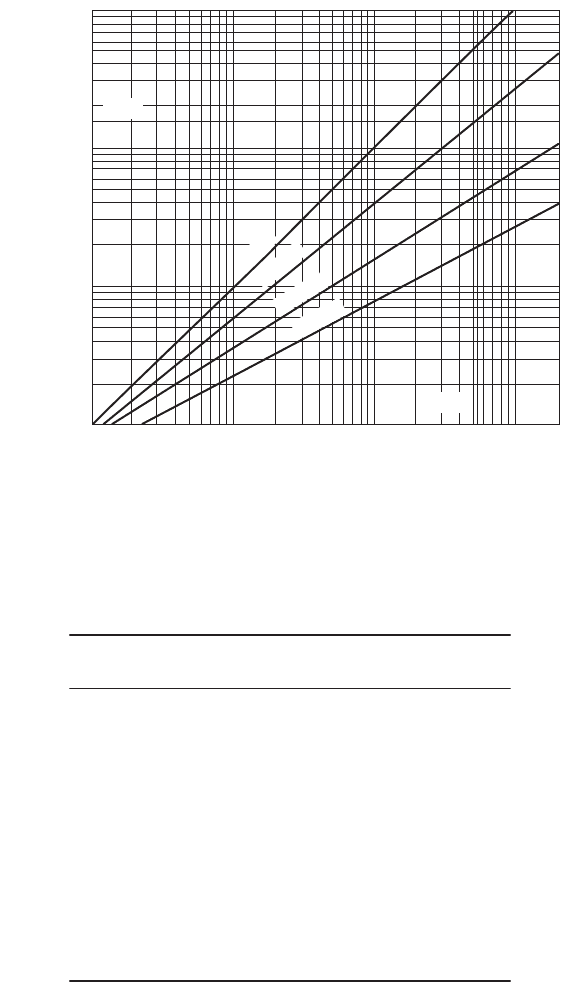
FIGURE 62.27 Chart for estimating relative damage to rigid pavements. (Source: AASHTO. 1993. AASHTO Guides
for Design of Pavement Structures. Copyright 1993 by the American Association of State Highway and Transportation
Officials, Washington, D.C. Used by permission.)
Projected Slab
Thickness
(inches)
Relative Damage, u
1000
500
100
50
10
5
1
10 50 100 500
Composite k-value (pci)
1000 2000
14
12
10
9
8
7
6
Projected Slab
Thickness
(inches)
P
s
LF◊
2f
s
----------
100%¥=
Highway and Airport Pavement Design 62-47
where L = slab length in feet, F = friction factor between the bottom of the slab and the top of the
underlying subbase or subgrade, and f
s
= allowable working stress of steel reinforcement in psi. AASHTO’s
recommended values for F are given in Table 62.17. The allowable steel working stress is equal to 75%
of the steel yield strength. For grade 40 and grade 60 steel, f
s
is equal to 30,000 and 45,000 psi, respectively.
For welded wire fabric, f
s
is 48,750 psi. Equation (62.28) is also applicable to the design of transverse
steel reinforcement for continuously reinforced concrete pavement (CRCP).
FIGURE 62.28 Correction of effective modulus of subgrade reaction for potential loss of subbase support. (Source:
AASHTO. 1993. AASHTO Guides for Design of Pavement Structures. Copyright 1993 by the American Association of
State Highway and Transportation Officials, Washington, D.C. Used by permission.)
TABLE 62.14 Typical Ranges of Loss of Support
(LS) Factors for Various Types of Materials
Type of Material
Loss of Support
(LS)
Cement treatment granular base
(E = 1,000,000 to 2,000,000 psi)
0.0–1.0
Cement aggregate mixtures
(E = 500,000 to 1,000,000 psi)
0.0–1.0
Asphalt treated base
(E = 350,000 to 1,000,000 psi)
0.0–1.0
Bituminous stabilized mixtures
(E = 40,000 to 300,000 psi)
0.0–1.0
Lime stabilized
(E = 20,000 to 70,000 psi)
1.0–3.0
Unbound granular materials
(E = 15,000 to 45,000 psi)
1.0–3.0
Fine-grained or natural subgrade materials
(E = 3000 to 40,000 psi)
2.0–3.0
Source: AASHTO. 1993. AASHTO Guides for Design of Pavement
Structures. Copyright 1993 by the American Association of State High-
way and Transportation Officials, Washington, D.C. Used by permission.
Effective Modulus of Subgrade Reaction, K (pci)
(Corrected for Potential Loss of Support)
1000
500
100
50
10
5
1
510 50100
Effective Modulus of Subgrade Reaction, K (pci)
500 1000 2000
LS=3.0
LS=2.0
LS=1.0
LS=0
(170)
(540)

62-48 The Civil Engineering Handbook, Second Edition
Example 62.18
Determine the longitudinal steel reinforcement requirement for a 30-ft-long JRCP constructed on crushed
stone subbase.
From Table 62.17, F = 1.5. Percentage of steel reinforcement P
s
= (30 ¥ 1.5)/(2 ¥ 30,000) = 0.075%.
Longitudinal Reinforcement Design for CRCP
The design of longitudinal reinforcement for CRCP is an elaborate process. The amount of reinforcement
selected must satisfy limiting criteria in the following three aspects: (a) crack spacing, (b) crack width,
and (c) steel stress.
CRCP Reinforcements Based on Crack Spacing: (P
min
)
1
and (P
max
)
1
. The amount of steel reinforce-
ment provided should be such that the crack spacing is between 3.5 ft (1.1 m) and 8 ft (2.4 m). The
lower limit is to minimize punchout and the upper limit to minimize spalling. For each of these two
crack spacings, Fig. 62.30 is used to determine the percent reinforcement P required, resulting in two
values of P that define the range of acceptable percent reinforcement: (P
max
)
1
and (P
min
)
1
.
The input variables for determining P are the thermal coefficient of portland cement concrete a
c
, the
thermal coefficient of steel a
s
, diameter of reinforcing bar, concrete shrinkage Z at 28 days, tensile stress
s
w
due to wheel load, and concrete tensile strength f
t
at 28 days. Values of a
c
and Z are given in Table 62.18.
A value of a
s
= 5.0 ¥ 10
–6
in./in./˚F may be used. Steel bars of 5/8- and 3/4-in. diameter are typically
used, and the 3/4-in. bar is the largest practical size for crack-width control and bond requirements. The
nominal diameter of a reinforcing bar, in inches, is simply the bar number divided by 8. Meanwhile,
s
w
is the tensile stress developed during initial loading of the constructed pavement by either construction
TABLE 62.15 Recommended Load Transfer Coefficient
for Various Pavement Types and Design Conditions
Shoulder Asphalt Tied P.C.C.
Load Transfer Device Yes No Yes No
Pavement Type
Plain Jointed and
Jointed reinforced
3.2 3.8–4.4 2.5–3.1 3.6–4.2
CRCP 2.9–3.2 N/A 2.3–2.9 N/A
Source: AASHTO. 1993. AASHTO Guides for Design of Pave-
ment Structures. Copyright 1993 by the American Association of
State Highway and Transportation Officials, Washington, D.C.
Used by permission.
TA BLE 62.16 Recommended Value of Drainage Coefficient, C
d
,
for Rigid Pavement Design
Quality of
Drainage
Percent of Time Pavement Structure Is Exposed
to Moisture Levels Approaching Saturation
Less than
1% 1–5% 5–25%
Greater than
25%
Excellent 1.25–1.20 1.20–1.15 1.15–1.10 1.10
Good 1.20–1.15 1.15–1.10 1.10–1.00 1.00
Fair 1.15–1.10 1.10–1.00 1.00–0.90 0.90
Poor 1.10–1.00 1.00–0.90 0.90–0.80 0.80
Ve ry Poor 1.00–0.90 0.90–0.80 0.80–0.70 0.70
Source: AASHTO. 1993. AASHTO Guides for Design of Pavement
Structures. Copyright 1993 by the American Association of State High-
way and Transportation Officials, Washington, D.C. Used by permission.
Highway and Airport Pavement Design 62-49
equipment or truck traffic. It is determined using Fig. 62.31 based on the design slab thickness, the
magnitude of the wheel load, and the effective modulus of subgrade reaction. Likewise, f
t
is the concrete
indirect tensile strength determined by AASHTO T198 or ASTM C496. It can be assumed as 86% of the
modulus of rupture S
c
used for thickness design.
CRCP Reinforcements Based on Crack Width: (P
min
)
2
. Crack width in CRCP is controlled to within
0.04 in. (1.0 mm) to prevent spalling and water infiltration. The minimum percent steel (P
min
)
2
that
would produce crack widths of 0.04 in. can be determined from Fig. 62.32 with a selected bar size and
input variables s
w
and f
t
.
FIGURE 62.29 Rigid pavement thickness design chart. (Source: AASHTO. 1993. AASHTO Guides for Design of
Pavement Structures. Copyright 1993 by the American Association of State Highway and Transportation Officials,
Washington, D.C. Used by permission.)
TA BLE 62.17 Recommended
Friction Factors
Type of Material
beneath Slab
Friction
Factor
Surface treatment 2.2
Lime stabilization 1.8
Asphalt stabilization 1.8
Cement stabilization 1.8
River gravel 1.5
Crushed stone 1.5
Sandstone 1.2
Natural subgrade 0.9
Source: AASHTO. 1993. AASHTO
Guides for Design of Pavement Structures.
Copyright 1993 by the American Asso-
ciation of State Highway and Transpor-
tation Officials, Washington, D.C. Used
by permission.
99.9 99 95 90 80 70 60 50
Concrete Elastic Modulus, E
c
(10
6
pci)
1200
1100
1000
900
800
700
600
500
800 500 100 50 10
Effective Modulus of Subgrade
Reaction, k (pci)
4.0
4.5
1.3
1.1
0.9
0.7
0.6
3.5
3.0
2.5
2.2
Load Transfer
Coefficient, J
Drainage Coefficient, C
d
0
10
20
30
40
50
60
70
80
90
100
Match Line
Design Serviceability Loss, ∆PSI
1000 500 100 50 10 5 10 5 1 05
Estimated Total 18−kip Equivalent Single Axle
Load (ESAL) Applications, W
8
(millions)
Mean Concrete Modulus of Rupture, S′
c
(psi)
NOTE : Application of reliablility
in this chart requires
the use of mean values
for all the input variables.
T
L
T
L
.5
1.0
2.0
3.0
Design slab thickness, D (inches)
Reliability, R (%)
2
3
4
5
6
Overall Standard Deviation, S
0
7
6
5
4
3
14
T
L
13 12 11 10 9 8 7 6 5
5