Ware C. Information Visualization: Perception for Design
Подождите немного. Документ загружается.

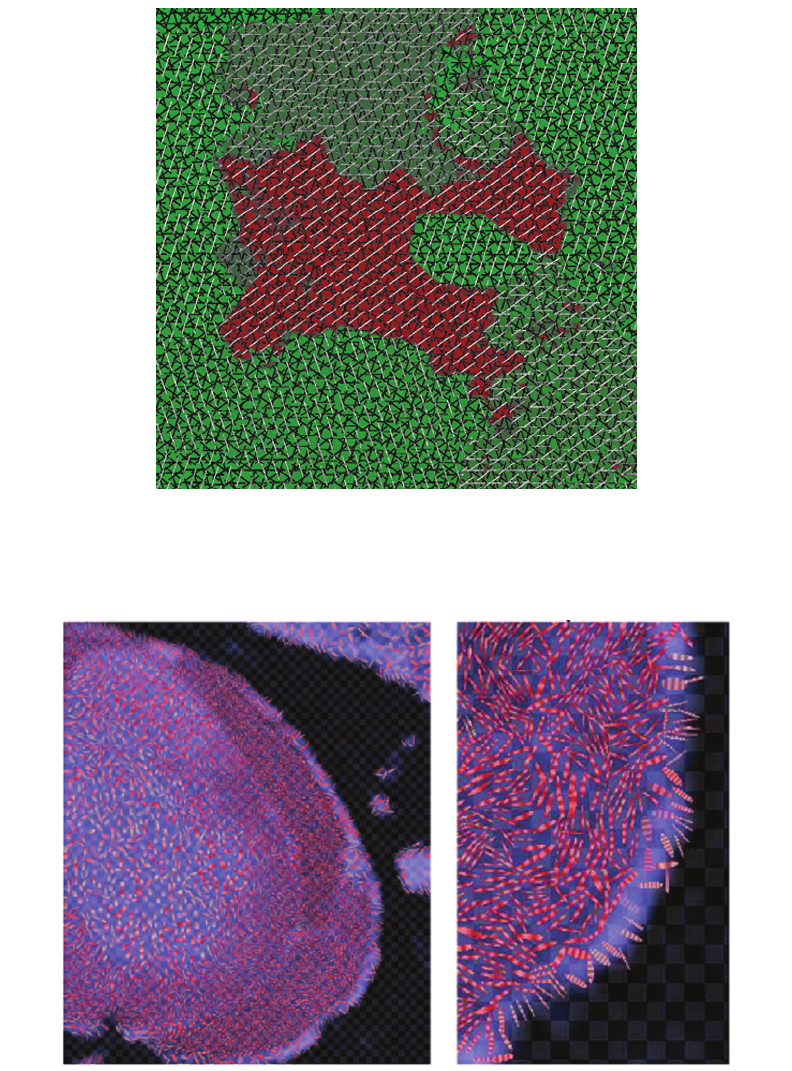
Figure 5.24 Another example of a sliver plot. Three variables are mapped to three differently oriented slivers. A fourth
variable is mapped to the background color. Courtesy of Chris Weigle.
Figure 5.25 A cross section of a mouse spinal column. Seven variables are shown at each location. Part of the image
is enlarged on the right. See text for description. Courtesy of David Laidlaw.
ARE5 1/20/04 5:01 PM Page 174
Rather than attempting to create a simple general technique (like slivers), both figures were hand-
crafted in a collaboration between the scientist and the designer. Figure 5.25 shows a cross section
of a mouse spinal column. The data has seven values at each location in the image. The image
is built up in layers: image intensity, sampling rate determines the grid, elliptical shapes show the
in-plane component of principal diffusion and anisotropy, texture on the ellipses shows absolute
diffusion rate.
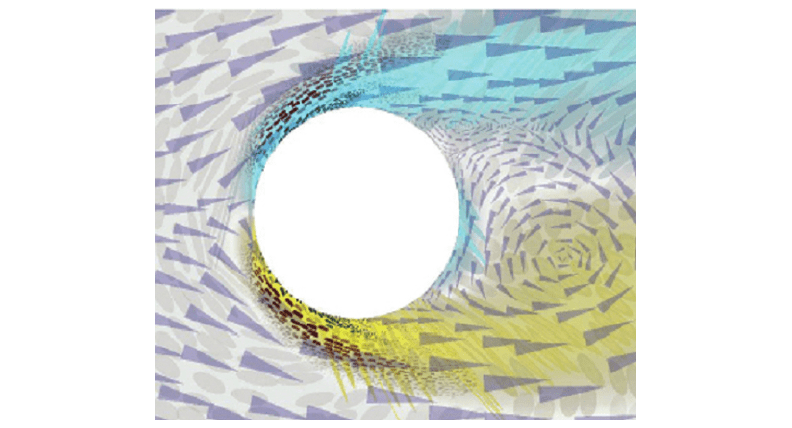
The image in Figure 5.26 is a flow visualization. It displays six variables relating to the flow
pattern of a fluid around a cylinder. These values are 2D velocity (two values are mapped to
arrow direction and area), vorticity (one value is mapped to color and texture on ellipses), and
deformation rate tensor (three values are mapped to shape and orientation of ellipses).
Without specific knowledge of mouse physiology or fluid dynamics, it is impossible to judge
the success of these examples. Nevertheless, they provide a vivid commentary on the tradeoffs
involved in trying to display high-dimensional multivariate maps. The first point to be made is
that none of the preceding three examples (Figures 5.24, 5.25, and 5.26) shows much detail, and
there is a good reason for this. We only have one luminance channel, and luminance variation
is the only way of displaying detailed information. If we choose to use texture (or any kind of
glyph field), we inevitably sacrifice the ability to show detail, because to be clear each glyph
element must be displayed using luminance contrast. Larger glyphs mean that less detail can
be shown.
Visual Attention and Information that Pops Out 175
Figure 5.26 A flow visualization showing six variables relating to fluid flow around a cylinder. Courtesy of David
Laidlaw.
ARE5 1/20/04 5:01 PM Page 175
There are also tradeoffs when displaying orientation. It may be only possible to display a
single orientation clearly at each point in space for the purpose of showing flow patterns. Figure
5.26 suggests that if we need to show differently oriented glyphs in the same region, the glyphs
must be widely spaced. This reduces the data density further. Also, Figure 5.26 suggests that the
colors of different glyph layers must be very carefully chosen to be dissimilar. This, in turn, severely
restricts how color-coding can be used on individual glyphs. In Figure 5.25, each of the elliptical
glyphs is textured to display an additional variable. However, the texture striations are at right
angles to the ellipse major axes. This camouflages the glyphs, making their orientation more dif-
ficult to see. The use of texture will inevitably tend to camouflage glyph shape; if the textures are
oriented, the problem will be worse. In general, the more similar the spatial frequencies of the dif-
ferent pattern components, the more likely they are to disrupt one another visually.
The complexity of the design tradeoffs suggests that the problem of creating complex visu-
alizations will be more of a craft than a science for quite some time. The problem is too difficult
for automatic assignments of data maps to graphical attributes to be successful. Still, the designer
needs to be aware of the perceptual tradeoffs in order to make informed decisions about the best
choice of glyph size, shape, and color distribution.
It is also worth pointing out that there are some perceptual dimensions that may be used in
addition to color, shape, and texture. In some cases, it is helpful to use stereoscopic depth and
motion in displaying multidimensional data. Stereoscopic depth, especially if used with a high-
resolution display, can undoubtedly help us perceptually segment data layers. So can motion.
Making all of the points in a data layer move coherently, even by a small amount, may make it
possible to visually attend to either the static layer or the moving layer (as shown by the possi-
bility of preattentive conjunction search with motion).
Glyphs and Multivariate Discrete Data
In the previous section, we saw how texture could be used to represent continuous map data. In
Chapter 4, it was shown that color could be used in a similar way. However, sometimes multi-
variate discrete data is the subject of interest. For example, a marketing specialist may have data
for every person in a particular geographical area, including estimates of income, educational
level, employment category, and location of residence. The marketer would like to see each person
on a map in such a way that the concentrations of individuals with particular sets of attributes
can easily be seen. In this way, neighborhoods to be blanketed with flyers might be selected most
effectively.
To create a glyph, multiple data attributes are mapped in a systematic way to show the dif-
ferent aspects of the appearance of the graphical object. In the aforementioned marketing
example, income might be mapped to the glyph’s size, education level to its color, employment
category to its shape, and geographic location to the x,y location where the glyph is plotted. All
the previously discussed results relating to preattentive detection of size, orientation, and color-
coding of data apply to the design of glyphs.
176 INFORMATION VISUALIZATION: PERCEPTION FOR DESIGN
ARE5 1/20/04 5:01 PM Page 176
Another body of theory that is relevant to glyph design is the theory of integral and sepa-
rable dimensions, developed by Garner (1974). The kind of multidimensional coding that occurs
in the use of glyphs raises questions about the perceptual independence of the display dimen-
sions. Will the color-coding scheme interfere with our perception of glyph size and therefore
distort perceived income level? What if we use both color and size to represent a single variable?
Will this make the information clearer? The concept of integral vs. separable visual dimensions
tells us when one display attribute (e.g., color) will be perceived independently from another (e.g.,
size). With integral display dimensions, two or more attributes of a visual object are perceived
holistically and not independently. An example is a rectangular shape, perceived as a holistic
combination of the rectangle’s width and height. Another is the combination of green light and
red light; this is seen holistically as yellow light, and it is difficult to respond independently to
the red and green components. With separable dimensions, people tend to make separate judg-
ments about each graphical dimension. This is sometimes called analytic processing. Thus, if the
display dimensions are the diameter of a ball and the color of a ball, they will be processed rel-
atively independently. It is easy to respond independently to ball size and ball color.
Integral and separable dimensions have been determined experimentally in a number of ways.
Three experimental paradigms are discussed here. All are related to interactions between pairs
of variables. Very little work has been done on interactions among three or more display
variables.
Restricted Classification Tasks
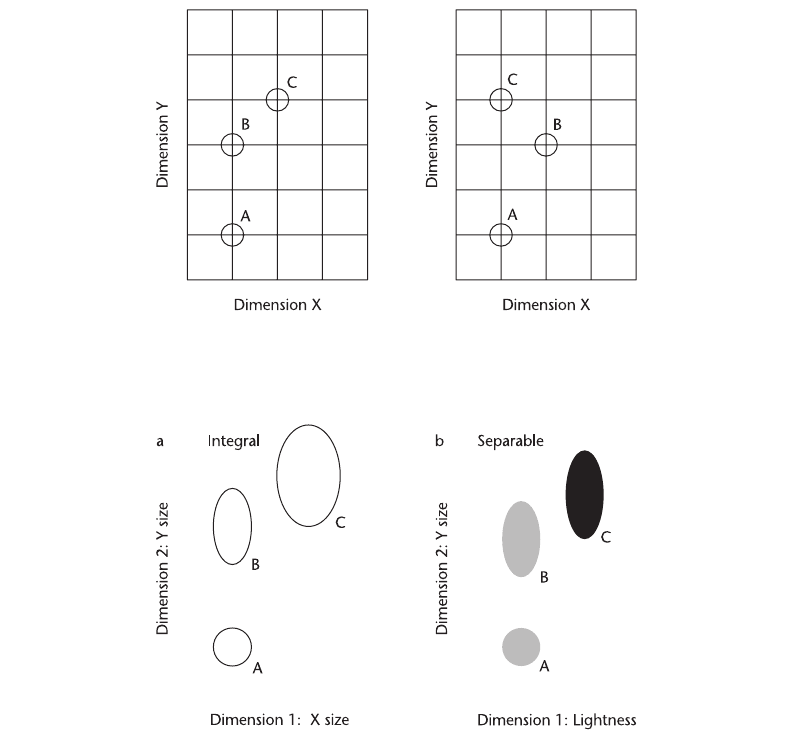
In restricted classification tasks, observers are shown sets of three glyphs that are constructed
according to the diagram shown in Figure 5.27. Two of the glyphs (A and B) are made the same
on one variable. A third glyph (C) is constructed so that it is closer to glyph B in feature space,
but this glyph differs from the other two in both of the graphical dimensions. Subjects are asked
to group the two glyphs that they think go together best. If the dimensions are integral, A and
C are grouped together because they are closest in the feature space. If they are separable, A and
B are grouped together because they are identical in one of the dimensions (analytic mode). The
clearest example of integral dimensions is color space dimensions. If dimension X is the red—
green dimension and dimension Y is the yellow—blue dimension of color space, subjects tend to
classify objects (roughly) according to the Euclidean distance between the colors (defined accord-
ing to one of the uniform color spaces discussed in Chapter 4). Note that even this is not always
the case, as the evidence of color categories (also discussed in Chapter 4) shows.
The width and height of an ellipse creates an integral perception of shape. Thus, in Figure
5.28(a), the ellipses B and C appear to be more similar to each other than to the circle A, even
though the width of B matches the width of A. If the two dimensions are separable, subjects act
in a more analytic manner and react to the fact that two of the objects are actually identical on
one of the dimensions. Shape and gray value are separable. Thus, in Figure 5.28(b), either the
two gray shapes or the two elliptical shapes will be categorized together. With separable dimen-
sions, it is easy to attend to one dimension or the other.
Visual Attention and Information that Pops Out 177
ARE5 1/20/04 5:01 PM Page 177
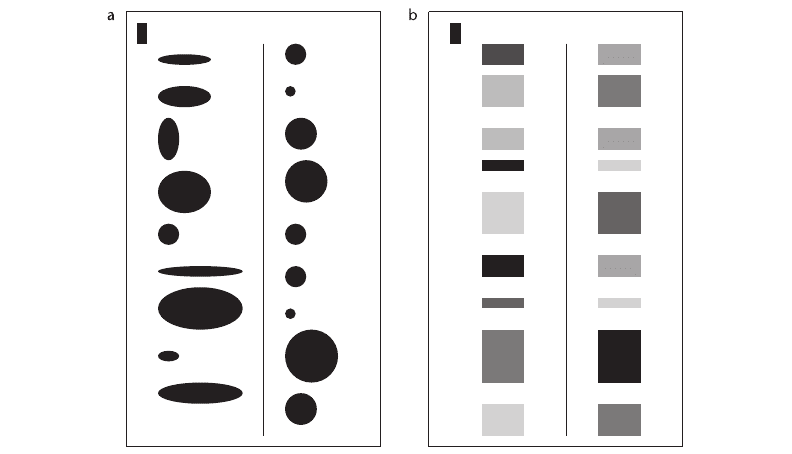
Speeded Classification Tasks
Speeded classification tasks tell us how glyphs can visually interfere with each other. In a speeded
classification task, subjects are asked to classify visual patterns rapidly according to only one of
the visual attributes of a glyph. The other visual attribute can be set up in two different ways: it
can be given random values (interference condition), or it can be coded in the same way as the
178 INFORMATION VISUALIZATION: PERCEPTION FOR DESIGN
Figure 5.27 When we are considering integral and separable visual dimensions, it is useful to consider a space
defined by two display dimensions. One might be size; the other might be color. Or one might be hue and
the other might be saturation, both defined in color space.
Figure 5.28 (a) The width and height of an ellipse are perceived integrally; therefore, B and C are perceived as more
similar. (b) The gray value and the height of an ellipse are perceived as separable; therefore, A and B,
which have identical lightness, are perceived as more similar.
ARE5 1/20/04 5:01 PM Page 178
Visual Attention and Information that Pops Out 179
Figure 5.29 Patterns for a speeded classification task. Subjects are required to respond positively only to those
glyphs that have the same height as the black bar in the upper-left corner. (a) Integral dimensions. In the
first column, a second integral dimension is randomly coded by horizontal size (interference condition). In
the second column, width information is redundantly coded with height information. (b) Separable
dimension. In the first column, gray information is not correlated with height. In the second column, gray
level is a redundant code.
first dimension (redundant coding). If the data dimensions are integral, substantial interference
occurs in the first case. With redundant coding, classification is generally speeded for integral
dimensions. With separable codes, the results are different. There is little interference from the
irrelevant graphical dimension, but there is also little advantage in terms of speeded classifica-
tion when redundant coding is used. Of course, in some cases, using redundant separable codes
may still be desirable. For example, if both color and shape are used for information coding,
color-blind individuals will still have access to the information. Figure 5.29 gives examples of
the kinds of patterns that are used in experiments.
The lessons to be learned from integral—separable dimension experiments are straightfor-
wardly applied to cases in which each data entity has two attributes. If we want people to respond
holistically to a combination of two variables, using integral dimensions will be better. If we want
people to respond analytically, making judgments on the basis of one variable or the other, using
separable dimensions will be better.
ARE5 1/20/04 5:01 PM Page 179
Integral–Separable Dimension Pairs
The preceding analysis has presented integral and separable dimensions as if they were qualita-
tively distinct. This overstates the case; a continuum of integrality–separability more accurately
represents the facts. There is always some interference between different data values presented
using different graphical attributes of a single visual object, even between the most separable
dimensions. Likewise, the most integral dimensions can be regarded analytically to some extent.
We can, for example, perceive the degree of redness and the degree of yellowness of a color, for
instance, orange or pink. Indeed, the original experimental evidence for opponent color channels
was based on analytic judgments of exactly this type (Hurvich, 1981).
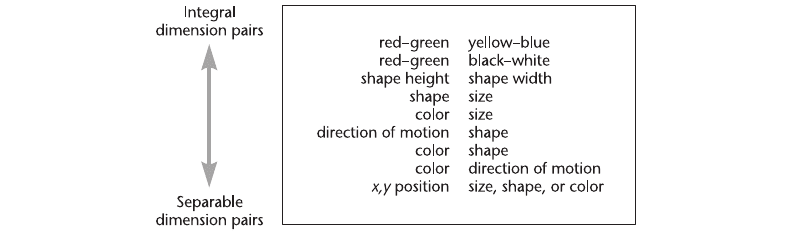
Figure 5.30 provides a list of display dimension pairs arranged on an integral—separable
continuum. At the top are the most integral dimensions. At the bottom are the most separable
dimensions. Other possible display dimensions are not represented, because of too little evidence
for blue and stereoscopic depth. However, it seems likely that stereoscopic depth is quite sepa-
rable from other dimensions if only two depth layers are involved. The most separable way of
coding information, as indicated at the bottom of the list, is to use spatial position to code one
of the data dimensions and to use size, shape, or color to code the other. This is exactly what is
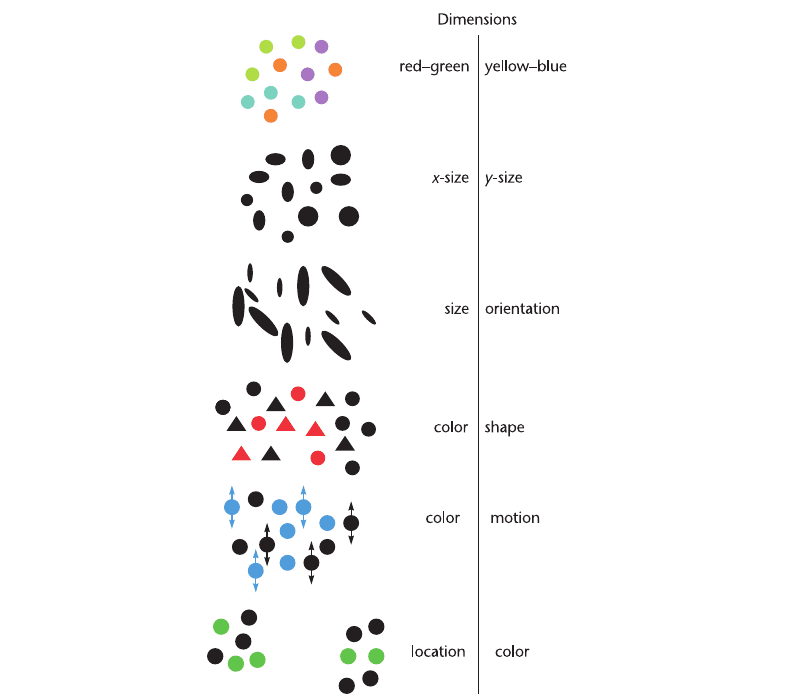
done in a bar chart in which each bar represents a single value. Figure 5.31 illustrates some of
the dimension pairs.
As a theoretical concept, the notion of integral and separable dimensions is undoubtedly sim-
plistic; it lacks mechanism and fails to account for a large number of exceptions and asymme-
tries that have been discovered experimentally. Eventually, it is to be expected that a more
complete body of theory will emerge to account for the ways in which different kinds of visual
information are combined. The beauty of the integral—separable distinction lies in its simplicity
as a design guideline.
180 INFORMATION VISUALIZATION: PERCEPTION FOR DESIGN
Figure 5.30 This table lists some of the display dimension pairs ranked in order from highly integral to highly
separable.
ARE5 1/20/04 5:01 PM Page 180
Monotonicity of Visual Attributes
Some visual qualities increase continuously, like size, brightness, or the up direction, and are said
to be monotonic. Some visual qualities are not monotonic. Orientation is one. It is meaningless
to say that one orientation is greater or less than another. The same is true of the phase angle
between two oscillating objects. As the phase difference is increased, the objects first appear to
move in opposite directions, but as the phase difference continues to increase, they appear to
Visual Attention and Information that Pops Out 181
Figure 5.31 Examples of glyphs coded according to two display attributes. At the top are more integral coding pairs.
At the bottom are more separable coding pairs.
ARE5 1/20/04 5:01 PM Page 181
move together again. Phase is cyclic, just as line orientation is cyclic. Hue also lacks a natural
order.
Monotonic display variables naturally express relations such as greater than or less than if
they have a direction that we associate with increasing value. For example, in a 3D data space,
the up direction is defined by gravity, and using up to represent a greater quantity of some vari-
able will be readily interpreted. The axis representing direction toward and away from the view-
point is similarly well defined, but the left and right directions do not have as clear a value. In
the west, we read left to right but this is learned. Other languages, such as Arabic, have right-
to-left ordering. For representing simple quantity, a mapping to any of the following attributes
will be effective: size, lightness (on a dark background), darkness (on a light background), vivid-
ness (higher saturation) of color, or vertical height above the ground plane. For each of these, an
inverse mapping will lead to confusion.
Multidimensional Discrete Data
This is a good place to step back and look at the general problem of multivariate discrete data
display in light of the concepts that have been presented here and in the previous chapter. It is
worth restating this problem. We are provided with a set of entities, each of which has values
on a number of attribute dimensions. For example, we might have 1000 beetles, each measured
on 30 anatomical characteristics, or 500 stocks, each described by 20 financial variables. The
reason for displaying such data graphically is often for data exploration. We hope to find meaning
in the diversity. In the case of the beetles, the meaning might be related to their ecological niche.
In the case of the stocks, the meaning is likely to lie in opportunities for profit.
If we decide to use a glyph display, each entity becomes a graphical object and data attrib-
utes are mapped to graphical attributes of each glyph. The problem is one of mapping data dimen-
sion to the graphical attributes of the glyph. The work on preattentive processing, early visual
processing, and integral and separable dimensions suggests that a rather limited set of visual
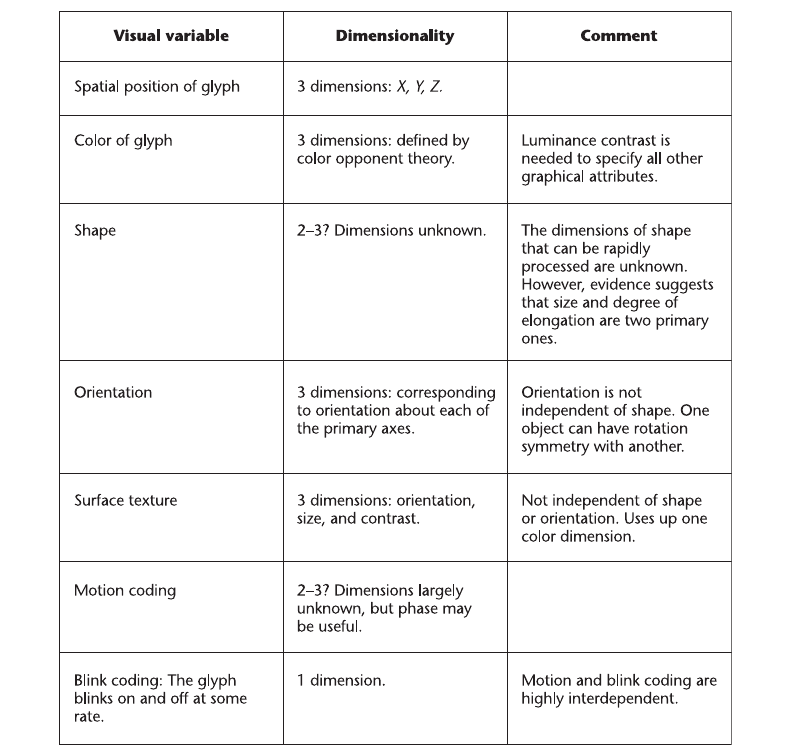
attributes is available to us if we want to understand the values rapidly. Figure 5.32 is a list of
the most useful low-level graphical attributes that can be applied to glyph design, with a few
summary comments about the number of dimensions available.
Many of these display dimensions are not independent of one another. To display texture,
we must use at least one color dimension to make the texture visible. Blink coding will certainly
interfere with motion coding. Overall, we will probably be fortunate to display eight dimensional
data clearly, using color, shape, spatial position, and motion to create the most differentiated set
possible.
There is also the issue of how many resolvable steps are available in each dimension. The
number here is also small. When we require rapid preattentive processing, no more than
eight colors are available. The number of orientation steps that we can easily distinguish is prob-
ably about four. The number of size steps that we can easily distinguish is no more than four,
and the values for the other data dimensions are also in the single-digit range. It is reasonable,
therefore, to propose that we can represent about 2 bits of information for each of the eight
182 INFORMATION VISUALIZATION: PERCEPTION FOR DESIGN
ARE5 1/20/04 5:01 PM Page 182
graphical dimensions. If the dimensions were truly independent, this would yield 16 displayable
bits per glyph (64,000 values). Unfortunately, conjunctions are generally not preattentive. If
we allow no conjunction searching, we are left with four alternatives on each of eight dimen-
sions, yielding only 32 rapidly distinguishable alternatives, a far smaller number. Anyone who
has tried to design a set of easily distinguishable glyphs will recognize this number to be more
plausible.
Visual Attention and Information that Pops Out 183
Figure 5.32 Graphical attributes that may be used in glyph design.
ARE5 1/20/04 5:01 PM Page 183