Ware C. Information Visualization: Perception for Design
Подождите немного. Документ загружается.

194 INFORMATION VISUALIZATION: PERCEPTION FOR DESIGN
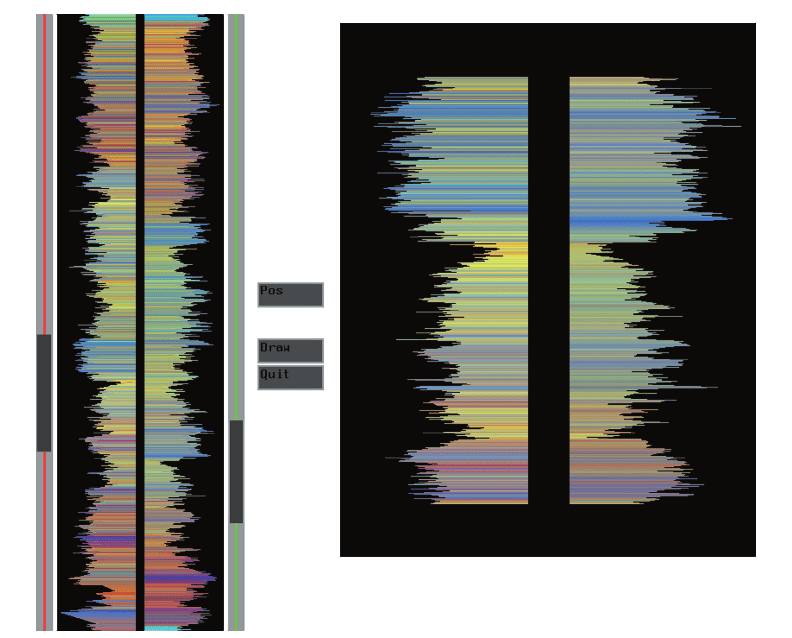
Figure 6.11 An application designed to allow users to recognize similar patterns in different time-series plots. The
data represents a sequence of measurements made on deep ocean drilling cores. Two subsets of the
extended sequences are shown on the right.
to perceive similarities if these time series are arranged using vertical symmetry, as shown in
Figure 6.11, rather than using the more conventional parallel plots.
Closure
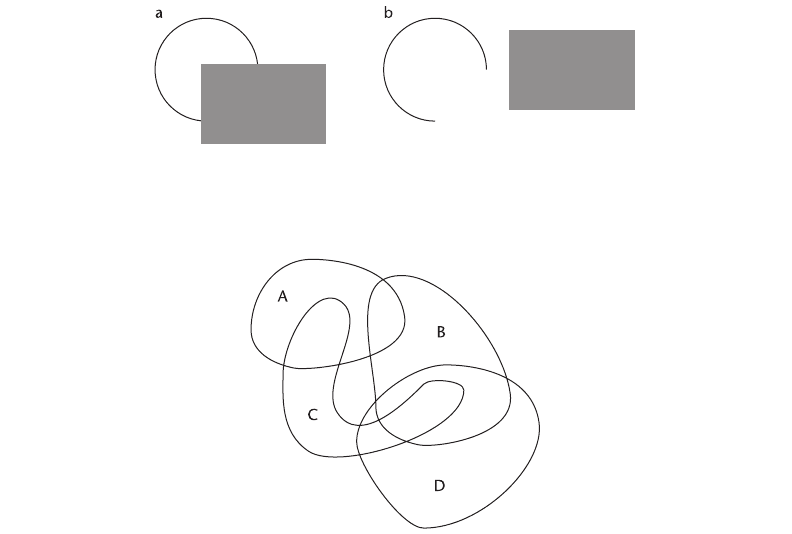
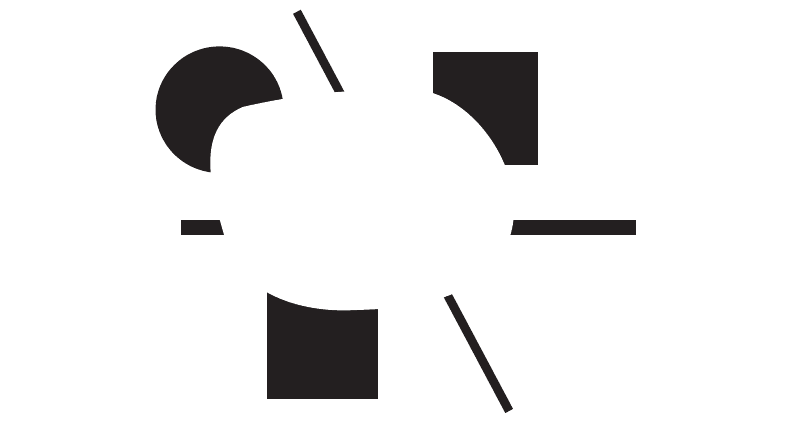
A closed contour tends to be seen as an object. The Gestalt psychologists argued that there is a
perceptual tendency to close contours that have gaps in them. This can help explain why we see
Figure 6.12(a) as a complete circle and a rectangle rather than as a circle with a gap in it as in
Figure 6.12(b).
ARE6 1/20/04 5:02 PM Page 194
Wherever a closed contour is seen, there is a very strong perceptual tendency to divide regions
of space into “inside” or “outside” the contour. A region enclosed by a contour becomes a
common region in the terminology of Palmer (1992). He showed common region to be a much
stronger organizing principle than simple proximity. This, presumably, is the reason why Venn-
Euler diagrams are such a powerful device for displaying the interrelationships among sets of
data. In an Euler diagram, we interpret the region inside a closed contour as defining a set of
elements. Multiple closed contours are used to delineate the overlapping relationships among
different sets. A Venn diagram is a more restricted form of Euler diagram containing all possi-
ble regions of overlap. The two most important perceptual factors in this kind of diagram are
closure and continuity.
A fairly complex structure of overlapping sets is illustrated in Figure 6.13, using an Euler
diagram. This kind of diagram is almost always used in teaching introductory set theory, and
this in itself is evidence for its effectiveness. Students easily understand the diagrams, and they
Static and Moving Patterns 195
Figure 6.12 The Gestalt principle of closure holds that neural mechanisms operate to find perceptual solutions
involving closed contours. Hence in (a), we see a circle behind a rectangle, not a broken ring as in (b).
Figure 6.13 An Euler diagram. This diagram tells us (among other things) that entities can simultaneously be
members of sets A and C but not of A, B, and C. Also, anything that is a member of both B and C is also a
member of D. These rather difficult concepts are clearly expressed and understood by means of closed
contours.
ARE6 1/20/04 5:02 PM Page 195
can transfer this understanding to the more difficult formal notation. Stenning and Ober-
lander (1994) theorize that the ease with which Euler diagrams can be understood results
specifically from the fact that they have limited expressive power, unlike fully abstract formal
notation.
Although simple contours are generally used in Euler diagrams to show set membership, we
can effectively define regions using color and texture as well, as discussed in Chapters 4 and 5.
Indeed, by using both we should be able to create Euler diagrams that are considerably more
complex and still readily understandable. Figure 6.14 illustrates.
Closed contours are extremely important in segmenting the monitor screen in windows-based
interfaces. The rectangular overlapping boxes provide a strong segmentation cue, dividing the
display into different regions. In addition, rectangular frames provide frames of reference: the
position of every object within the frame tends to be judged relative to the enclosing frame. (See
Figure 6.15.)
Relative Size
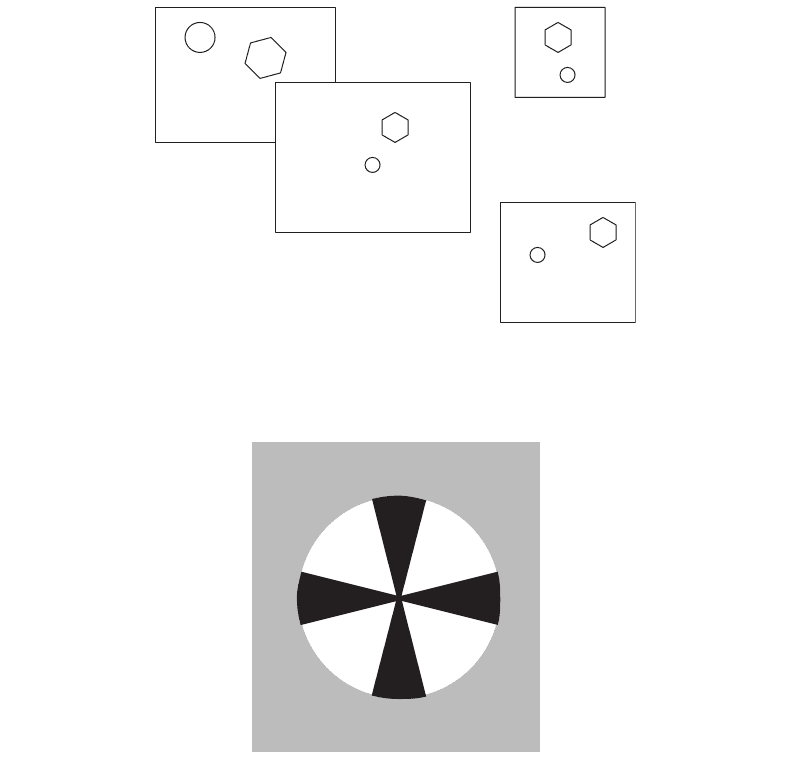
In general, smaller components of a pattern tend to be perceived as objects. In Figure 6.16, a
black propeller is seen on a white background, as opposed to the white areas being perceived as
objects.
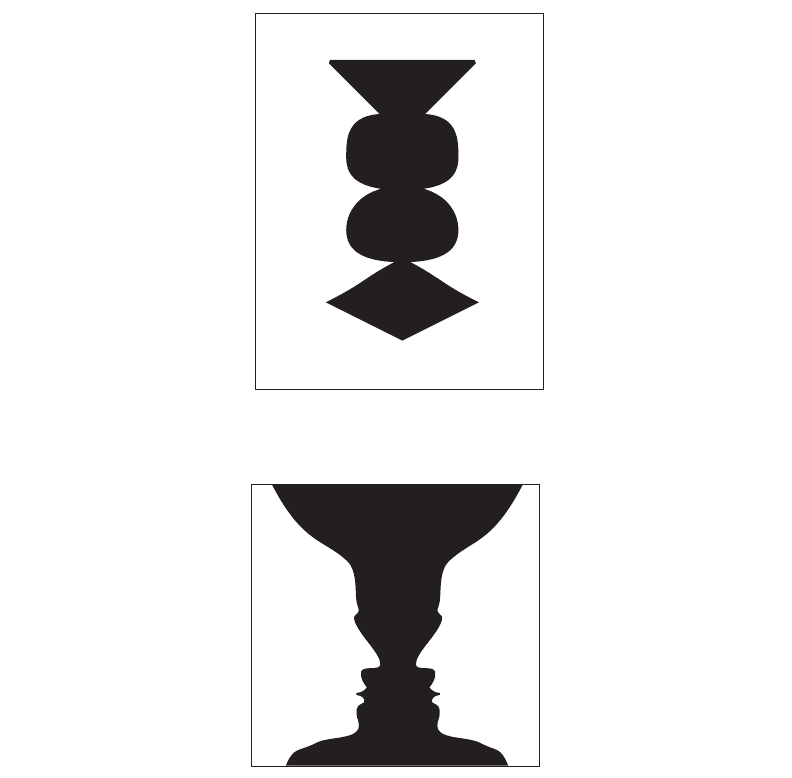
Figure and Ground
Gestalt psychologists were also interested in what they called figure–ground effects. A figure is
something objectlike that is perceived as being in the foreground. The ground is whatever lies
behind the figure. The perception of figure as opposed to ground can be thought of as the fun-
damental perceptual act of identifying objects. All the Gestalt laws contribute to creating a figure,
along with other factors that the Gestalt psychologists did not consider, such as texture seg-
mentation (see Chapter 5). Closed contour, symmetry, and the surrounding white area all con-
196 INFORMATION VISUALIZATION: PERCEPTION FOR DESIGN
ab
Figure 6.14 An Euler diagram enhanced using texture and color can convey a more complex set of relations than a
conventional Euler diagram using only closed contour.
ARE6 1/20/04 5:02 PM Page 196
tribute to the perception of the shape in Figure 6.17 as figure, as opposed to a cut-out hole, for
example.
Figure 6.18 shows the classic Rubin’s Vase figure, in which it is possible to perceive either
two faces, nose to nose, or a black vase centered in the display. The fact that the two percepts
tend to alternate suggests that competing active processes may be involved in trying to construct
figures from the pattern.
Static and Moving Patterns 197
Figure 6.15 Closed rectangular contours strongly segment the visual field. They also provide reference frames. Both
the positions and the sizes of enclosed objects are, to some extent, interpreted with respect to the
surrounding frame.
Figure 6.16 The black areas are smaller, and therefore more likely to be perceived as an object. It is also easier to
perceive patterns that are oriented horizontally and vertically as objects.
ARE6 1/20/04 5:02 PM Page 197
198 INFORMATION VISUALIZATION: PERCEPTION FOR DESIGN
Figure 6.17 Symmetry, surrounding white space, and a closed contour all contribute to the strong sense that this
shape is figure, rather than ground.
Figure 6.18 Rubin’s Vase. The cues for figure and ground are roughly equally balanced, resulting in a bistable percept
of either two faces or a vase.
More on Contours
A contour is a continuous perceived boundary between regions of a visual image. A contour can
be defined by a line, by a boundary between regions of different color, by stereoscopic depth, by
motion patterns, or by texture. Contours can even be perceived where there are none. Figure
6.19 illustrates an illusory contour; a ghostly boundary of a blobby shape is seen even where
ARE6 1/20/04 5:02 PM Page 198
none is physically present. There is extensive literature on illusory contours (see Kanizsa, 1976,
for an early review).
Because the process that leads to the identification of contours is seen as fundamental to
object perception, contour detection has received considerable attention from vision researchers.
There are a number of detailed neurophysiological models designed to explain how contours can
be extracted from the visual image, based on what is known about early visual processing. See
Marr (1982), for example.
Higher-order neurophysiological mechanisms of contour perception are not well understood.
However, one result is intriguing. Gray et al. (1989) found that cells with collinear receptive fields
tend to fire in synchrony. Thus, we do not need to propose higher-order feature detectors,
responding to more and more complex curves, to understand the neural encoding of contour
information. Instead, it may be that groups of cells firing in synchrony is the way that the brain
holds related pattern elements in mind. Theorists have suggested a fast enabling link, a kind of
rapid feedback system, to achieve the firing of cells in synchrony. For a review, see Singer and
Gray (1995).
Fortunately, because a theoretical understanding is only just emerging, the exact mechanisms
involved in contour detection are less relevant to the purpose of designing visualizations than are
the circumstances under which we perceive contours. A set of experiments by Field et al. (1993)
places the Gestalt notion of good continuation on a firmer scientific basis. In these experiments,
subjects had to detect the presence of a continuous path in a field of 256 randomly oriented
Gabor patches (see Chapter 5 for a discussion of Gabor functions). The setup is illustrated
Static and Moving Patterns 199
Figure 6.19 Illusory contour.
ARE6 1/20/04 5:02 PM Page 199
schematically in Figure 6.20. The results show that subjects were very good at perceiving a
smooth path through a sequence of patches. As one might expect, continuity between Gabor
patches oriented in straight lines was the easiest to perceive. More interesting, even quite wiggly
paths were readily seen if the Gabor elements were aligned as shown in Figure 6.20(b).
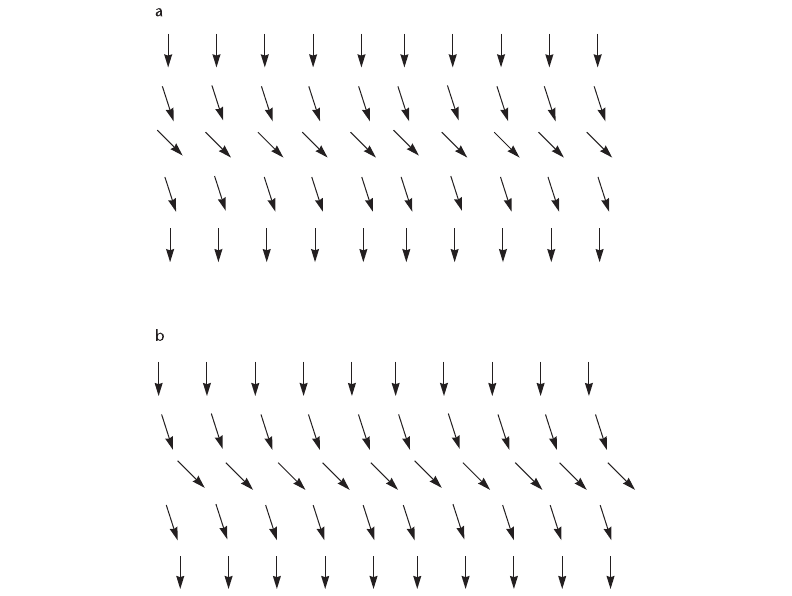
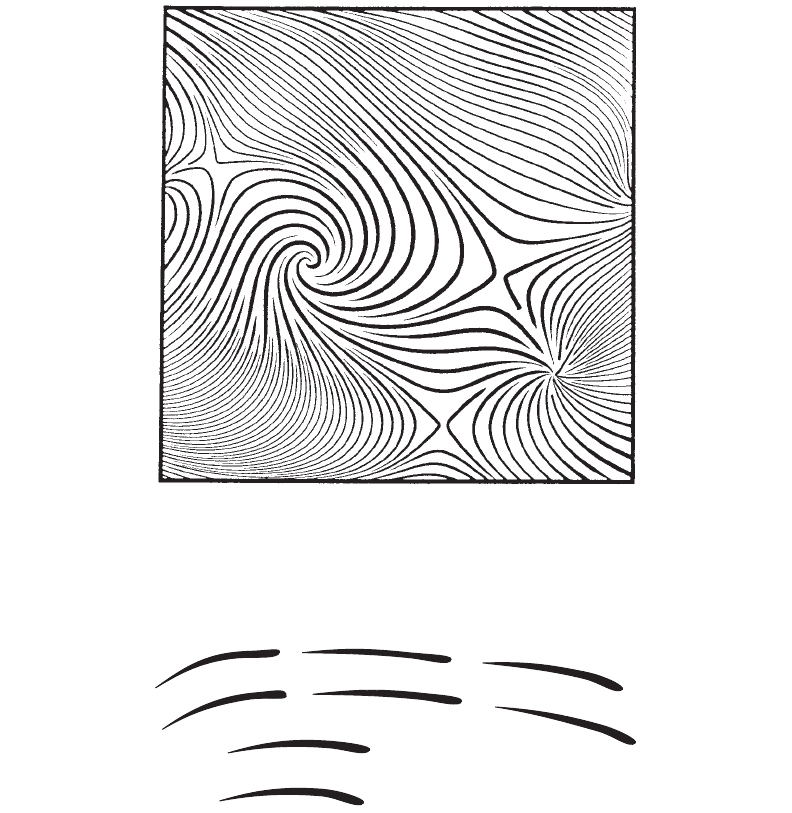
There are direct applications of this result in displaying vector field data. A common tech-
nique is to create a regular grid of oriented arrows, such as the one shown in Figure 6.21. When
the arrows are displaced so that smooth contours can be drawn between them, the flow pattern
is much easier to see.
Perceiving Direction: Representing Vector Fields
The perception of contour leads us naturally to the perceptual problem of representing vector
fields. This problem can be broken down into two components: the representation of orienta-
tion and the representation of magnitude. Some techniques display one component but not both.
Instead of using little arrows, one obvious and effective way of representing vector fields is
through the use of continuous contours; a number of effective algorithms exist for this purpose.
Figure 6.22 shows an example from Turk and Banks (1996). This effectively illustrates the direc-
tion of the vector field, although it is ambiguous in the sense that for a given contour there can
be two directions of flow. Conventional arrowheads can be added, as in Figure 6.21, but the
result is visual clutter. In addition, in Figure 6.22 the magnitudes of the vectors are given by line
density and inverse line width, and this is not easy to read.
An interesting way to resolve the flow direction ambiguity is provided in a seventeenth-
century vector field map of North Atlantic wind patterns by Edmund Halley (discussed in Tufte,
1983). Halley’s elegant pen strokes, illustrated in Figure 6.23, are shaped like long, narrow air-
foils oriented to the flow, with the wind direction given by the blunt end. Interestingly, Halley
also arranges his strokes along streamlines. We verified experimentally that strokes like Halley’s
are unambiguously interpreted with regard to direction (Fowler and Ware, 1989).
200 INFORMATION VISUALIZATION: PERCEPTION FOR DESIGN
Figure 6.20 A schematic diagram illustrating the experiments conducted by Field et al. (1993). If the elements were
aligned as shown in (a) so that a smooth curve could be drawn through some of them, the curve shown
in (b) was perceived. In the actual experiments, Gabor patches were used.
ARE6 1/20/04 5:02 PM Page 200
We also developed a new method for creating an unambiguous sense of vector field direc-
tion that involves varying the color along the length of a stroke. This is illustrated in Figure 6.24.
There was a strong interaction between the direction of color change and the background color.
If one end of the stroke was given the background color, the stroke direction was perceived to
be in the direction of color change away from the background color. In our experiments, the
impression of direction produced by color change completely dominated that given by shape.
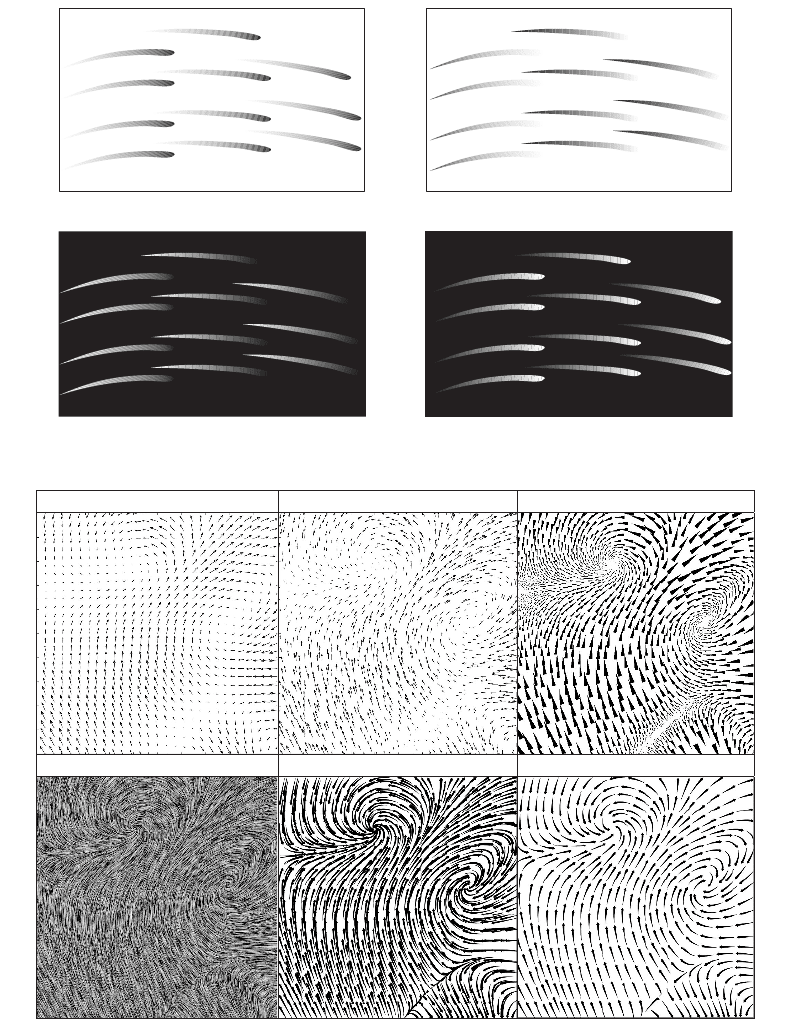
Comparing 2D Flow Visualization Techniques
Laidlaw et al. (2001) carried out an experimental comparison of the six different flow visual-
ization methods illustrated in Figure 6.25 and briefly described as follows.
Static and Moving Patterns 201
Figure 6.21 The results of Field et al. (1993) suggest that vector fields should be easier to perceive if smooth contours
can be drawn through the arrows. (a) A regular grid is used to determine arrow layout. (b) The arrows
have been shifted so that smooth contours can be drawn through the arrows. As theory predicts, the
latter is more effective.
ARE6 1/20/04 5:02 PM Page 201
202 INFORMATION VISUALIZATION: PERCEPTION FOR DESIGN
Figure 6.22 Vector field streamlines are an effective way to represent vector field or flow field data. However, the
direction is ambiguous and the magnitude is not clearly expressed (Turk and Banks, 1996).
Figure 6.23 Drawing in a style based on the pen strokes used by Edmund Halley (1696), discussed in Tufte (1983), to
represent the trade winds of the North Atlantic. Halley described the wind direction as being given by
“the sharp end of each little stroak pointing out that part of the horizon, from whence the wind
continually comes.”
ARE6 1/20/04 5:02 PM Page 202
Static and Moving Patterns 203
Figure 6.24 Vector direction can be unambiguously given by means of color change relative to the background.
abc
def
Figure 6.25 Six different flow visualization techniques evaluated by Laidlaw et al., 2001. Used by permission.
ARE6 1/20/04 5:02 PM Page 203