Water and Wastewater Engineering
Подождите немного. Документ загружается.

12-10 WATER AND WASTEWATER ENGINEERING
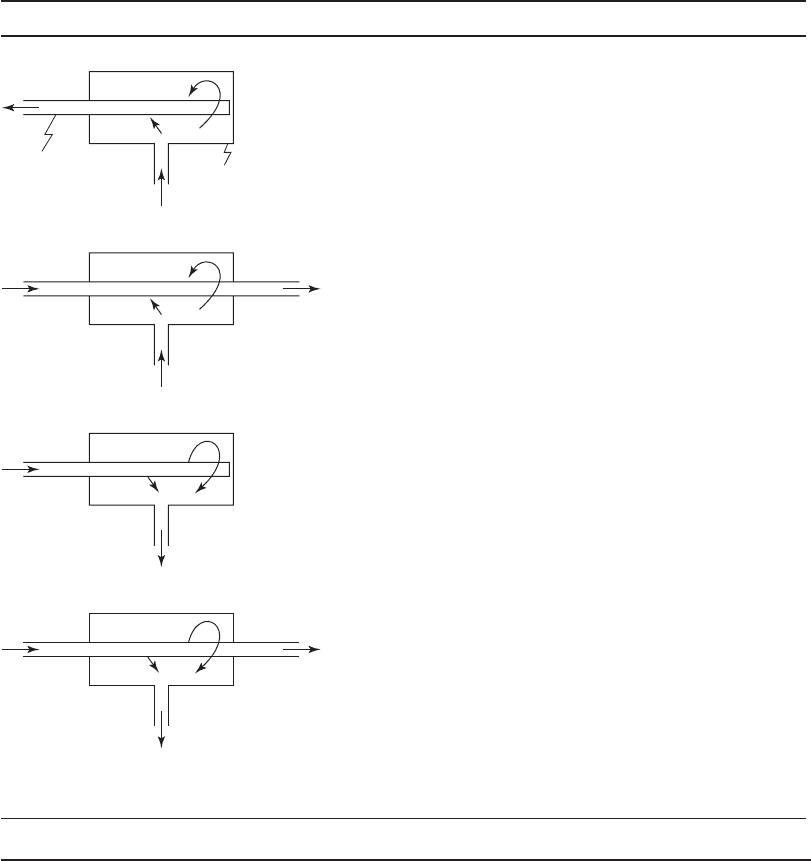
The hollow fiber membranes may be configured in one of four modes: (1) outside-in,
(2) outside-in (cross-flow), (3) inside-out (dead-end), or (4) inside-out (cross-flow). For the out-
side-in system the flow pattern is against the outside of fiber and the permeate is in the lumen or
insi
de the fiber. The inside-out arrangement may be either in the dead-end mode or the cross-flow
mode. The advantages and disadvantages of each mode are summarized in Table 12-4 . Positive
pressure systems use either outside-in or inside-out modes. Vacuum systems use only the out
side-
in mode.
Temperature and Pressure Effects
Flux is inversely proportional to the viscosity. Viscosity changes d ue to changes in water
tem perature are an important design consideration in the treatment of surface water where
the water temperature may range from 1 C to 20 C over the course of a year. The influence
of viscosity may be estim
ated using tables such those found in Appendix A, or the follow-
ing second-order polynomial that is valid over the temperature range 0 C to 35 C (AWWA,
2005):
1 777 0 052625 10
42
.. .TT()
(12-11)
where dynamic viscosity of water, mPa · s
T temperature, C
E xample 12-1 illustrates the effect of temperature change on permeate flux.
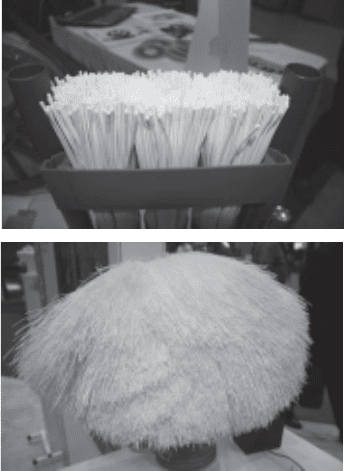
FIGURE 12-5
Hollow fiber membranes
MEMBRANE FILTRATION 12-11
Example 12-1. Estimate the percent change in permeate flux that will result from a temperature
change from 15 C to 20 C if the TMP remains constant.
Solution:
a . Calculate the viscosity at 15 C and 20 C.
1 777 0 052 15 6 25 10 15 1 14
42
.. . .() () mPas
1 777 0 052 20 6 25 10 20 0 987
42
.. . .() () mPas
TABLE 12-4
Comparison of hollow-fiber membrane configurations
Configuration Advantages Disadvantages
• Can treat more water at
same flux because outside
of fiber has more surface
area.
• Less sensitive to presence
of large solids in the feed
water.
• Less expensive to operate
than inside-out in cross-
flow mode.
• Can be operated at higher
flux with high-turbidity
feed water be
cause cross-
flow velocity flushes away
solids and reduces impact
of particles forming cake at
membrane surface.
• Large solids in feed water
can clog lumen.
• Can treat less water at
same flux because inside
of fiber has less surface
area.
• Large solids in feed water
can clog lumen.
• Can treat less water at
same flux because inside
of fiber has less surface
area.
• Pumping costs associated
with recirculating feed
water through lumen can
be expensive.
Outside-in (dead-end model)
Outside-in (cross-flow model)
Inside-out (cross-flow model)
Inside-out (dead-end model)
Hollow fiber
Module shell

12-12 WATER AND WASTEWATER ENGINEERING
b. Using Equation 12-5, determine the change in flux as a function of viscosity.
J
P
J
P
15
15
20
20
()()
()()
R
R
m
m
J
J
R
P
P
R
m
m
20
15
15
20
()()
()()
⎛
⎝
⎜
⎞
⎠
⎟
⎛
⎝
⎜
⎞
⎠
⎟
J
JJ
20 15
15
20
15
114
0 987
()
()
()
.
.
mPa s
mP
aa s
1155
15
.()J
c. Calculate the percent change.
%%%Change increase ()1155 1 000 100 155.. . iin flux
In addition to the change in viscosity, temperature may also have an effect on the membrane
material, such as swelling at higher temperature.
In certain instances, the resistance ( R
m
) of the polymeric membranes has been observed to
increase with increasing transmembrane pressure (Chellam and Jacangelo, 1998). It has been
hypothesized that this effect is a result of compaction of the membrane.
To account for different operating pressures when evaluating membrane alternatives, the
specific flux i s calculate
d. It is the flux at a standard temperature, normally 20 C, divided by the
transmembrane pressure:
J
J
P
sp
st
(12-12)
where J
sp
specific flux, m
3
/h · m
2
· kPa
J
st
flux at standard temperature, m
3
/h · m
2
The specific flux is called the membrane permeability when clean, reagent-quality water is being
filtered through a new, unused membrane.
Service Life
Over time backwash cleaning is not sufficient, and more rigorous cleaning is required. This is
achieved by chemical cleaning ( Figure 12-4 ). Over long periods of time (5 to 10 years), the mem-
branes degrade and they must be replaced (MWH, 2005).
MEMBRANE FILTRATION 12-13
12-4 MF AND UF PRACTICE
Process Description
The pressure vessel system consists of an array of pressure vessels (modu les) on a rack
( Figure 12-6 ). All the modules on a rack are operated in parallel. The racks are also operated in
parallel. The modules are generally 100 to 300 mm in diameter and 1 to 6 m long. The racks may
contain between 2 and 300 mod
ules. One module typically contains between 8 and 70 m
2
of filter
area.
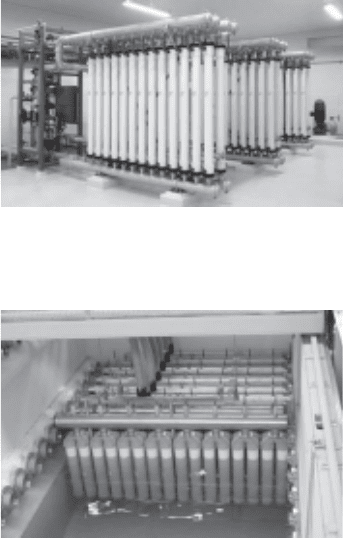
The vacuum systems are open to the atmosphere ( Figure 12-7 ). Multiple basins are employed to
allow for flexible operation as demand varies, as well as placing units out of service for maintenance.
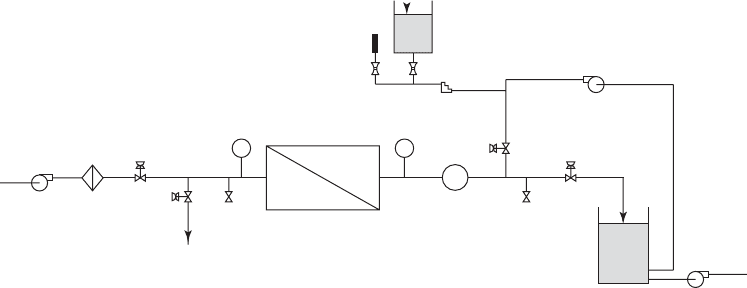
A schematic of a typical positive pressure MF or UF facility is shown in Figure 12-8 .
Pretreatment
If the raw water turbidity and/or NOM concentration is high, pretreatment will include coagula-
tion, flocculation, and sedimentation. Experience with coagulation is mixed with some research-
ers reporting improved performance (increased water production and higher flux, not better
FIGURE 12-6
A 9,500 m
3
/ d pressure installation at Holliday Water Company,
Utah.
( Source: AWWA, 2005.) Reprinted from M53: Microfiltration and
Ultrafiltration and Membranes for Dri king Water, by permission.
Copyright © 2005, Amerocam Water Works Association.
FIGURE 12-7
S ubmerged vacuum MF.
( Source: AWWA, 2005.) Reprinted from M53: Microfiltration and
Ultrafiltration and Membranes for Driking Water, by permission.
Copyright © 2005, Amerocam Water Works Association.
12-14 WATER AND WASTEWATER ENGINEERING
particle removal efficiency) and others reporting increased fouling. It appears that if the design of
the coagulation system (including sedimentation) is to remove a significant fraction of the NOM
(15 to 50 percent), MF membrane performance will be improved, but little improvement may be
expected for UF me
mbranes (Howe and Clark, 2006). The effect of coagulation is site specific
due to the interactions between the coagulants, raw water components, and the membrane materi-
als. In some cases, low doses may cause greater fouling than no coagulation, but higher coagulant
doses for enhanced coag
ulation (for example, 25 to 50 mg/L of alum) frequently reduce fouling.
In any event, performing pilot plant studies over a period of time to exam ine a variety of raw
water conditions is recommended (Bergman, 2005; MWH, 2005).
Where iron and manganese are prevalent in the raw water, oxidation may be performed to
form a precipitate that can be removed before the me
mbrane treatment step. The common oxi-
dants are chlorine, chlorine dioxide, ozone, and potassium permanganate. The use of oxidants
requires careful s election of the membrane material, as well as precautions to remove excess
residual oxidant before the membrane treatment step.
The minim
um pretreatment requirements are established by the membrane manufacturer. In
general, they will include strainers or bag filters rated in the 50 to 500 m size range to protect
the membrane from excessive solids loading (AWWA, 2005; Bergman, 2005).
Concentrate Stream
The primary concern in disposing the concentrate stream is suspended solids. Disposal methods
includ e land application, discharge to the municipal sewer system, ocean discharge, and deep
well injection. Disposal of the concentrate is a major issu
e in the selection of this technology and
should be addressed early in the design process.
Water
supply
Feed
pump
Feed
valve
Backwash
discharge
Feed
sample
point
P1
Membrane
modules
Flow
meter
Backwash
valve
Backwash
pump
Filtrate
valve
Filtrate
sample
point
FM
Filtered
water
reservoir
Distribution
Positive
displacement
pump
Calibration
column
Chlorine
solution
reservoir
Strainer
P1
FIGURE 12-8
S chematic of typical pressure MF/UF facility.
( Source: U.S. EPA Membrane Guidance Manual, 2005.)

MEMBRANE FILTRATION 12-15
Process Design
Membrane Process Selection. The following factors should be considered in selecting the
membrane and membrane process (Bergman, 2005):
• Source water.
• Pretreatment requirements.
• Product water quality requirements.
• Product water quantity requirements.
• Residuals disposal.
• Capital an
d operating cost.
U F membranes are favored over MF membranes if virus or dissolved organic compound removal with-
out raw water pretreatment is a product water quality goal.
Because, at the time of this writing (2009), the use of MF and UF systems is relatively new
to the municipal water treatment ind us
try, consultation with manufacturers and pilot testing is
highly recommended. This is particularly true because of the proprietary nature of the equipment.
Facility design is frequently preceded by “preselection” of the equipment supplier because the
facilit
y is built around the special requirements of the proprietary design.
Operating Pressures. Transmembrane pressure is between 20 and 200 kPa for pressure systems
and from 7 to 80 kPa for vacuum systems. The applied pressure ranges from 70 to 200 kPa.
To minimize fouling the transmembrane pressure should be limited to 100 kPa (AWWA, 2005;
Bergman, 2005; MWH, 2005).
For the direct filtration mode, the transmembrane pressure may be calculated as (AWWA, 2005):
PPP
i p
(12-13)
where
P
transmembrane pressure, kPa
P
i
pressure at inlet to module, kPa
P
p
permeate pressure, kPa
When the system is operated in the cross-flow mode, the average transmembrane pressure is
(AWWA, 2005):
P
PP
P
i o
p
2
(12-14)
where P
o
pressure at outlet of the module, kPa.
There is an accompanying pressure drop across the module (AWWA, 2005):
PPP
i omodule
(12-15)
where
P
module
pressure drop across the module, kPa.
12-16 WATER AND WASTEWATER ENGINEERING
Membrane Element Design. Equations 12-5 and 12-11 are used to design the membrane mod-
ule, rack, and total membrane system. Flux rates range from 0.034 to 0.170 m
3
/h · m
2
( m/h).
In a fashion similar to granular filters, s ome excess capacity is provided to account for racks
being off-line for backwashing and/or maintenance. The flux for MF/UF units treating backwash
water may be as low as one-fourth of that for MF/UF units treating source water (Pressdee et al.,
2006).
Although preliminary
screening estimates of flux and membrane area can be made based on
literature values, for any realistic design, results from pilot testing are required.
Backwashing. The backwash cleaning cycle is automatically controlled. All modules in a rack
are washed simu
ltaneously. Backwashing occurs at some preset interval ranging from 30 to 90
minutes and it las ts 1 to 5 minutes. The off-line time for a rack may be longer than 5 minutes
because of the time inherent in valve sequencing for shut down and start up.
M F systems may be backwa
shed with either air or permeate water. UF systems are back-
washed with permeate water. Because, in general, one rack at a time is backwashed, the design
must ensure that there is sufficient time (plus a factor of safety) for all units to be washed in one
backwash cycle. In general, the backwash supply (air or water) is from a single so
urce, but mul-
tiple sources may be required to clean all racks in the allotted time.
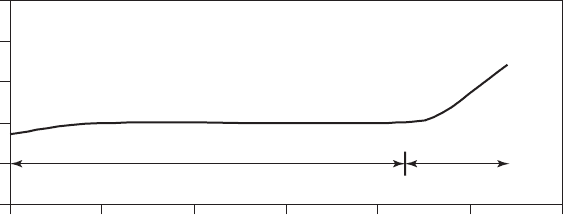
A dding chlorine to the backwash water aids in reducing biofouling as shown in Figure 12-9 .
The test conditions shown were made with 45 s backwash with permeate water containing 3 mg/L
chlorine (Jacangelo et al., 1992). Most sys
tems use air scour during backwash.
Chemical Cleaning. Even with frequent backwashing, membrane performance will deteriorate
over time. The cleaning procedure may take a few hours. The modules may be cleaned in place
(CIP) or may be removed for cleaning. Sufficient excess capac ity or redundancy
must be pro-
vided to maintain production flow rates during the time units are off-line for chemical cleaning.
In addition, the design mu st provide for storage and application of the chemicals and, in some
cases, heating of the cleaning solutions to temperatures of 30C to 40 C.
0
35
70
105
140
175
0 5 10 15 20 25 30
Days of operation
Transmembrane pressure, kPa
Chlorine during backwash
No chlorine during
backwash
FIGURE 12-9
Effect of backwashing with chlorine on membrane fouling.

MEMBRANE FILTRATION 12-17
Example 12-2. Determine the number of modules per rack and the number of racks to provide
uninterrupted flow for the following design conditions:
Q
max
10,000 m
3
/ d
J 0.100 m
3
/h · m
2
M e mbrane area per module 50 m
2
B a ckwash interval 60 min
B a ckwash time 8 min
Solution:
a . Estimate the total membrane area required.
10 000
0 100 24
4 166
3
3 2
,
.
,.
m /d
m /h m h/d()()
667
2
m
b. Estimate the number of modules.
4 166 67
50
8333
2
2
,.
.
m
m /module
modules
c. Because cleaning is by racks, estimate the number of racks that must be cleaned in a
backwash cycle.
60
8
7 5
min/backwash cycle
min/rack
racks/b .aackwash cycle
To provide a safety factor of about 25%, provide treatment capacity in six racks.
d. Estimate the number of modules per rack.
8333
6
13 88 14
.
.
modules
racks
or modules/ra cck
e. Design summary.
1. Provide: 6 racks 1 spare for redundancy 7 racks.
2. Check flux.
J
10 000
614 50
3
, m /d
racksmodules/rack()( )(
mm/module h/d
m /dm
2
3 2
24
0 0992
)( )
.

12-18 WATER AND WASTEWATER ENGINEERING
Comments:
1 . On the average day, the number of racks in service may be considerably less than six.
2. Because the maximu m day demand generally occurs in the summer, a lower water vis-
cosity coupled with a higher TMP may permit a less conservative des
ign.
Design Criteria
Tables 12-3 and 12-5 provide a summary of range of design values for MF and UF membranes.
Operation and Maintenance
In addition to maintaining the mechanical sys tem and providing chem ical cleaning at appropri-
ate times, the system must be carefully monitored to ensure the integrity of the membrane has
not been breached. Routine testing for membrane integrity may be by air pressure tests or sonic
monitoring. In the pressu
re-hold technique, the rate of decay of applied air pressure is monitored.
In the sonic test, an acoustic sensor is placed against a module and the noise of air bubbling
through a breach is detected.
Hints from the Field. The following hints are from Pressdee et al. (2006):
• Long-term pilot studies rather than short-term evaluations are preferred
because the long
testing period allows for identification of source water quality issues that may only occur a
few times per year.
TABLE 12-5
Range of design values for membrane filters
Parameter Range of values Comment
Permeate flux
Pressurized30–170 L/m
2
· h
Vacuum 25–75 L/m
2
· h
Transmembrane pressure (TMP)
Pressurized 20–100 kPa
Vacuum 7 to 80 kPa
Area of membrane/module 8–70 m
2
/module
Modules/rack2–300
Module dimensions
Diameter 100–300 mm
Length 1–6 m
Filter run duration 3090 min
Backwash
Duration 1–5 min
Pressure 35–350 kPa
Flow rate 6 L/min/m
2
Time between chemical cleaning 5–180 d30180 d common

MEMBRANE FILTRATION 12-19
• Prudent design suggests installation of excess membrane capacity to account for irrevers-
ible fouling, aging of membranes, unanticipated changes in water quality, and extreme low
water temperatures in the winter.
• An allowance should be made when commissioning a new plant for an extended soaking ti
me.
A chemical solution recommended by the manufacturer is used to wet new membranes.
Visit the text website at www.mhprofessional.com/wwe for supplementary materials
and a gallery of additional photos.
12-5 CHAPTER REVIEW
When you have completed studying this chapter, you should be able to do the following without
the aid of your textbooks or notes:
1 . Explain to a client the circumstances that favor the use of NF/RO membranes or MF/
UF membranes.
2. Compare the mechanisms of filtration for granular filters and membranes.
3. Explain the role of the pore size and resistance coefficient in the design flux of an MF/
UF membrane.
4. Draw a sketch of the flux or transmembrane pressure as a function of time that shows
reversible and irreversible membrane fouling, and the effect of chemical cleaning.
5. Compare the typical membrane configuration for NF/RO systems with that used for
MF/UF systems.
6. Discuss the effect of coagulation pretreatment on the performance of MF/UF filters.
7. Given water quality goals for viruses and dissolved organic matter, select the appropri-
ate membrane, that is, either MF or UF.
W ith the use of this text, you should be able to do the following:
8 . Calculate rejection, log removal, and percent removal of a constituent by a membrane
filter.
9 . Size a membrane system given the design flow rate and flux, or determine the flux from
the transmembrane pressure, water temperature, and membrane resistance coefficient.
10. Determine the number of MF/UF membrane modules and rack arrangement given the
design flow rate, design flux, membrane area per mo
dule, and backwash cycle.
12-6 PROBLEMS
12-1. What is the equivalent percent reduction for a 2.5 log reduction of Giardia lambia?
12-2. What is the log reduction of Giardia lambia that is equivalent to 99.96% reduction?